


Weekly Briefing: 12/5/21
The Market Ear put it succinctly: "Greed and fear continue to be emotions we can't rationalize."


Performance & Other Observations
US equities declined again last week following the sharp sell-off on Black Friday. US equities also were lower for the first three trading sessions of December. High-quality bonds gained as a risk-off alternative with interest rates trading lower.
Why are risk assets lower?
Virus and growth concerns. Obviously, markets are wrestling with the emergence of the Omicron variant, but more specifically, the government policy response as movement restrictions could hinder growth, especially across Europe where the response has been more aggressive. For now, any move to reduce growth expectations is anticipatory because current economic data has been up-trending for Q4. The Atlanta Fed’s GDPNow model is estimating massive GDP growth of 9.7% for Q4 in the US.
Non-fundamental and technical factors. As we suggested a week ago, markets have reacted rationally in terms of the directional move (lower) in response to virus and growth uncertainty. Non-fundamental/technical factors have added to the magnitude. This includes de-grossing from leveraged hedge fund managers and selling pressure from options dealers who engage in delta hedging for risk management purposes. Non-fundamental/technical factors were discussed in last week’s briefing under Performance & Other Observations.
Fear and (technical) flows seemed to dominate trading last week. Volatility spiked higher.
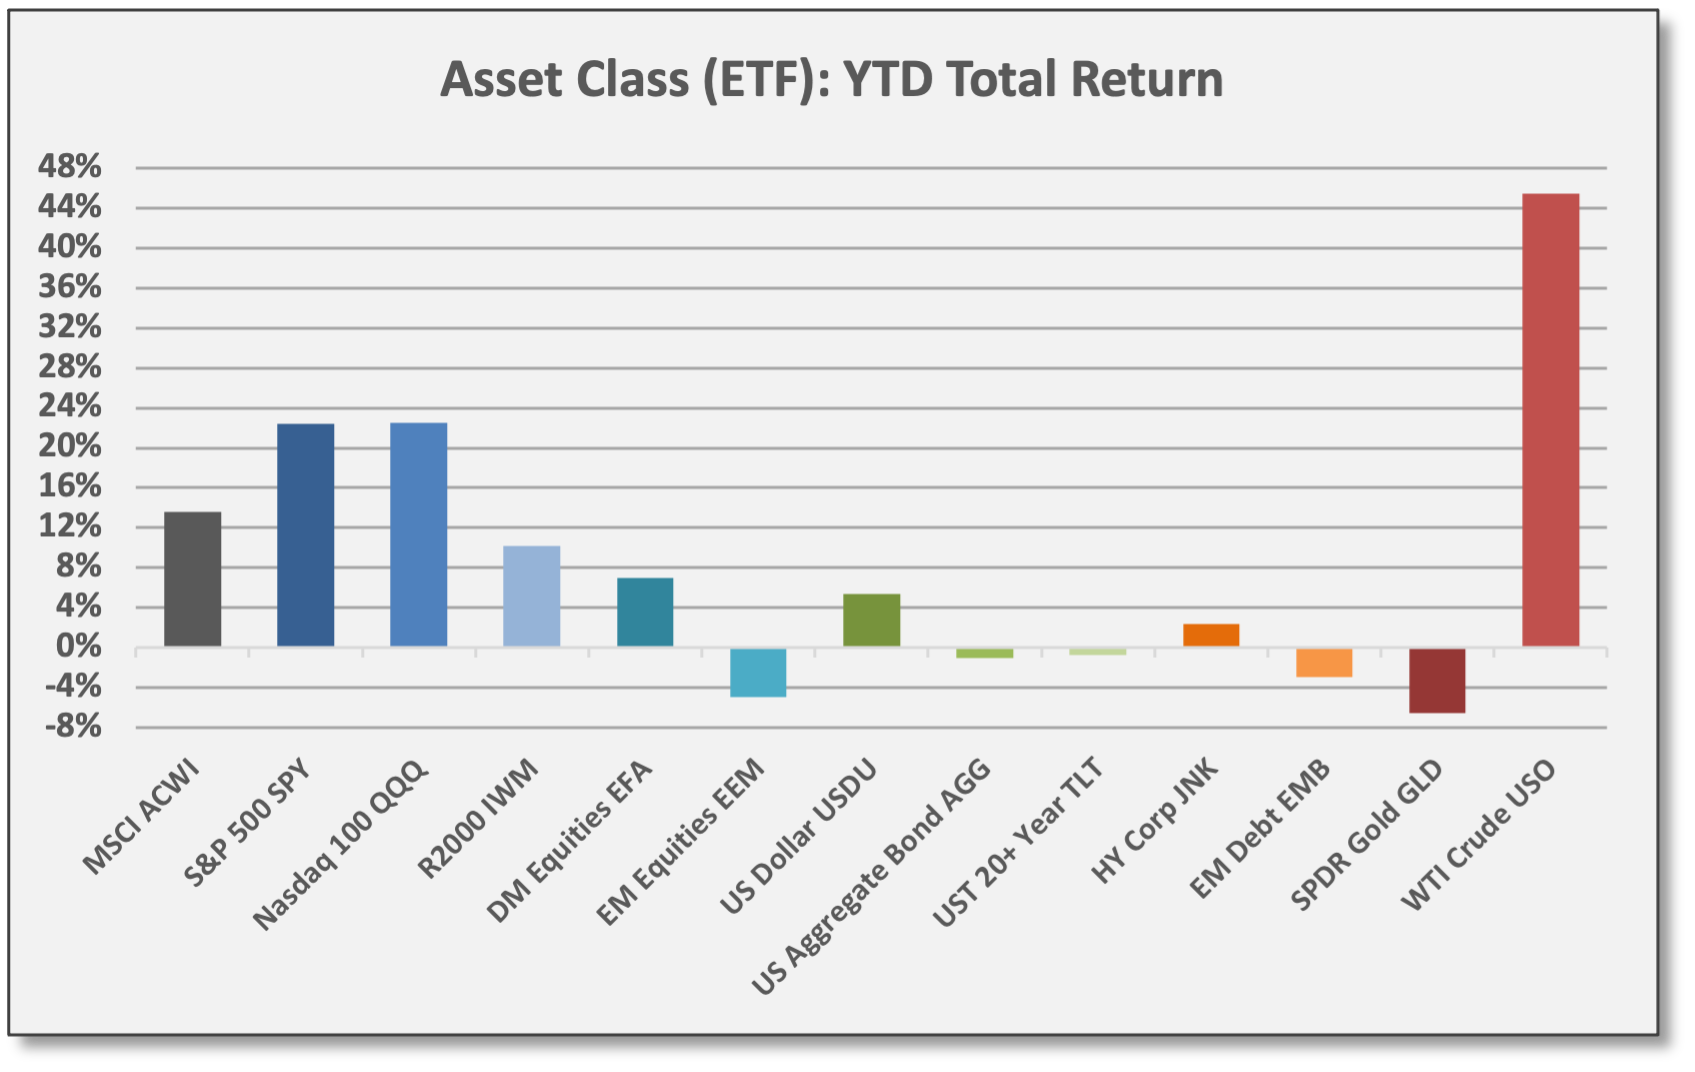
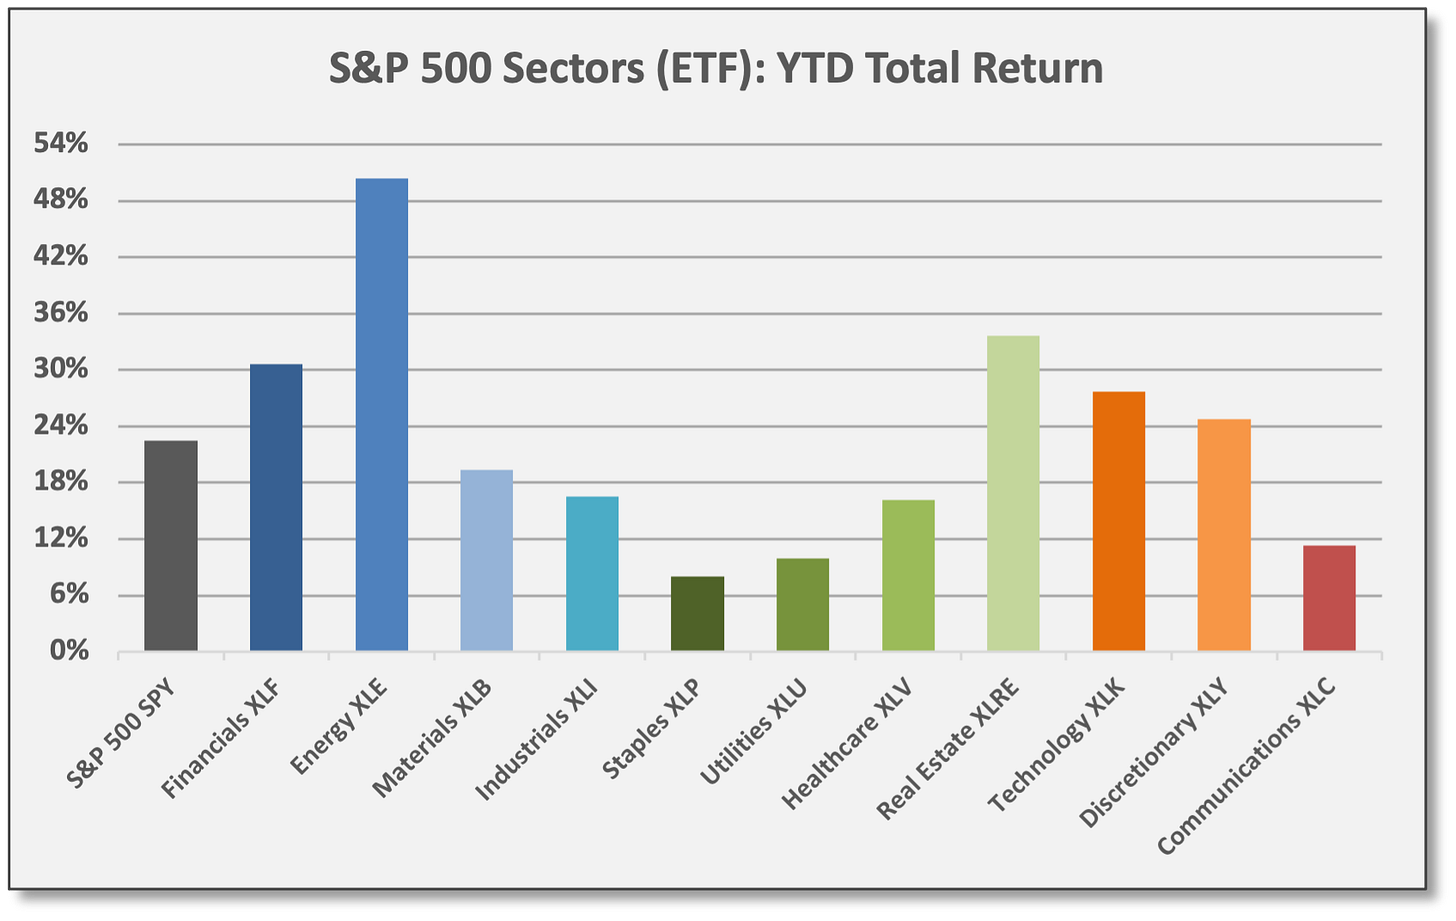
The S&P 500 (SPY) declined -1.2% last week, but sits just 3.5% below its all-time high. For Q4 and YTD, SPY is up 5.7% and 22.5%, respectively. Seasonal patterns suggest early December weakness should be followed by a rebound into year-end, but that remains to be seen.
Across the board, US equities declined last week. Purportedly, cyclical/value was down based on virus-related growth concerns and secular/growth was down due rate hike fears (presuming that higher rates mean lower valuations). As broadly-defined proxies for value and growth, the Russell 2000 (IWM) and the Nasdaq 100 (QQQ) declined -3.7% and -2.1%, last week respectively. For 2021, IWM and QQQ are up 10.2% and 22.6%, respectively.
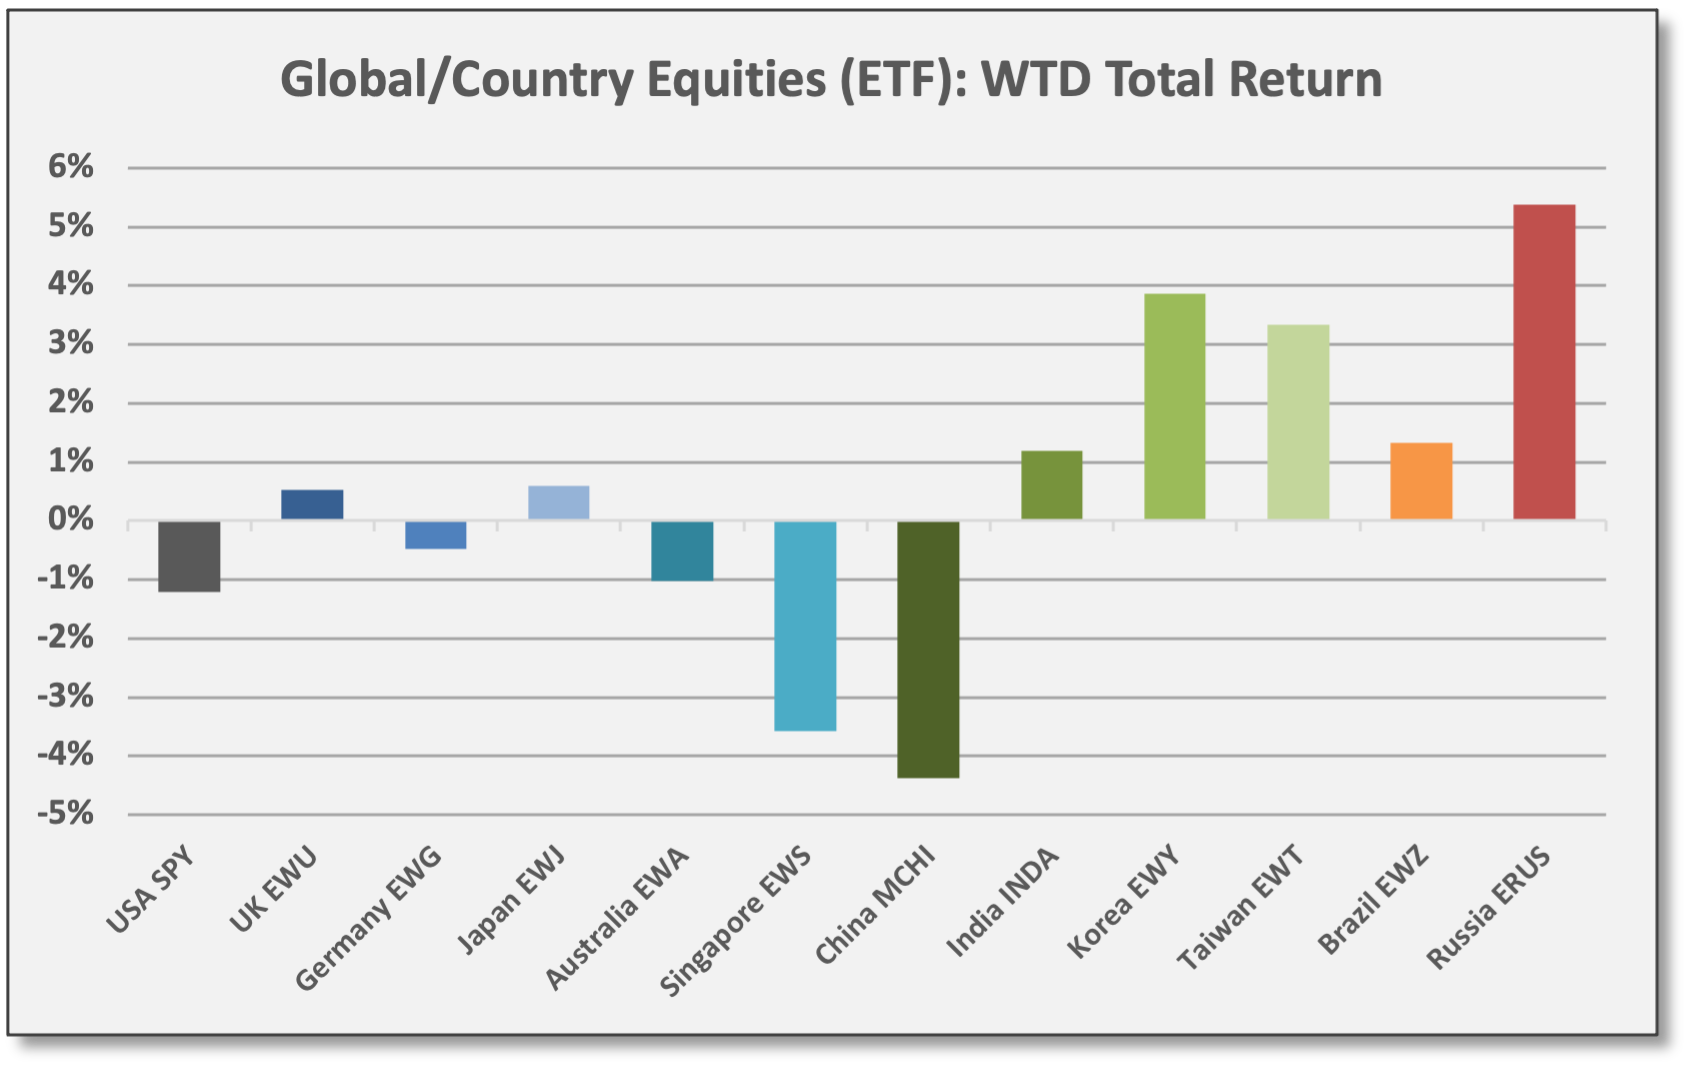
Non-US markets were mixed, but improved to end the week, bouncing after underperforming the previous week. These were the part of the “epicenter” assets that suffered the largest declines when Omicron was initially reported. Developed Markets (EFA) declined -0.1% for the week, but EFA is up 0.3% for December. Emerging Markets (EEM) gained 0.5% for the week. For 2021, EFA is up 7.0%, but EEM is down -4.9%.
Fixed income and credit gained last week. High-quality long-duration bonds were the top performer: UST 20+ Year (TLT) gained 2.7%. US Aggregate Bond (AGG) gained 0.6%. Even high-yield bonds gained as credit spreads tightened a bit; JNK was up 0.9% last week. For 2021, AGG is down -1.0%, but JNK is up 2.4%.
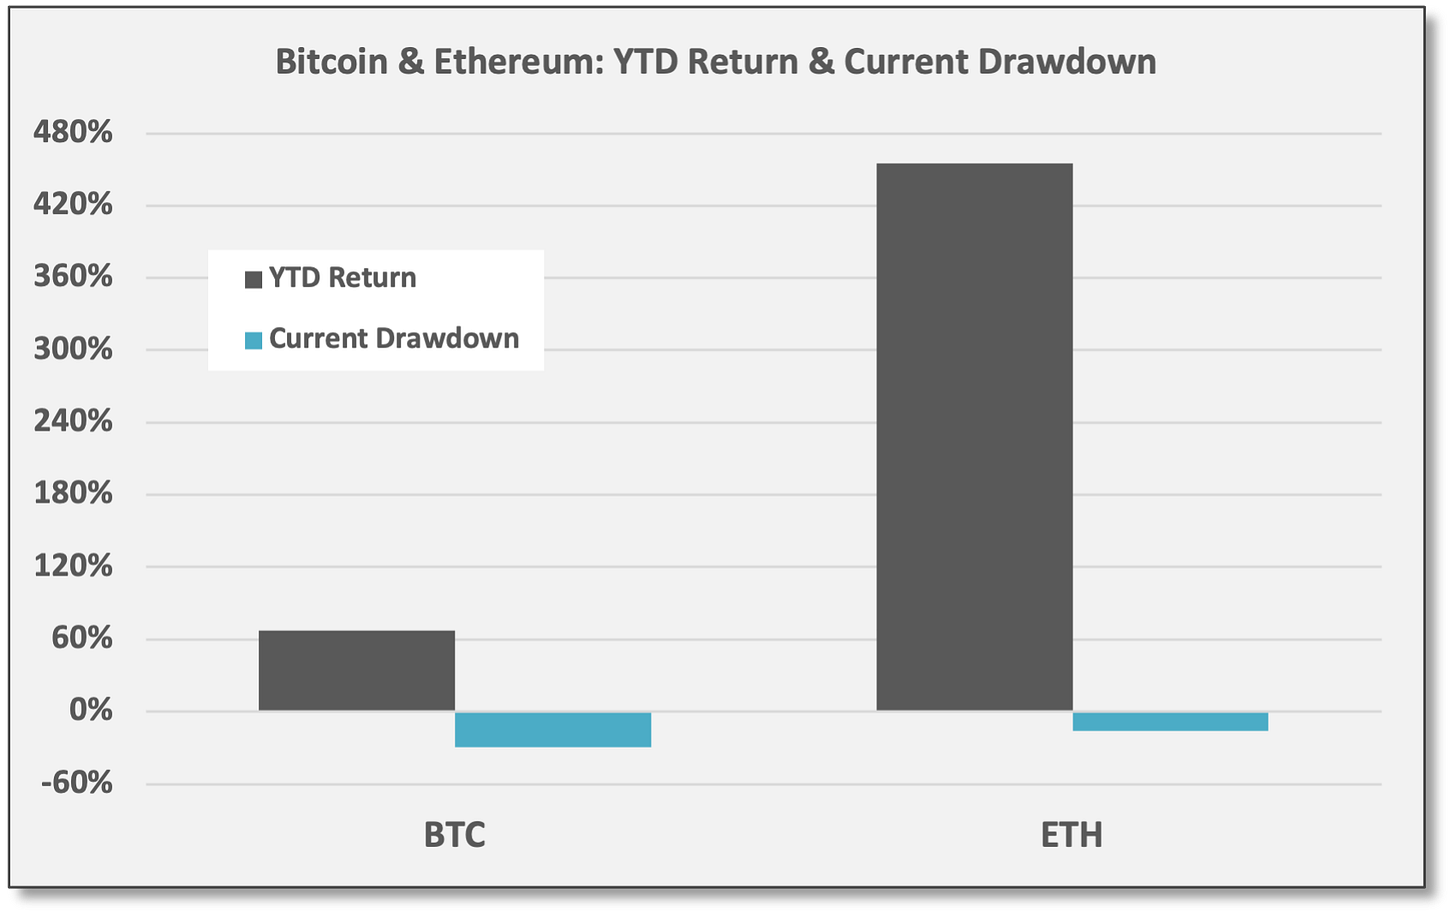
Bitcoin (BTC) and Ethereum (ETH) were suffering drawdowns of -30% and -16%, respectively, as of Sunday morning when we published. More discussion below under Alternative Assets/Strategies.

Sources: CCM, Koyfin 
Sources: CCM, Koyfin

In the new year, the Weekly Briefing will be available ONLY to paid subscribers. To ensure continued full access to Coffee & Capital Markets, please consider joining our research-driven community as a paid subscriber.
Economic Data & Trends
Beyond the NFP headline, US employment showed mostly positive results in November. Non-farm payrolls added 210,000 jobs, the lowest print of the year and well below estimates of 550,000. The “establishment survey” payrolls were not as weak as the headline print, but NFP was still short of expectations even when considering the additional 82,000 jobs in positive revisions for September/October.
Civilian employment, however, added 1.1 million jobs, the largest gain in over a year. Civilian employment includes private small-business start-ups. On the strength of this metric — also referred to as the “household survey” — the jobless rate dropped to a post-COVID recovery low of 4.2%.
“For what it's worth, the degree to which the household survey surprised to the upside is greater than the degree to which the establishment survey surprised to the downside.” Jefferies, 12/3/21
Divergences in the monthly data between non-farm payrolls and civilian employment are not unusual, according to Jefferies, but differences of this magnitude are definitely uncommon. Jefferies: “For what it's worth, the degree to which the household survey surprised to the upside is greater than the degree to which the establishment survey surprised to the downside.”
Meanwhile, total hours worked increased in November with average weekly hours up to 34.8, an increase of 0.5% versus October and the equivalent of 360,000 jobs, according to First Trust.
Employment trends are favorable, but the US is still playing catch-up. US economy is still operating with 3.9 million fewer payroll jobs compared to pre-COVID levels. Over the last 12 months, monthly NFP job gains have averaged 484,000 versus 202,000 for the 12 months (as of Feb 2020) leading up to COVID, so US payrolls are gradually catching up.

Downgrades to GDP growth are coming. With growing reports of Omicron cases — regardless of the variant’s severity — economists and strategists already are scrambling to downgrade GDP growth forecasts for early 2022. This is the case with Goldman Sachs, the IMF, and others. Reducing growth forecasts might be premature, but is precautionary based on assumed movement restrictions, reduced services activity, and renewed manufacturing and supply-chain delays. However, given the strong demand environment — supported by previous monetary/fiscal stimulus and bolstered by strong consumer/corporate balance sheets — growth should only be delayed, not destroyed.
Lower expectations could be easier to beat. Over the history of recessions, and throughout the post-COVID experience, economic growth has been persistently underestimated, especially in the US. Thus, reduced forecasts could make it easier to beat expectations down the road. If Omicron is weaker than feared, 2022 GDP growth might not skip a beat.
Jobless claims higher, but still trending lower. Initial jobless claims surprisingly increased last week to 222,000, but this comes just a week after claims dropped to their post-COVID low. Quirky seasonal factors surrounding the Thanksgiving holiday might be a distortion according to Jefferies. Otherwise, claims are flirting with the lowest levels since 1969.1 Meanwhile, job openings and the voluntary “quit” rate remain near record levels, a signal of employment strength according to the September JOLTS data we referenced in Economic Data & Trends on 11/14/21.
Misery Index should trend lower, lifting consumer sentiment. The Misery Index was created by economist Arthur Okun, a Yale University economist who served under LBJ in the 1960s. The index combines the inflation rate with the unemployment rate. Based on the idea that high levels of inflation and unemployment add stress and discomfort to consumers, lower index levels are better.
With one-year CPI at 6.2% and the jobless rate at 4.2%, the current Misery Index is 10.4%.
In February 2020, before COVID, the index was 5.3% (2.3% CPI and 3.5% unemployment).
Bespoke Investment Group suggested the Misery Index is weighting on consumer sentiment, specifically due to inflation. With the US adding jobs and inflation potentially peaking, the Misery Index should soon turn lower — giving consumer sentiment a boost.
“… if prices stay at their current level for the next year, headline inflation rates [year-over-year] would likely crater… consumer confidence declines are not an indication of a slowing economy.” Bespoke, 12/2/21
Bespoke: “The good news is that further major increases in headline CPI are going to require a major new advance in commodity price indices that are trading at roughly the same level as April (for agriculture) and June (for energy)… if prices stay at their current level for the next year, headline inflation rates [year-over-year] would likely crater. That makes a recovery in consumer confidence over the coming several quarters likely, in our view, and suggests consumer confidence declines are not an indication of a slowing economy.”
Monetary/Fiscal Policy
In Congressional testimony last week, Fed Chair Powell signaled plans to accelerate the tapering of asset purchases. A formal policy announcement should come when the FOMC meets on 12/15. Essentially, Powell outlined what had become the perceived base case as markets were already anticipating this move — before the Omicron reports emerged. In other words, Powell suggested the Fed would move forward despite Omicron.
The Fed’s stance seems logical considering: (1) Omicron looks to have a mild severity, (2) previous COVID variants have been well navigated by US consumers and businesses, and (3) the US appetite for movement restrictions is certainly dwindling if not already non-existent.
Moody markets fearing a policy error viewed Powell’s comments as a half-empty glass… but investors eventually might see the glass as half-full, concluding Powell was signaling persistent strength for the US economy.
However, moody markets fearing a policy error viewed Powell’s comments as a half-empty glass and they were probably hoping for a more soothing message, but tapering and subsequent rate hikes are only a policy mistake if growth deteriorates significantly. Indeed, investors eventually might see the glass as half-full, concluding that Powell was signaling persistent strength for the US economy into 2022 (along with concerns over elevated inflation).
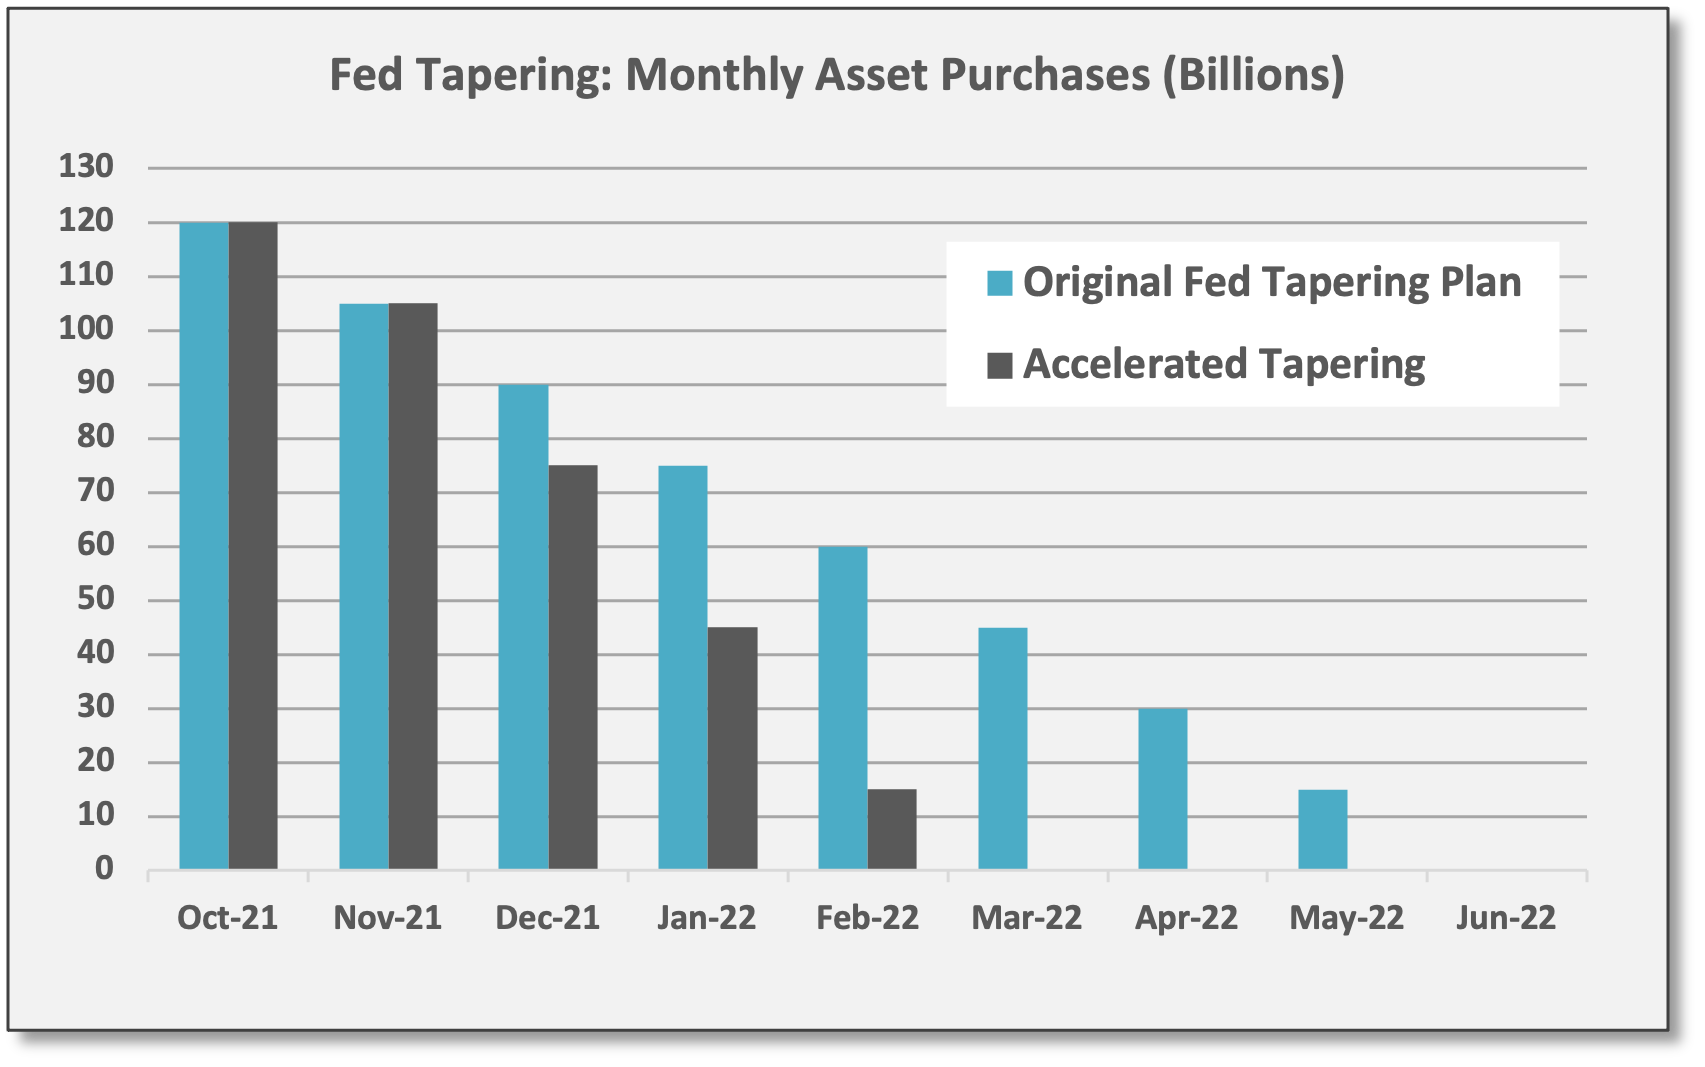
According to various sources, the base case remains: The Fed will accelerate its tapering process so that asset purchases (quantitative easing) end in March; the first rate hike will probably come in June and 2022 could see a total of 2-3 hikes. Assuming three hikes of 25 basis points each, short-term policy rates would reach a target level of 0.75% to 1.00% by December 2022. Currently, Fed Funds futures are pricing an 81% probability of at least two hikes next year.
Fixed Income, Rates & Credit
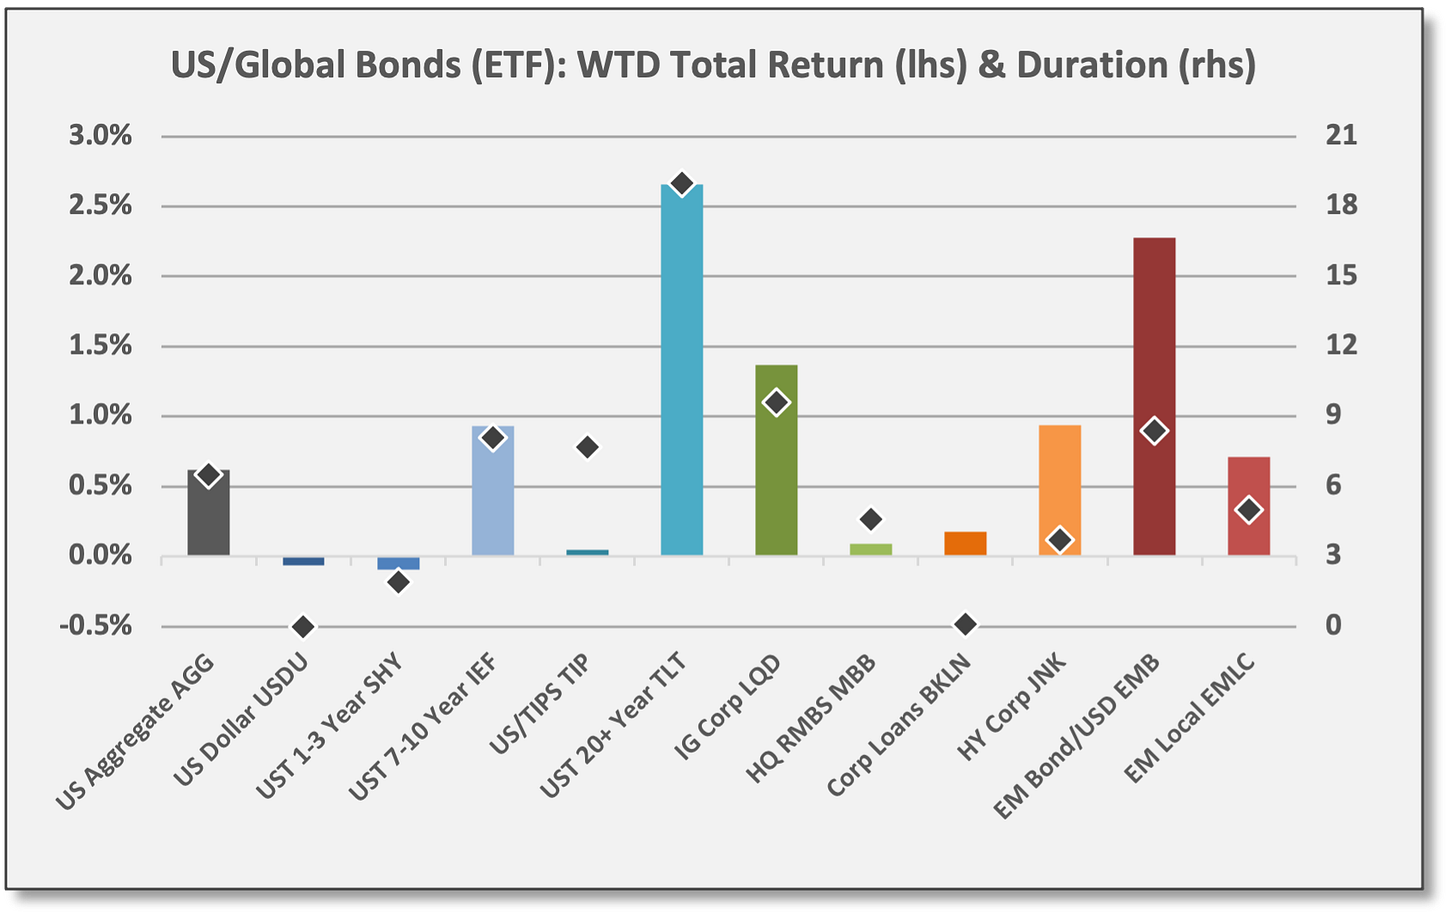
High-quality bonds gained last week along with credit spread strategies. High-quality long-duration bonds were the top performer, delivering “crisis alpha” as interest rates moved lower.
UST 20+ Year (TLT) gained 2.7% last week. For Q4, TLT is up 7.4% as UST 30-year yields have dropped ~40 basis points since 9/30. US Aggregate Bond (AGG) gained 0.6% last week, but is down -1.0% for 2021.
For 2021, the US dollar and inflation-protected securities remain the top-performers. Again, we include the USD in this comparison since the dollar behaves as a safe-haven asset (similar to US Treasury securities). For 2021, UST Inflation-Protected Bonds (TIP) and the US dollar (USDU) are up 5.5% and 5.4%, respectively.
High-yield bonds (JNK) gained 0.9% last week as HY credit spreads tightened to +354 (12/2). JNK is up 2.4% for 2021. Emerging Markets (EMB) gained 2.3% last week, but are down -2.9% for 2021.
Sources: CCM, Koyfin 
Sources: CCM, Koyfin


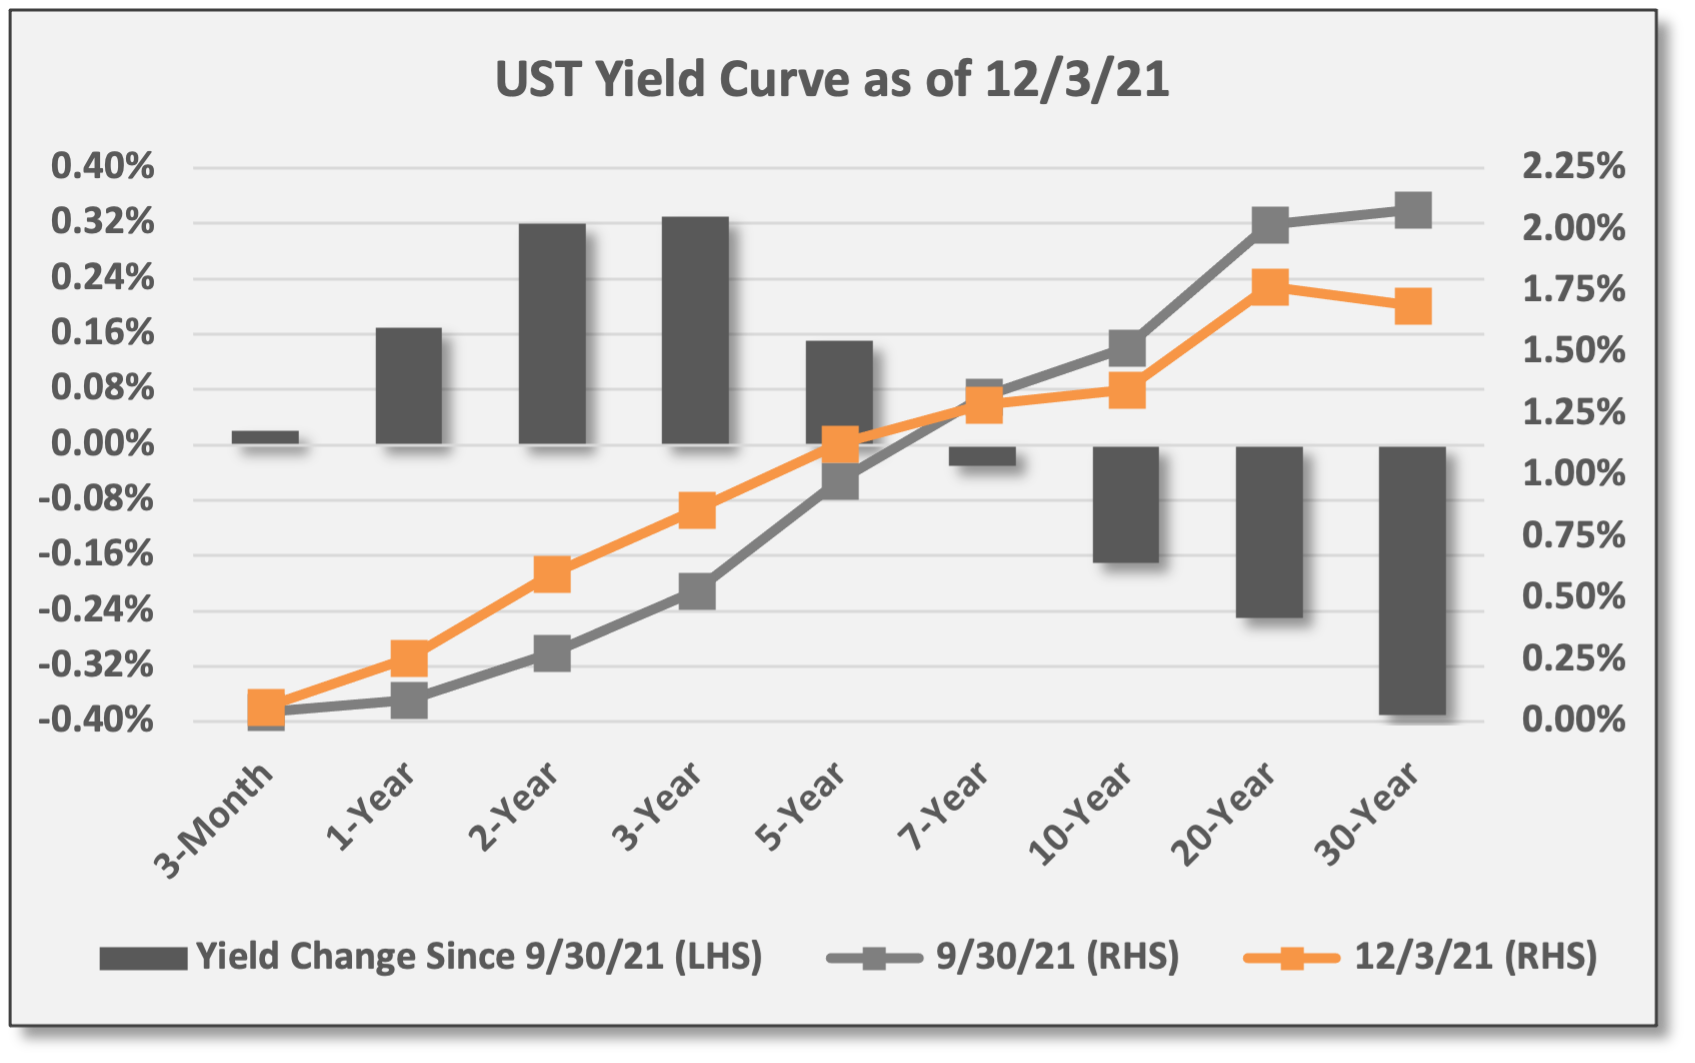
US Treasury yield curve has flattened dramatically in recent weeks. The curve has twisted with long rates moving lower, but short rates moving higher ahead of potential rate hikes next year.
Since 9/30, the yield on the UST 30-year bond has dropped to 1.69% from 2.08% on 9/30. The yield on the bond is up just four basis points for 2021.
UST 10-year yield closed at 1.35% last week, down from 1.52% on 9/30. For 2021, the 10-year yield is 42 basis points higher.
UST 2-year rates have jumped from 0.28% on 9/30 to the current 0.60%.

Sources: CCM, treasury.gov
US/Global Equities
Across US equities, both cyclical/value and secular/growth declined last week, but defensive/yield-oriented Utilities gained and Real Estate protected capital.
S&P Utilities (XLU) gained 1.0% last week as bonds rallied and rates moved lower. Utilities and other defensive/yield-oriented sectors have lagged in 2021.
Financials (XLF) declined 1.9% on lower interest rates and fears of a growth slowdown. Financials (banks) have delivered solid gains for 2021 on the growth recovery and improving credit profiles for borrowers.
Consumer Discretionary (XLY) and Communications (XLC) underperformed last week, dropping -2.2% and -3.2%, respectively. Presumably, the Fed pushing ahead with tapering and rate hikes will lead to higher rates and lower valuations, but a good bit of the recent price action could be simple technical factors.


In non-US markets, Russia (ERUS) was the top performer last week with a gain of 5.4%. Perhaps is was a rebound from oversold levels as ERUS is down for Q4 due to weakness in the Energy sector. For the same reason — concentrated Energy exposure — ERUS is the top performer for 2021 across the leading markets we follow.
MSCI China continued to lag due to weakness in its top Tech/Media holdings.

Sources: CCM, Koyfin 
Sources: CCM, Koyfin

Rising rates do not necessarily equate to secular/growth underperformance. As Bespoke recently summarized, rising rate environments have not necessarily dented secular/growth equities. Recently, high-priced growth equities have declined amid inflation fears and the threat of rising policy rates, but in past periods of extended rising rates, high-growth/high-valuation S&P Technology did just fine.
For an interest rate proxy, Bespoke focused on the UST 10-year note.
Bespoke defined “rising rate environments” as periods where the UST 10-year yield rose 20% or more without a decline of 20% or more in between. Conversely, “falling rate environments” were defined as periods where the UST 10-year yield fell 20% or more without an increase of 20% or more in between.
On the basis of these definitions, Bespoke identified 15 rising rate environments and 15 falling rate environments since 2010.
As illustrated below, Technology outperformed the S&P 500 during past periods of rising rates. Returns reflect median cumulative return (not annualized).

Sources: CCM, Bespoke INvestment Group

From current levels, a 20% move higher implies a UST 10-year yield of 1.62%. The 10-year was at 1.64% before the Thanksgiving holiday. Will Technology underperform the next time rates move higher? Maybe so, or maybe Technology regains tractions after an initial valuation adjustment. Assuming rates are moving higher due to an inflationary expansion (not stagflation), and provided Technology continues to deliver above-market profit growth (not implausible, especially considering CAPEX spending is expected to increase), the Tech sector could hold its own even if valuations are tempered.
Finally, Bespoke’s analysis focused on performance of the Technology sector, but we believe the logic applies to other high-valuation secular/growth assets as well — at least for businesses with real EPS growth (as opposed to speculative innovators that burn capital and have yet to generate positive net income).
Commodities & Real Assets
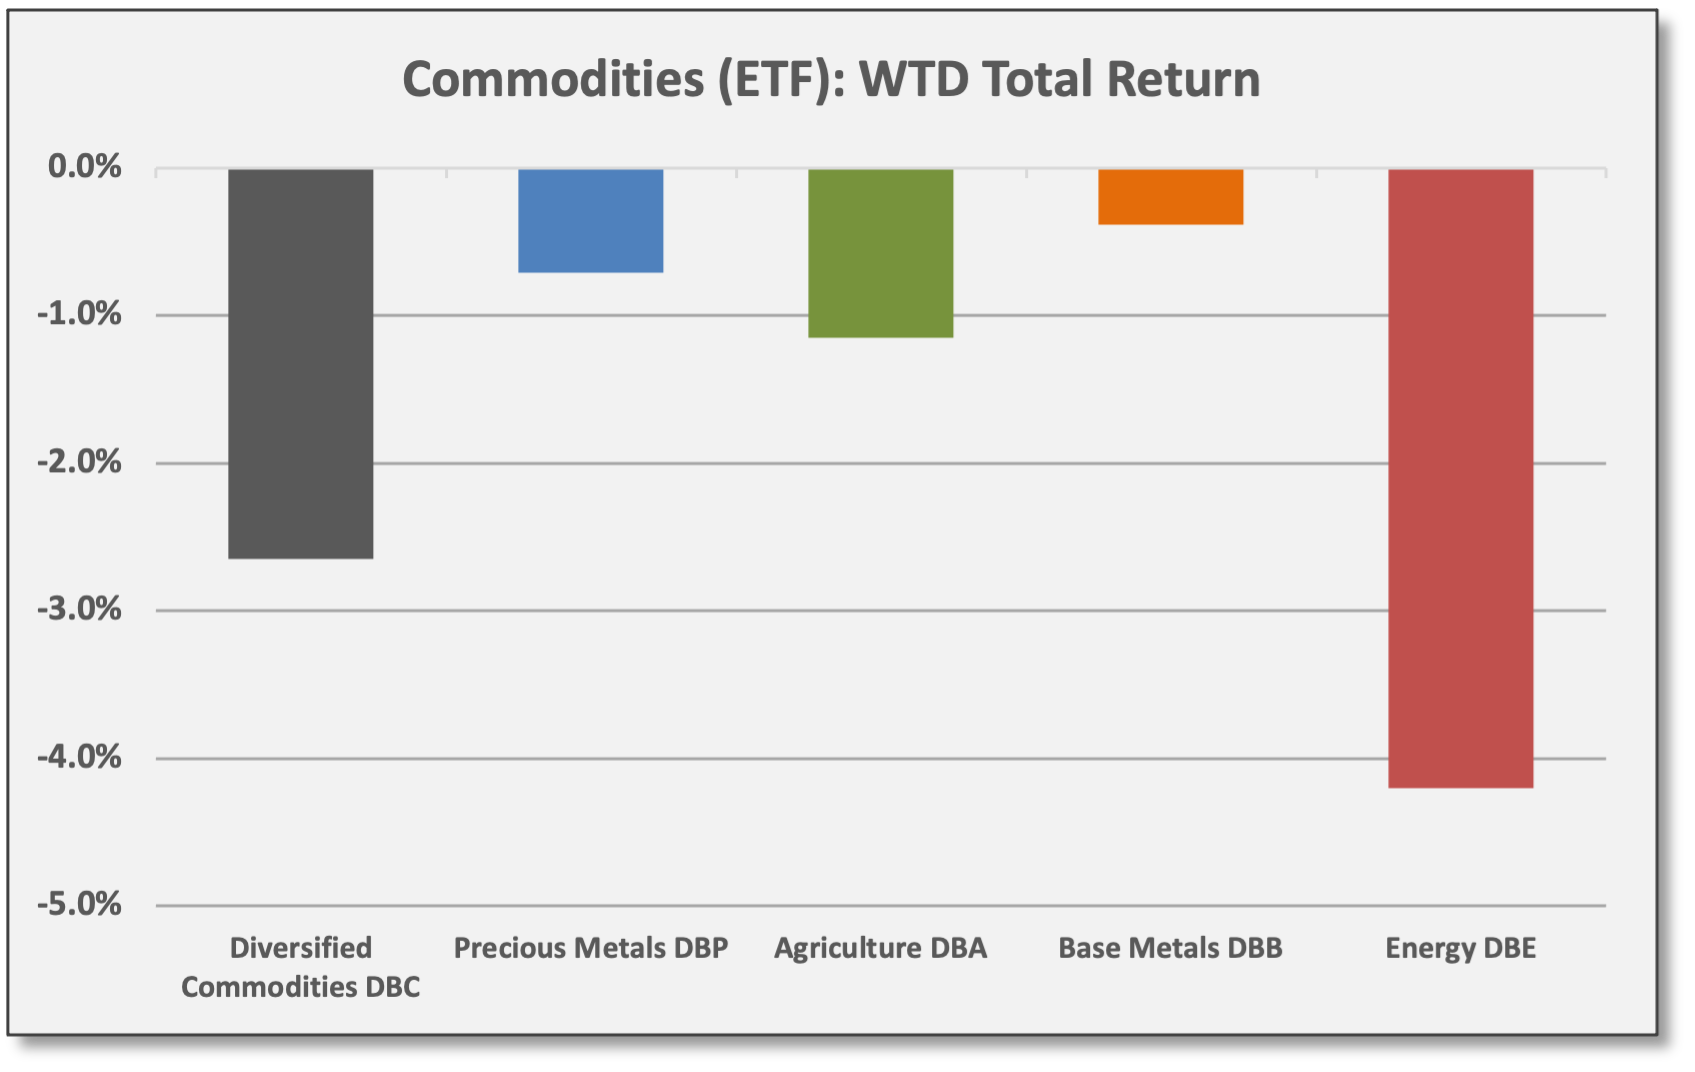
Growth-sensitive energy commodities suffered the most last week.
Energy (DBE) declined -4.2% last week. Energy remains down in Q4, but is up 43.1% for 2021 based on early-year gains. WTI Crude closed last week at $66.26 per barrel. OPEC and Russia announced plans to increased oil production by 400,000 barrels per day starting in January.
Precious Metals (DBP) declined -0.7% last week. Gold has struggled and mostly failed as a safe-haven asset and inflation hedge. SPDR Gold (GLD) is up 1.5% for Q4 as inflation concerns have ramped higher, but GLD is down -6.6% for 2021.

Sources: CCM, Koyfin 
Sources: CCM, Koyfin

Merrill Lynch, CIO as of 11/29: “The future may be green, but black (coal) is back. It’s a fossil-driven world, and the transition to green energy will be measured in decades, not years. We’re not recommending bad behavior in light of the outsized gains in coal but continue to recommend Energy as a sector overweight and remain long-term bulls on many key Commodities that could fuel the Green Revolution.”
Volatility, Flows/Positioning & Sentiment
Realized and implied (expected) volatility increased last week.
The CBOE Volatility Index (VIX) jumped to 30.67. The spot VIX measures expected volatility for the S&P 500 over the next 30 days based on option prices.

Sources: CCM, VIX Central At a level of 30.67, the VIX implies the underlying S&P 500 Index will move up/down ~1.9% per day for the next 30 days.
Realized vol for the S&P 500 (SPY) has averaged a 1.5% daily move over the last six trading sessions, (based on closing prices). The high/low intraday move has been wider. 10-day realized volatility has surged to 19.52% (annualized rate). Realized volatility had been trending much lower during the better-than-expected Q3 earnings season.

Sources: CCM, Yahoo! Finance


Multiple sources reported de-grossing by leveraged hedge fund strategies. Price action — indiscriminate selling — suggested this to be the case. De-grossing occurs when long/short fund managers reduce gross exposures, selling long positions and covering (buying) short positions. As an aside, such deleveraging periods tend to result in underperformance for equity market neutral funds as (1) long positions lose amid selling pressure and (2) short positions lose due to short covering (buying pressure).
“The market is currently pricing both worse growth (bad for cyclicals and re-opening stocks) and more inflationary pressure on the Fed (which means higher real rates and valuation headwinds for long-duration growth stocks).” The Market Ear, 12/2/21
The Market Ear quoted the Goldman Sachs trading desk on 12/2: "We saw aggressive [hedge fund] de-grossing over final one hour of [the] session [with long-only managers] firmly on the sidelines.” TME then offered their own perspective: “Are we being served up a dangerous cocktail for the festive season? The market is currently pricing both worse growth (bad for cyclicals and re-opening stocks) and more inflationary pressure on the Fed (which means higher real rates and valuation headwinds for long-duration growth stocks).” All that being said, GS suggested the recent de-grossing could be a sign of capitulation assuming the de-risking of gross exposures is nearly complete.
Alternative Assets/Strategies
JPMorgan hosted its inaugural Crypto Economy Forum last week with a diverse set of investors and companies from across the crypto/digital ecosystem.
According to JPM, sentiment was “very bullish” for the crypto ecosystem and the Web3.0 decentralized digital marketplace.
Institutional acceptance has increased this year, but is “far from being exhausted,” per JPM, so there is potential for further growth. Regulations were identified as a concern and “wildcard” but only as an impediment to slow the pace of growth, not derail it. Moreover, some have suggested greater regulation could support further institutional acceptance although it might change the appeal and performance profile.
JPM ran correlations for bitcoin (BTC) and Ethereum (ETH) versus various equities related to crypto/digital assets — either directly exposed, like Coinbase (COIN) and Micro Strategy (MSTR), or indirectly like Tesla (TSLA). Obviously, shares with high-correlation provide investors with exposure/participation to the crypto/digital theme.

Sources: CCM, JPMorgan Coinbase Global (COIN), Galaxy Digital (GLXY), MicroStrategy (MSTR), and Marathon Digital (MARA) show the largest correlations to BTC/ETH. In the graph, public equities are ranked based on size from left to right ranging from Tesla (TSLA) with a market capitalization of $1.0 trillion to MARA at $4.5 billion.
TSLA reported BTC holdings of $1.3 billion as of 9/30/21.

Bitcoin and Ethereum are in drawdowns. Both cryptocurrencies are experiencing a drawdown, but especially bitcoin.
BTC closed last week at 53,633 but it trades 24/7 and traded lower over the weekend. As of Sunday when we published, BTC was trading at 48,569 for a YTD gain of 68% despite a current drawdown of -30%.
ETH closed last week at 4,216 but also traded lower over the weekend. As we published, ETH was trading at 4,099 for a YTD gain of 455% despite a current drawdown of -16%.
Sources: CCM, Coinbase Global

“Innovation, freedom hedging all sounds great, but the psychology of the crowd stays the same. Greed and fear continue to be emotions we can't rationalize.” The Market Ear, 12/5/21
The Market Ear, 12/5: “If BTC is a freedom hedge or not we leave to you to decide…Stuff like ARKK and BTC is basically representing the aggregate psychology of the market on steroids. It was the most extreme stuff on the way up and it is the most sensitive stuff on the way down. Innovation, freedom hedging all sounds great, but the psychology of the crowd stays the same. Greed and fear continue to be emotions we can't rationalize.”
Portfolio Construction & Trading Ideas
California Public Employees Retirement System recently made a decision to add leverage to its investment portfolio.
Going forward, the fund will deploy 5% leverage. Essentially, CalPERS will operate with gross exposure of 105%.
CalPERS will use the additional allocation to target “opportunistic” strategies to “better diversify” the fund to protect against “serious drawdowns during economic downturns,” according to a report from Opalesque. No detail was offered concerning the specific assets/strategies to be considered.
In addition, CalPERS will reduce exposure to public equities, but add exposure to private equity, real assets, and fixed income.

Sources: CCM, Opalesque

The proposed portfolio is set to take effect 7/1/22 at the start of the next fiscal year. CalPERS operates with a 6.8% return target.
The best strategies for a leveraged portfolio structure are those with strong diversification attributes, including low-volatility hedge fund strategies. Specifically, low-correlation and low-volatility strategies where returns are sourced primarily from skill-based “alpha” as opposed to simple equity market (or credit) betas. When we suggest low-vol diversifiers are the best strategies for a leveraged approach, we are assuming investors aim to enhance overall performance consistency by improving risk-adjusted returns and also adding to absolute return potential. By contrast, using leverage for directional long-biased equities would unequivocally add risk to a portfolio, amplifying both volatility and return potential.
Ironically, CalPERS decided to eliminate its exposure to hedge funds in 2014. CalPERS’ size — $469 billion as of 6/30/21 — was a determining factor as its large asset base evidently hindered its ability to make meaningful allocations to such funds. Institutional and private investors, however, should not be dissuaded from exploring such strategies in our view.
Ideal candidates for improving diversification and risk-adjusted performance include various low-beta (market neutral) and relative value strategies, including multi-PM fund managers like Millennium Management, Balyasny Asset Management (BAM), or Verition Fund Management.
Such managers may invest in US/global equities, fixed income and credit securities, commodities, futures, options, and swaps.
They invest both long and short and tend to operate with low net exposures, but high gross exposures. For instance, compared to its investor capital base, a fund might have gross long market value of 200% and gross short market value of 195% for gross and net exposure of 395% and 5%, respectively.
In such a balanced, neutral approach, PMs are striving to capture small price disparities between related securities. Contributions from individual trades tend to be small, so the use of leverage boosts volatility and return potential to acceptable levels.
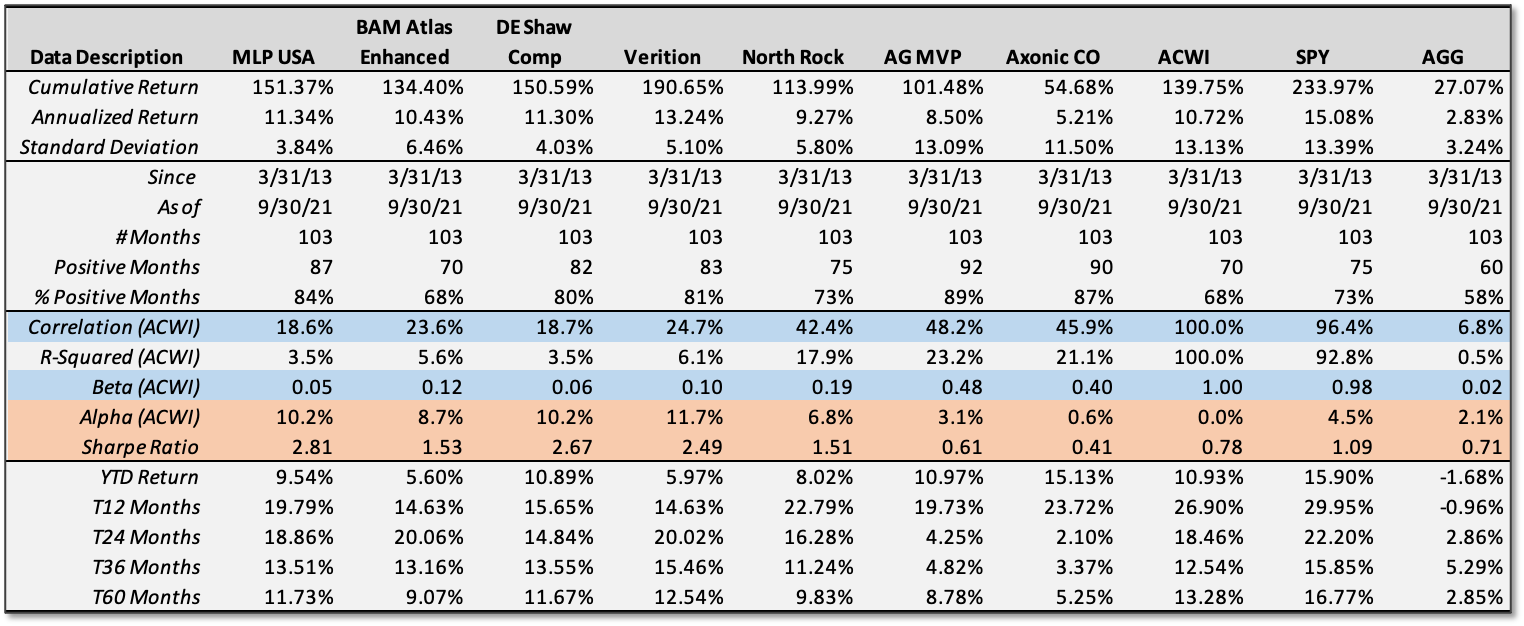
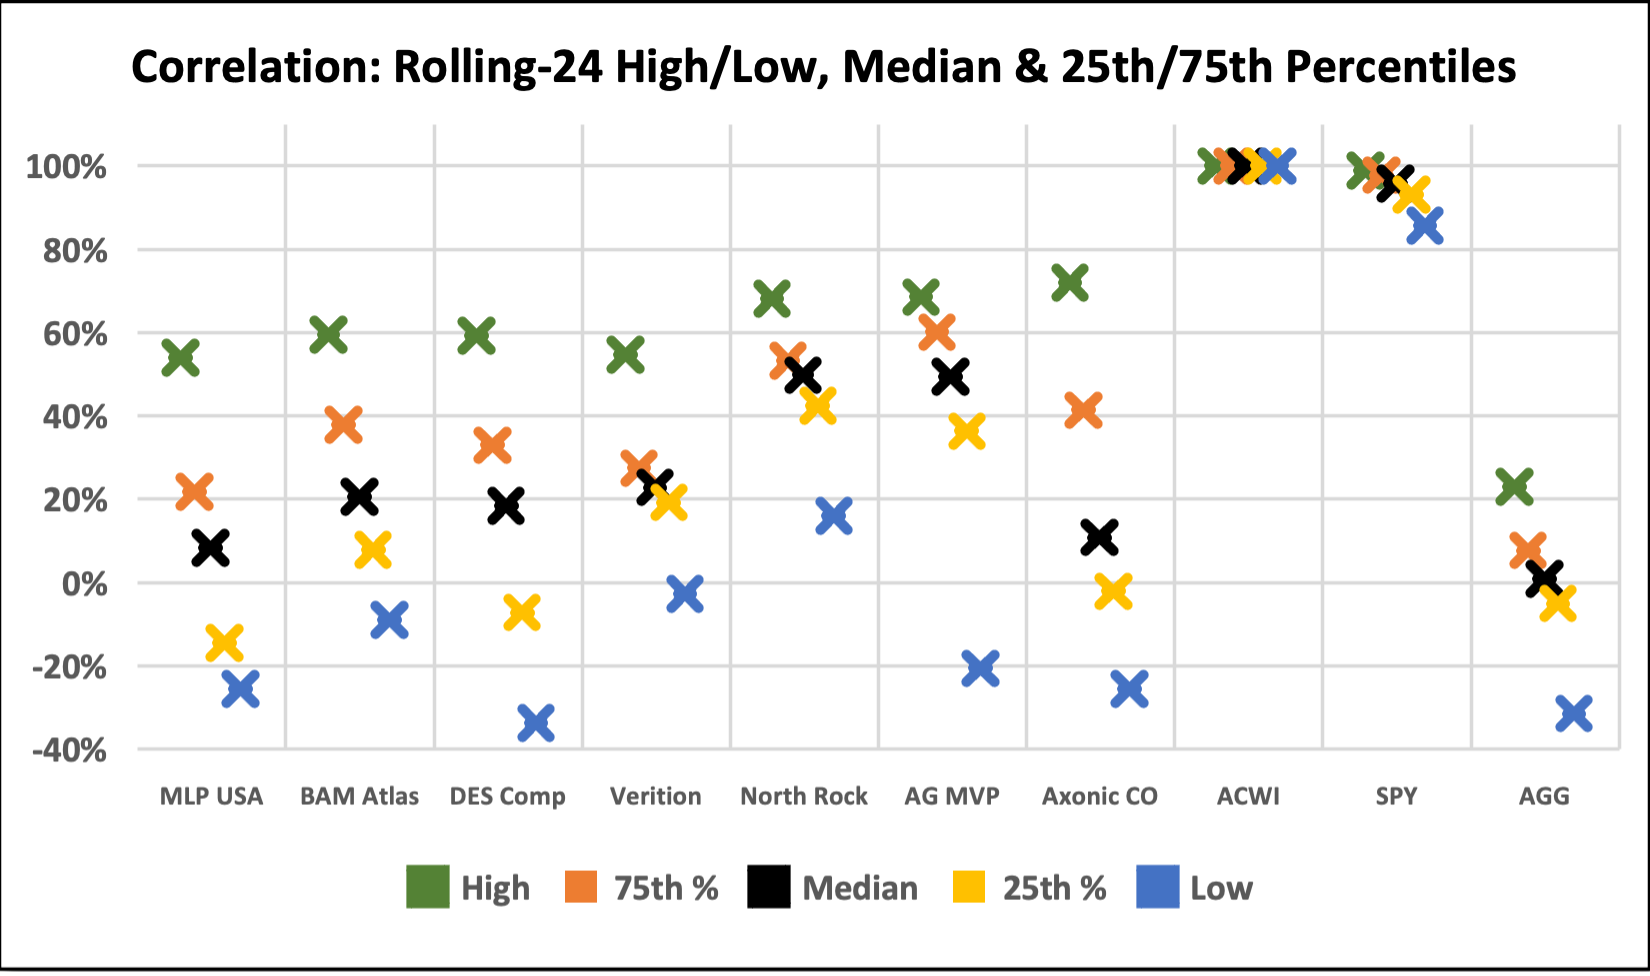
Rolling-Period Consistency Analysis (RPCA): Below we share full-period analysis as a reference. More importantly, we offer rolling-period analysis to illustrate performance consistency over 24-month holding periods. Our definitions and the rationale for RPCA is provided at the bottom of this section.
Seven active fund managers are included in this analysis:
Millennium Management (MLP USA): Low-beta multi-strategy fund using a multi-PM platform. Mostly equities, but also fixed income and commodities.
BAM Atlas Enhanced (BAM Atlas): Low-beta multi-strategy fund using a multi-PM platform. Mostly equities, but also fixed income and commodities.
DE Shaw Composite (DES Comp): Low-beta quantitative-based multi-strategy fund. Mostly equities, but also fixed income and commodities.
Verition Fund Management (Verition): Low-beta multi-strategy fund using a multi-PM platform. Mostly equities, but also fixed income and commodities.
North Rock Fund (North Rock): Low-beta multi-strategy fund using a multi-PM platform. Exclusively focused on equities.
Angelo Gordon Mortgage Value Partners (AG MVP): Relative value and multi-strategy credit fund with an emphasis on mortgage/asset-backed securities.
Axonic Credit Opportunities (Axonic CO): Relative value and multi-strategy credit fund with an emphasis on mortgage/asset-backed securities.
The full analysis period runs from March 2013 to September 2021 — the longest common period for the seven fund managers. The full period spans 103 months and 80 rolling 24-month periods.
Performance data for the full analysis period of 3/2013 to 9/2021: Correlation, beta, and alpha metrics are measured against the MSCI ACWI.

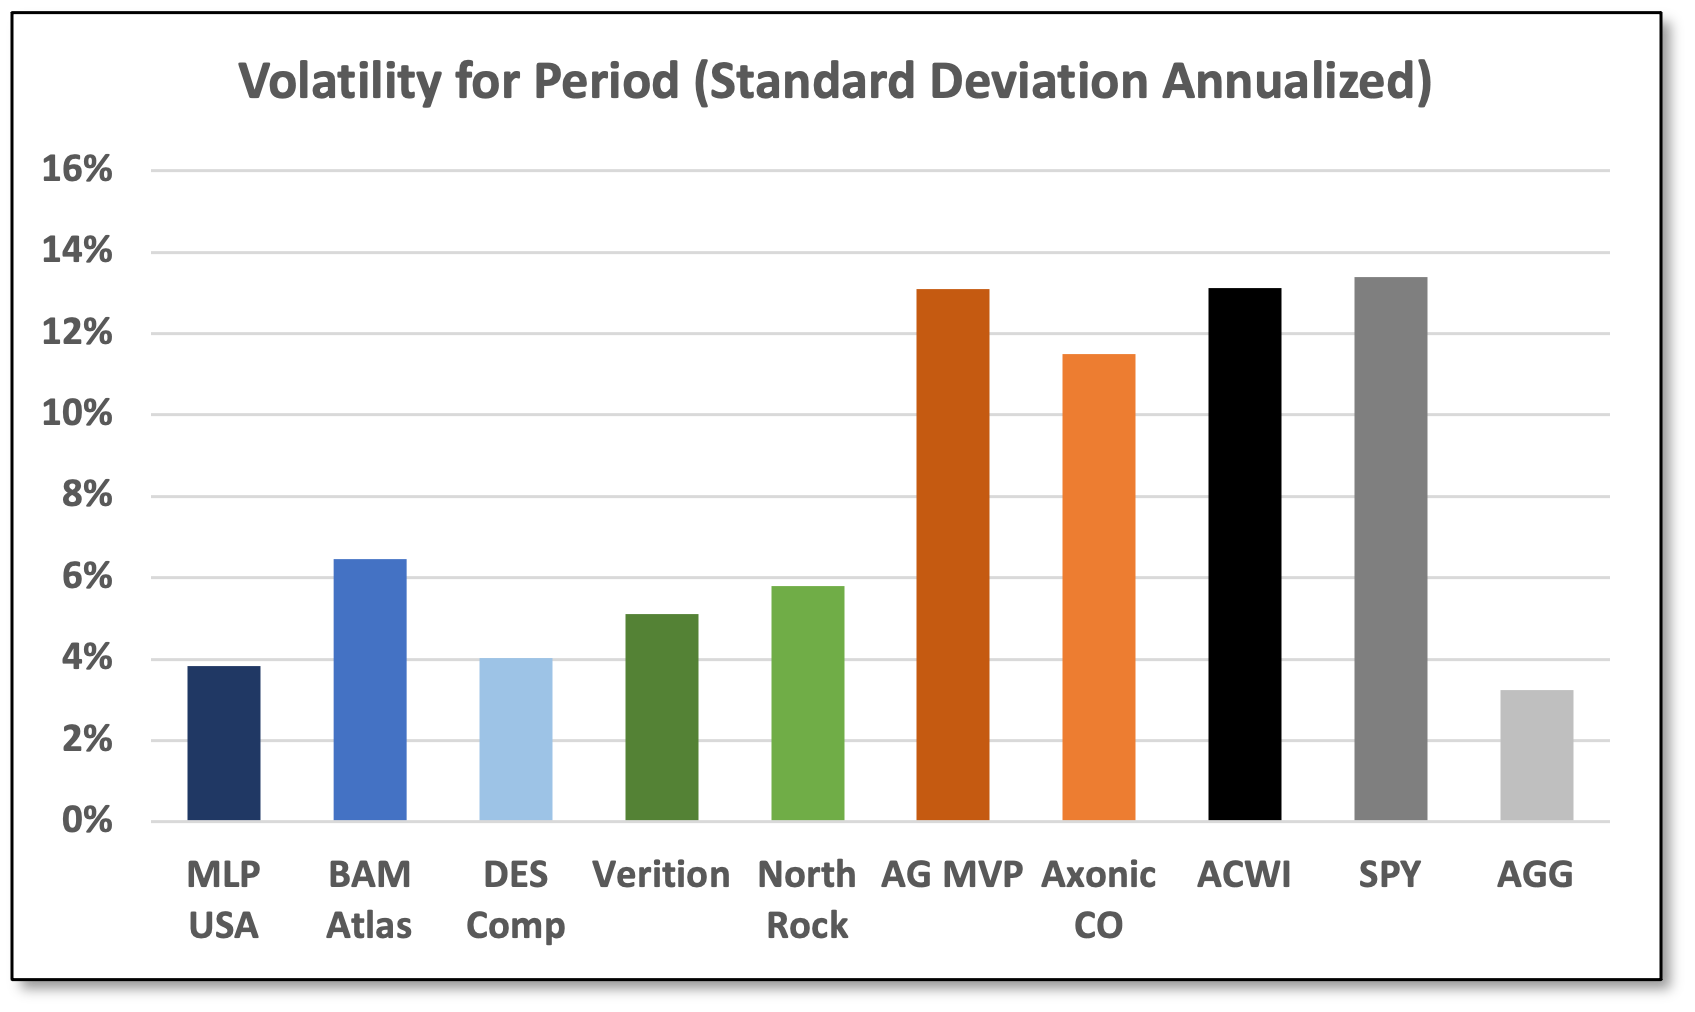
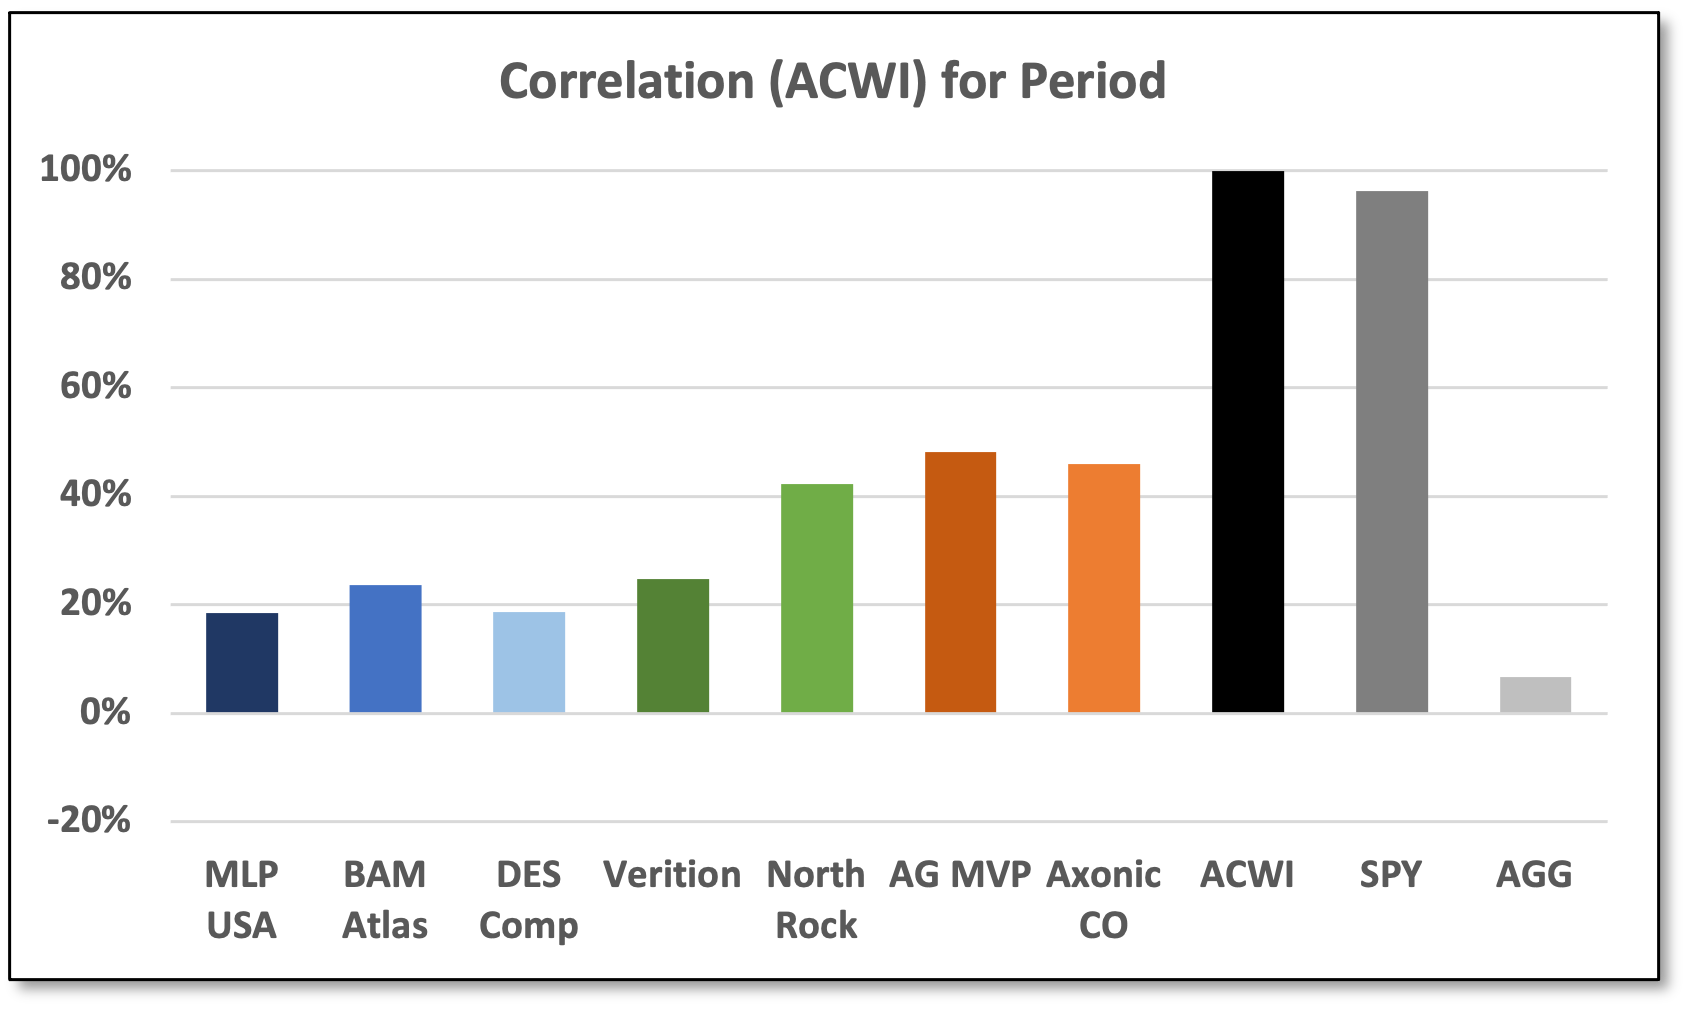


Rolling-period analysis including “80” 24-month periods: What are we showing? The first chart shows the 24-month rolling-period data in a line graph over time. The subsequent charts show the distribution of those “80” periods: The median illustrates the most common annualized return (volatility and correlation) over the 80 periods. The distribution also shows the 25th percentile and 75th percentile along with the highest and lowest reading over any 24-month period.
For instance, using Millennium as an example, the second chart below illustrates the following:
Median return was 9.1% (net annualized) over a 24-month horizon across the 80 periods; half the periods had a return > 9.1% and half the periods had a return < 9.1%.
For the 25th percentile, one-quarter of the periods had a return < 7.1%, and conversely, 75% of the periods had a return > 7.1%.
For the 75th percentile, one-quarter of the periods had a return > 12.6%, while 75% of the periods had a return < 12.6%.
The high and low returns (over any 24-month period) were 18.9% and 5.3%, respectively.
To emphasize, the lowest annualized return for Millennium over any 24-month period was 5.3% over the dates analyzed.
Moreover, the best 24-month period for Millennium is the most recent 24 months ending 9/30/21.
Granted, the rolling-period distribution charts require some effort to grasp what is being presented, but we believe the data is useful. Tight distributions illustrate greater consistency. Wide distributions depict greater dispersion. Median data reveals the “most common” experience and the range between the 25th percentile and the 75th percentile captures half the outcomes. Note: We will explore all this further in a separate posting that takes a methodical look into all these analysis features.
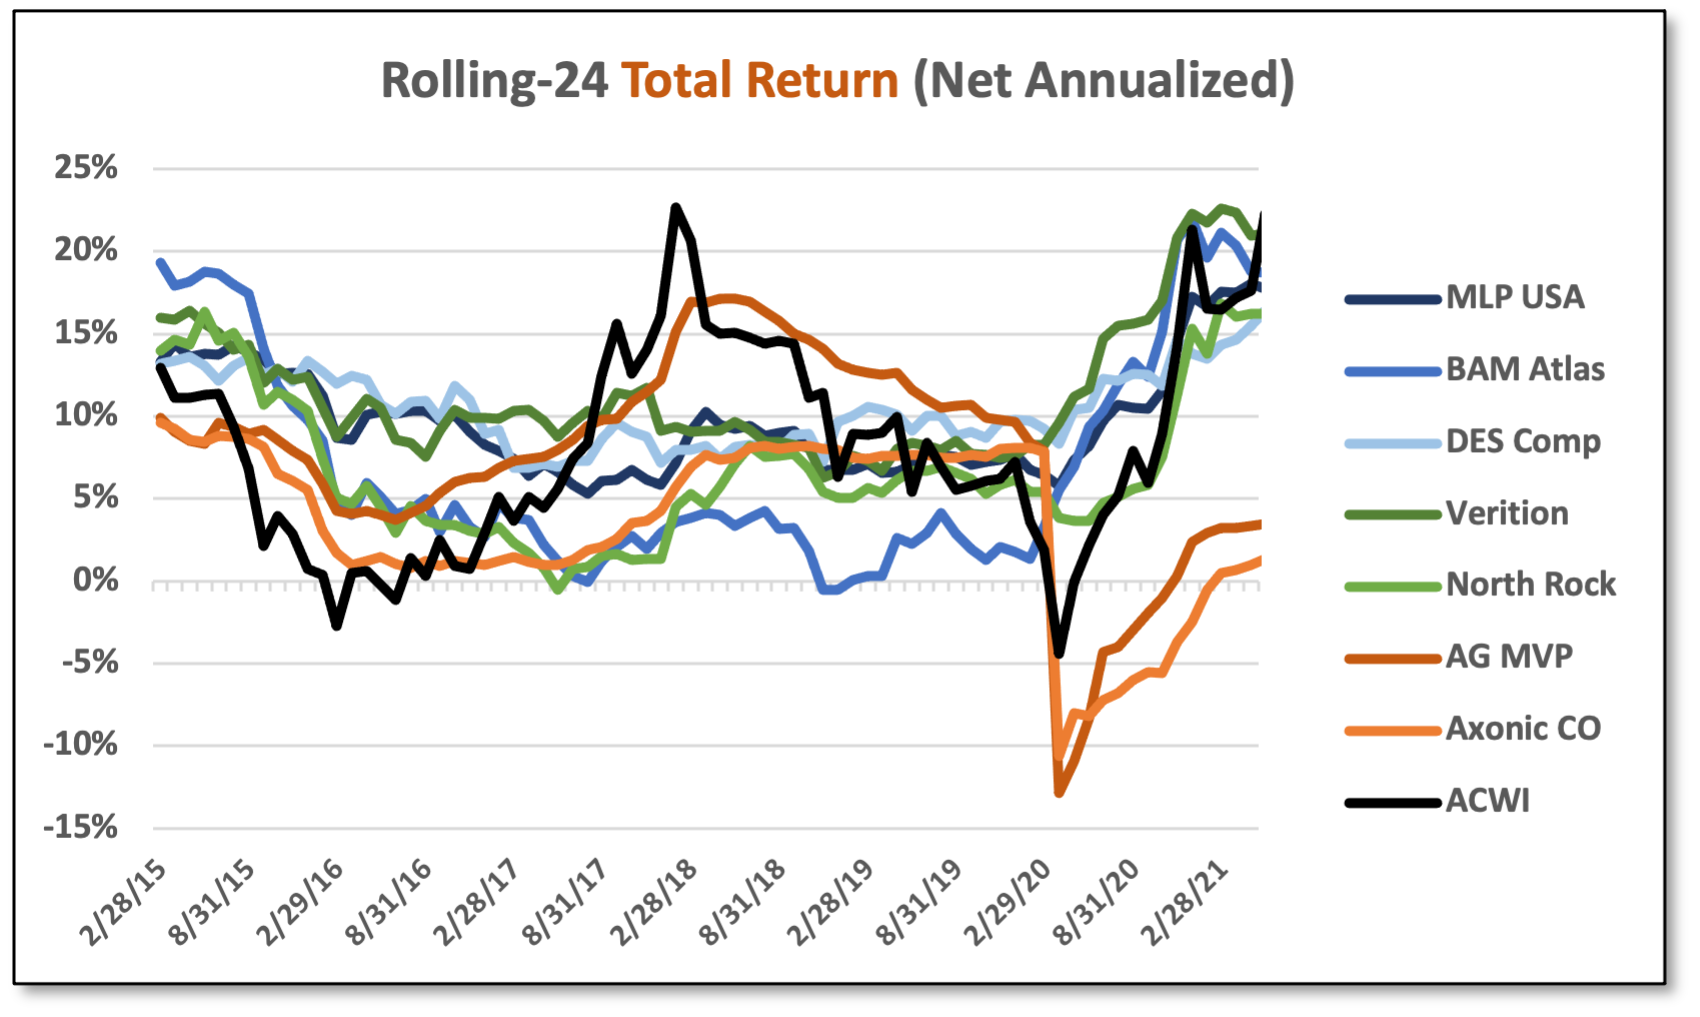


To reiterate, rolling-period analysis helps to illustrate performance consistency over time along with trends and relationships. It reduces end-point sensitivity, which can skew outcomes and perceptions. Reasons we favor rolling 24-month periods:
We view 24 months as a minimum holding period for evaluating fund manager performance. Based on our experience, periods less than 24 months often entail too much noise and too few data points. In short, highly-active fund managers need sufficient time to operate and demonstrate skill.
For instance, a 12-month period including March 2020 could be dominated by the COVID collapse, showing inordinate downside without necessarily capturing the full recovery. Similarly, a one-year period commencing just after the 2020 COVID episode, might show inordinate upside performance. In reality, the downside and upside are linked and should be judged in conjunction to gain proper perspective.
Thus, an extended 24-month period will capture a wider set of data points, smoothing the performance profile to an extent. However, as we hopefully illustrated above, it is the stacking of rolling periods over time — along with analysis of the outcome distribution — that illustrates performance behavior. We find such analysis helpful in forming realistic risk/return expectations, especially on a relative basis. In other words, we aim to answer the following question: “How might this fund perform over time?”
At the same, 36 months or more might have too large of a smoothing effect and span too many data points. Moreover, active managers should be able to demonstrate a degree of consistent value contribution over 24-month periods; this should be ample time to capitalize on opportunities or navigate obstacles and adapt to a challenging environment.
Adjusting the microscope to see things clearly. Finally, we understand that 24 months might sound arbitrary to some, but it’s based on our real-life experience as an institutional allocator specializing in alternative strategies.
If we analyze too closely, the picture includes extraneous data, but if we zoom-out too far, we miss important details.
Essentially, the time periods referenced above are a matter of fine-tuning the analytical lens. If we analyze too closely, the picture includes extraneous data, but if we zoom-out too far, we miss important details. Investors should find the research and analytical approach that best fits their investment philosophy.
CCM Note: We are making no recommendations regarding the fund managers referenced above. We are simply sharing data and sharing analysis ideas for evaluating performance consistency (RPCA).
What Others Are Saying
James Jude, Trader, @jimmyjude13 on Twitter, 11/26/21: “New COVID variant ‘tape bombs’ are going to be like the terrorist attacks that hit the market after 9-11, each one will have less effect until we are ignoring them altogether, enjoy this one.”
Aneta Markowska, Jefferies, 11/29/21: “The JEF US Economic Activity Index rose by 5.3 pts last week to 106.2, which marks a new post-pandemic high. While the index tells us nothing about the risks associated with Omicron, it does show that the economy is confronting this new challenge from a position of strength... Our index suggests further upside for November data… Strong labor demand, indications of improving supply and much more favorable seasonals all create upside in our view.”
Bespoke, Morning Lineup, 11/29/21: “As far as economic feedback effects go, we see a major shift in US activity unlikely even under relatively adverse assumptions for Omicron’s impact on vaccinated populations. Unless the variant is significantly more deadly (and to reiterate, there is no evidence thus far that is the case), aggregate US non-pharmaceutical intervention (ranging from mask mandates to stay-at-home orders) will have at worst incremental impacts on total activity levels. While some states and local areas will undoubtedly ramp up response, there just isn’t an appetite for widespread restrictions regardless of the public health implications at this stage... A similar logic can be applied to aggregate consumer spending or movement statistics; nationally, the vast majority of the population has decided to move on from the pandemic. For other countries, the analysis is quite different, with much larger (but smaller than prior global case spikes) impacts a reasonable forecast.”
Christopher Wood, Jefferies, 12/2/21: “Shoot first and ask questions later. This is the perhaps understandable and certainly predictable response of governments to the emergence of the, by all accounts, highly infectious Omicron COVID variant... if it does turn out to be the case that Omicron is far more infectious than it is lethal, then it will be following the path of most pathogens of getting less lethal over time. Also, the more people who get infected with the hopefully milder version, the greater the resulting immunity amongst the population at large... If this is the positive way of looking at the latest turn in the now nearly two-year-long pandemic, it remains the case that the world remains way short of the 90% vaccination rate globally which is probably what is required to defeat the virus once and for all and, in the meantime, these vaccines will need to continue to be tweaked for the new variants... Still, it is also the case that vaccines are not quite the panacea they were originally made out to be... more people have died in America of COVID this year than was the case last year, based on the official data... This, in turn, raises the vexed issue of whether COVID has been the chief cause of death or rather an enabling agent where there have been other medical issues. The fact that vaccines are not a total panacea also is a reminder of the importance of coming up with treatments for COVID, which Pfizer has now hopefully done... Returning to the markets, the COVID-triggered risk-off move last Friday was clearly exacerbated by the US Thanksgiving holiday and the desire to square trading books prior to the approaching year-end. Still, it also had the effect of further delaying another inflation scare with the five-year/five-year forward inflation expectation rate declining again...”
Merrill Lynch, Chief Investment Office (CIO), 11/29/21: “In our view, 2022 will be dominated by major shifts in the investment terrain. Despite emergence of new virus variant, the pandemic is expected to fade over the balance of 2022; the Federal Reserve (Fed) will tighten; bottlenecks are expected to unwind; and Republicans could take control of Congress. Against this backdrop, we continue to like cyclical sectors such as Energy and Financial, as well as inflation hedges like Real Estate and Tangible/Real Assets... Equity markets were under significant pressure last Friday as concerns grow over a new coronavirus variant emerging in South Africa. Investor risk aversion has increased considerably... Recently, with markets at or close to all-time highs in the US... the broad markets were likely ripe for a pull-back if a new concern developed. The new variant is something the markets were not factoring into their scenario analysis in the short term... Although new variants are always a concern, we view this latest weakness as more of an exhale of the latest investor enthusiasm over the easing of supply chain disruptions, strong job growth, and a Fed determined to approach monetary policy with a transparent and balanced approach. We expect the dominant story to remain strong corporate fundamentals, a healthy consumer, and a broader economic backdrop that continues to learn to advance in the face of the coronavirus evolution... We remain Equity overweight relative to Fixed Income and still prefer the US relative to the rest of the world. Weakness regarding new concerns that are not likely to alter the ‘growth curve’ in a material way are buying opportunities from our perspective. This latest pressure provides investors more attractive prices in the higher-quality areas building and expanding the already strong free cash flows heading into next year.” CCM Note: For December, Merrill announced it is reducing its overweight to large-cap US equities in favor of US small/mid-cap “with a preference for value.” On the margin, Merrill rotated S&P sector exposures from Communications Services to the Real Estate sector. Within fixed income, Merrill is underweight duration with a focus on shorter maturities.
Kawa Fund, 12/2/21: “Investing in the second half of 2021 has proven to be quite challenging, and we remain particularly cautious of the trading environment we see ahead. With inflation showing real signs of accelerating, we believe investors are not appropriately pricing the risk of a severe dislocation in the interest rate market. Asset prices continue to hit all-time highs, and we remain conservatively positioned, with over half the Fund in cash or liquidity-like investments and a small trading position bearishly positioned in US equity markets... If a year ago someone told us that inflation in the US would be printing at over 5% per annum, yet 30-year treasuries were under 2% yield-to-maturity, we would emphatically say that such combination is impossible. Yet, that is what we’re seeing, and it may present a once-in-a-generation chance to take advantage of such levels. We always tell investors that trying to predict the catalyst for a selloff is a fools’ errand. But if we were to venture in such endeavor, our guess would be that the traditional correlation between government bonds and equities is bound to break down, generating havoc in many asset allocation models. Our belief is that we will see both lower equity prices and bond prices over the coming year... Looking forward, we have no other way to explain our concerns over market frothiness than our positioning: short equity futures, high cash balances, and negative duration. These are challenging times. We try not to be fooled by the perceived normalcy that ever-rising prices portend. The foundations of this rally are weak, and in our opinion, even the credibility of governments and central banks will be questioned if inflation continues to run high. That is not to say that there are no opportunities to make money. There are, but caution needs to be a consistent reminder every hour of every day.” CCM Note: Kawa Fund is a relative value credit and macro specialist targeting cash-flow generation and asymmetrical option-like payoffs. Kawa Fund gained 0.5% in November and is up 17.4% YTD.
It’s the Holiday Season. Consider giving a Coffee & Capital Markets gift subscription to:
Clients
Colleagues and team members
Students or young up-and-comers who thrive on learning
Seasoned investors looking to keep an edge
Family members who follow the markets
This material is for informational and educational purposes only. All data has been compiled from sources believed to be reliable, but there is no guarantee of its complete accuracy.
Jobless claims are tracked as a key real-time indicator for employment and consumption trends, and ultimately serve as a gauge for GDP growth and corporate profits.