


Weekly Briefing: 11/28/21
Never underestimate the short-term influence of non-fundamental/technical factors on asset prices...


Performance & Other Observations
It’s hard to make complete sense of volatile short-term price moves. On Friday, global risk assets declined and safe-haven assets gained. Purportedly, the sell-off was due to travel restrictions imposed by Europe, the UK, and Japan in response to an emerging COVID variant concentrated in South Africa. Beyond that, the sell-off was probably a matter of negative headlines colliding with stretched positions and weak liquidity conditions.
The S&P 500 (SPY) declined -2.2% on Friday and -2.1% for the week, giving up all its November gains. For the month, SPY is down -0.1%. For further context, however, SPY is up 7.0% for Q4 due to a better-than-expected corporate earnings season and improving economic activity. For 2021, SPY is up 24.0% driven by the ongoing profits recovery.
The bond market response seemed to conclude a downshift in growth is imminent with a commensurate slowdown to inflation, and thus, less need for a tighter monetary policy sooner. That’s a lot to conclude from a few travel restrictions.
USTs rallied on Friday across all maturities, reversing pre-holiday losses. Early in the week, bonds were selling off with rates moving aggressively higher as markets braced for a more rapid shift to a tighter Fed Policy. All that changed on Friday with the COVID headlines. The bond market response seemed to conclude a downshift in growth is imminent with a commensurate slowdown to inflation, and thus, less need for a tighter monetary policy sooner. That’s a lot to conclude from a few travel restrictions and we suspect the “slowdown trade” is offsides. Long-duration bonds gained the most on Friday with UST 20+ Year (TLT) up 2.5%; TLT gained 1.5% for the week. US Aggregate Bond (AGG) added 0.7% on Friday to finish up 0.1% for the week.

In reality, Friday’s sell-off probably tells us very little about the evolving economic and corporate fundamentals. Abrupt market declines rarely provide precise information on fundamentals. Instead, sharp sell-offs normally point to weak liquidity conditions and/or one-sided trading dynamics (i.e., more sellers than buyers). Sell-offs often result from over-extended prices or sentiment extremes; maybe equity prices moved too high, too fast and Friday’s headlines were a just convenient sell-off catalyst. Sometimes sell-offs are a matter of portfolio repositioning or risk rebalancing — and declines can be exaggerated when portfolio managers are using stop-loss orders to scale down their equity exposure. We are theorizing here, but quite possibly, Friday displayed all the above to varying degrees.
As a reminder, technical factors amplify short-term price moves on a regular basis. It’s just part of the way markets operate. For instance, with heavy call option purchases in recent weeks, equity option markets were “short gamma” meaning options dealers were forced into buying (cash) equities as prices moved higher in order to hedge the call options they sold to option buyers. (Effectively, dealers were short the equities from selling the calls.) Under short-gamma conditions, this “delta hedging” process works in both directions, so dealers needed to sell equities as prices moved lower to unwind their position hedges. It’s all a matter of risk management as option dealers are not in the business of taking directional risk. Moreover, when equity prices are falling rapidly, delta hedging can add to downside price momentum at an alarmingly fast rate. It’s not clear to what extent such hedging impacted Friday’s declines, but it was probably a factor.
When equity prices are falling rapidly, delta hedging can add to downside price momentum at an alarmingly fast rate.
In the midst of volatility events — the fog of war so to speak — it’s difficult to quantify the exact impact of non-fundamental/technical factors without sitting on a large trading desk, but we can be sure those factors are lurking behind the scenes driving prices. Eventually, reports emerge with the details. All this relates to market structure, trading dynamics, and liquidity conditions. “Never underestimate the short-term influence of non-fundamental/technical factors on asset prices,” as we like to say. With that in mind, the influence of such factors eventually subsides, selling pressure gets exhausted, and then fundamentals reassert themselves, but this process requires time and data points.
To clarify, prices moving lower on Friday was definitely a rational move based on the negative COVID headlines, so the market got the directional move right (lower), but to draw fundamental conclusions based on the magnitude of the decline is probably premature (since non-fundamental factors no doubt played a role). Again, time and data points will help to sort things out regarding the COVID threat and any potential impact on growth fundamentals from policy actions…
Assess potential downside, but also to keep perspective. Over the weekend, we observed various research reports outlining potential worst-case scenarios having to do with new COVID variants, but most strike us as speculative, possibly alarmist, and low-probability outcomes. Conceivably, a new round of lockdowns could diminish services activity and reduce or delay consumption and GDP growth. At the same time, the effort by central banks to remove monetary support would probably be put on hold if a slowdown emerged, perhaps offsetting the negative effects. Obviously, if a more serious virus emerges, all bets are off, but so far, the US economy has effectively navigated every COVID variant.
"The sensitivity of activity to COVID restrictions has fallen with each COVID wave… the previous waves suggest that economic activity is likely to bounce back rapidly once the containment measures are lifted, pointing to limited medium-term effects on economic activity." Goldman Sachs, 11/26/21
Goldman Sachs bluntly assessed the diminishing effect from COVID policies as economies adapt, especially in the US. According to The Market Ear, GS offered this on 11/26: "The sensitivity of activity to COVID restrictions has fallen with each COVID wave. In particular, we see that the effect of changes in restrictions (measured with the Oxford University COVID containment index) on GDP has diminished significantly over time. The declining sensitivity likely reflects a number of factors, including changes in consumer and firm behaviour (such as online shopping and working from home), falling adherence to containment measures and smaller confidence effects, given more manageable downside to activity. Moreover, the previous waves suggest that economic activity is likely to bounce back rapidly once the containment measures are lifted, pointing to limited medium-term effects on economic activity."
Meanwhile, most economic growth metrics remain up-trending even where many “known” challenges exist. In fact, despite rising COVID cases across Europe since early October, flash PMI data for the Eurozone showed improvement in November and an overall healthy economic expansion. Moreover, the recent corporate earnings season was quite positive — S&P 500 EPS were up ~40% year/year with both Europe and Japan showing similar results — revealing management teams’ ability to navigate higher commodity input prices, labor shortages and rising wages, and the proverbial supply-chain disruptions. Consumption demand is strong and most businesses are raising prices (or finding other ways to cut costs) in order to protect profit margins. From the beginning of the Q3 corporate earnings season and heading into Friday, the S&P 500 (SPY) was up 8.3%.


Finally, we hesitate to blame Friday’s losses on “low-trading volume” because the level of SPY shares traded were actually higher compared to recent weeks, but that doesn’t mean liquidity conditions were favorable. Of course, trade volumes tend to spike during sell-offs. In fact, SPY volume on Friday was reached the highest level since early October when volatility last spiked and equites were down on stagflation fears. That also marked the largest drawdown of the year for the S&P 500.
Nonetheless, trade activity on Friday presumably was one-sided with more sellers than buyers.
Things could change on Monday — at least liquidity conditions might improve — assuming trading desks are more fully staffed and ready to analyze/digest new market data.
Relative Value Spotlight
Is it time for a tactical rebalancing? On Friday, high-quality fixed income delivered “crisis alpha” and showed negative correlation to declining equities. To the extent bonds were serving in the portfolio role as a defensive diversifier, investors might consider tapping bonds as a “dry powder” funding source in order to deploy opportunistic capital wherever value opportunities are identified.

After outperforming for November heading into the holiday, equities’ outperformance was vaporized on Friday. Currently, US Aggregate Bond (AGG) is up 0.1% MTD, while S&P 500 (SPY) is down -0.1%. Before Thanksgiving, the relative performance gap for November was favoring the SPY by ~300 basis points.
As always, we are not necessarily making any recommendations, only offering data for consideration. Strategies for tactical (short-term) rebalancing vary with each investor/allocator depending on needs/objectives, time horizons, investment philosophies, transaction costs, tax situations, and other considerations.
We aim to deliver timely and relevant data/insights. To ensure continued full access to Coffee & Capital Markets, please consider joining our community as a paid subscriber.
Economic Data & Trends
As noted above, the announced travel restrictions on Friday threw markets into a tail spin. Presumably, the price action signals an imminent growth slowdown, but this is premature speculation. No doubt, asset prices were influenced by technical factors and it is too early to accurately judge any change in economic growth fundamentals.
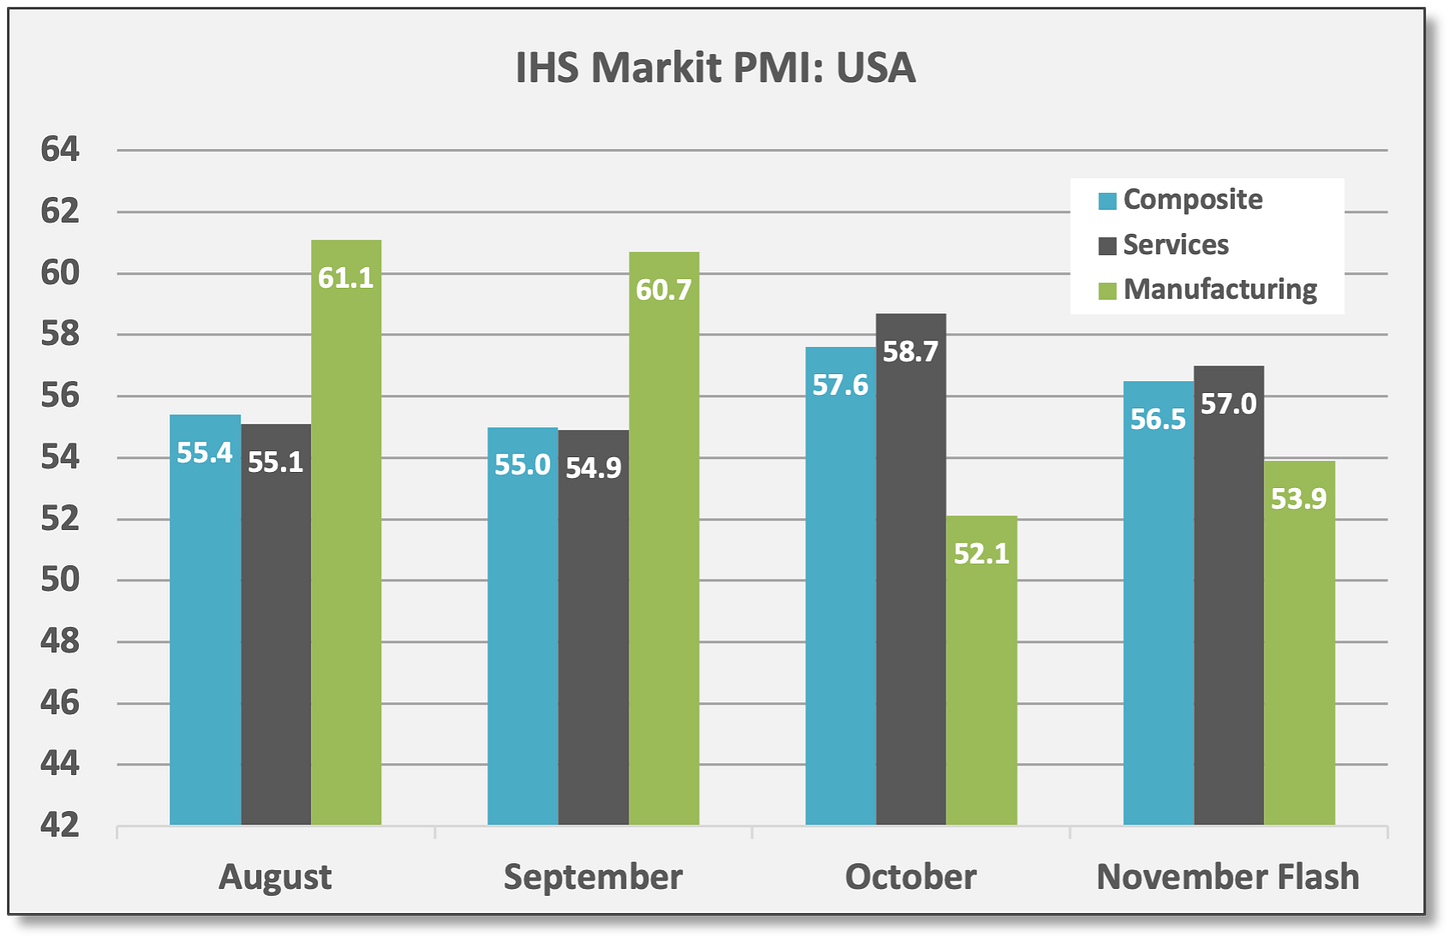
Flash PMIs from IHS Markit give an early look into current month activity. Reports for November show a solid global GDP expansion with readings well above 50. Overall, activity shows strong demand despite rising prices.
US Flash Composite PMI slowed to 56.5 in November versus 57.6 in October, but readings > 50 still show expansion. Manufacturing improved to 53.9, but Services slowed to 57.0. IHS Markit: “US private sector firms signaled a sharp upturn in business activity during November, despite the rate of expansion slowing from October. Softer overall growth was largely led by the service sector, as manufacturers posted a slightly stronger increase in production… Sharper increases in cost burdens at both manufacturers and service providers led to soaring prices, with a vast range of materials reported as having risen in cost. The pace of selling price inflation matched October’s series record high, as firms sought to pass on greater costs to their customers.”
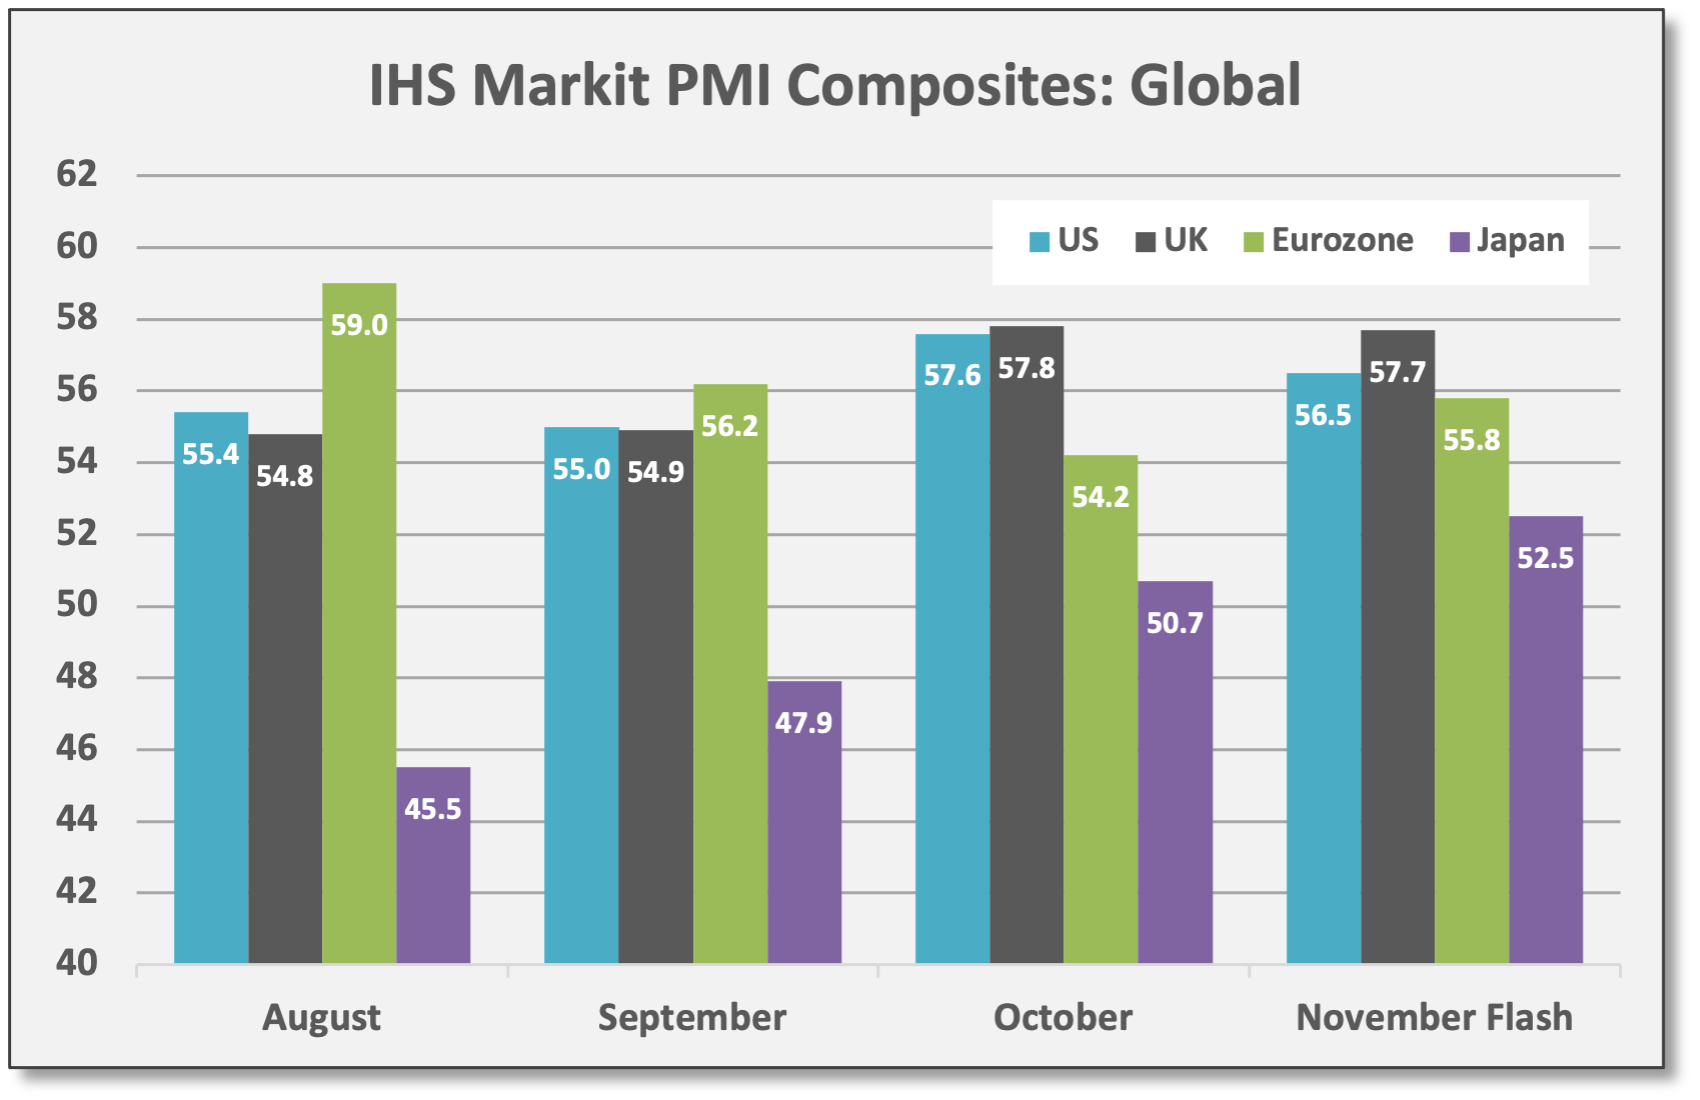
Sources: CCM, IHS Markit UK Flash Composite PMI inched lower to 57.7 in November versus 57.8 in October. Manufacturing improved to 52.9, but Services slowed to 58.6. IHS Markit: “UK private sector firms experienced another month of rapid input cost inflation…The latest increase in average cost burdens was the fastest since this index began in January 1998, driven by higher wages and a spike in prices paid for fuel, energy and raw materials. Customer demand continued to rise sharply in November, despite the pass through of higher costs to clients, with the overall rate of new order growth accelerating to a five-month high.”
Eurozone Flash Composite PMI improved to 55.8 in November versus 54.2 in October. Despite rising COVID cases and possibly more lockdowns, EZ Manufacturing improved to 53.8 and Services gained to 56.6. IHS Markit: “The upturn was accompanied by a further marked increase in inflationary pressures during the month, as firms’ costs and average selling prices charged for goods and services both rose at record rates.”
Japan Flash Composite PMI moved higher to 52.5 in November — the best output pace since October 2018 — versus 50.7 in October. Manufacturing jumped to 53.5 and Services gained to 52.1.

Sources: CCM, IHS Markit

Robust economic growth forecasted for Q4 and 2022. As it stands, the Atlanta Fed GDPNow model is projecting Q4 GDP growth of 8.6%… According to Cornerstone Macro, foot traffic in November at general merchandise stores is near record levels and points to “strong real holiday sales” at superstores, discount stores, department stores, and electronic stores. By “real” sales, CM is saying sales will show strong volume gains and not just larger dollar values due to rising prices (inflation)... Jefferies raised its forecast for Q4 GDP growth to 9% and sees 2022 growth at 5%.
Meanwhile, Q3 GDP was revised up slightly to 2.1% (from 2.0%), durable goods consumption (mostly autos) was larger than originally reported; the same trend was evident in October retail sales as spending for Aug/Sep was revised up. Q3 growth was the weakest of the post-COVID recovery period and it’s in the rearview mirror, but still, GDP last quarter was better than feared.

Monetary/Fiscal Policy
As noted above, the announced COVID-related travel restrictions on Friday derailed policy expectations. Presumably, the price action signals an imminent growth slowdown — and a pause in monetary tightening — but this could be premature speculation.
Jerome Powell reappointed as Fed Chair. Powell’s tenure as leader of the FOMC will extend another four years. Lael Brainard was appointed to Vice Chair. Thus, the Fed is expected to operate with the same philosophy going forward. With Brainard, Powell reportedly has a closely aligned ally. As an aside, Brainard is viewed to be more progressive in her approach. For instance, she might favor “green finance” policies — an approach where the Fed uses its influence to restrict, penalize, or otherwise discourage lending to carbon-based energy producers. This would expand the Fed’s mandate to support stable prices and full employment. There is no indication Powell will move in that direction now, but it’s something to monitor over time as Brainard gains influence. CCM Note: Credit spreads suggest the marketplace has already imposed a higher cost of debt capital on carbon-based energy producers.
No surprises from the FOMC minutes. Minutes from the 11/3 FOMC meeting were released, but there were no surprises. Members admitted inflation pressures “could take longer to subside” compared to original expectations. Essentially, this lays the groundwork for accelerating the tapering process. To reiterate, the proposed plan which commenced in November entailed $15 billion in reduced asset purchases, but a doubling of that pace — $20 billion less in UST purchases and $10 billion less of MBS purchases for a total of $30 billion — would bring quantitative easing to a completion in March 2022 instead of June 2022.
Accelerated tapering is probably the de facto base case, despite Friday’s events. If anything, fiscal stimulus and lockdowns exacerbated inflation, so a return to such policies seems remote. Moreover, the Fed finally seems more willing to address the emerging inflation issue. Markets were accepting this, and even seemed to be embracing the shift, before last Friday’s events.
Assuming asset purchases end by March 2022, this would give the Fed several months to telegraph the first rate hike, whether it be June or September.
Despite last Friday’s plunge in rates, Fed Funds futures are still predicting the first rate hike comes in June 2022. Overall, FF futures are pricing a 75% probability of at least two hikes in 2022.

Obviously, the pace of tapering and the timing of rate hikes could change if a serious growth slowdown ensues, but assuming that outcome seems premature.
Fixed Income, Rates & Credit
High-quality bonds rallied on Friday, delivering “crisis alpha” and showing negative correlation to equities, but this was a major reversal from earlier in the week. In pre-holiday trading, rates were trending higher with the yield on the UST 10-year reaching 1.64% on Wednesday before Thanksgiving, but yields plunged on Friday and the UST 10-year closed the week at 1.48%.
The “rates moving higher” theme reversed sharply amid the Friday COVID headlines, but it tells us where bond investors’ minds were and where rates might go if/when the COVID fears subside.
Why were rates trending up in the first place? Presumably, markets were pulling forward the Fed’s planned policy shift (i.e., a more aggressive tapering pace and an earlier start to rate hikes). Again, the “rates moving higher” theme reversed sharply amid the Friday COVID headlines, but it tells us where bond investors’ minds were and where rates might go if/when the COVID fears subside.
UST 20+ Year (TLT) rallied 2.5% on Friday to finish the week with a gain of 1.5%. US Aggregate Bond (AGG) added 0.7% on Friday and finished the week with a gain of 0.1%.
Growth-oriented spread strategies declined last week, including high-yield corporate bonds/loans and Emerging Markets debt.

Sources: CCM, Koyfin 
Sources: CCM, Koyfin 
Sources: CCM, Koyfin


US/Global Equities
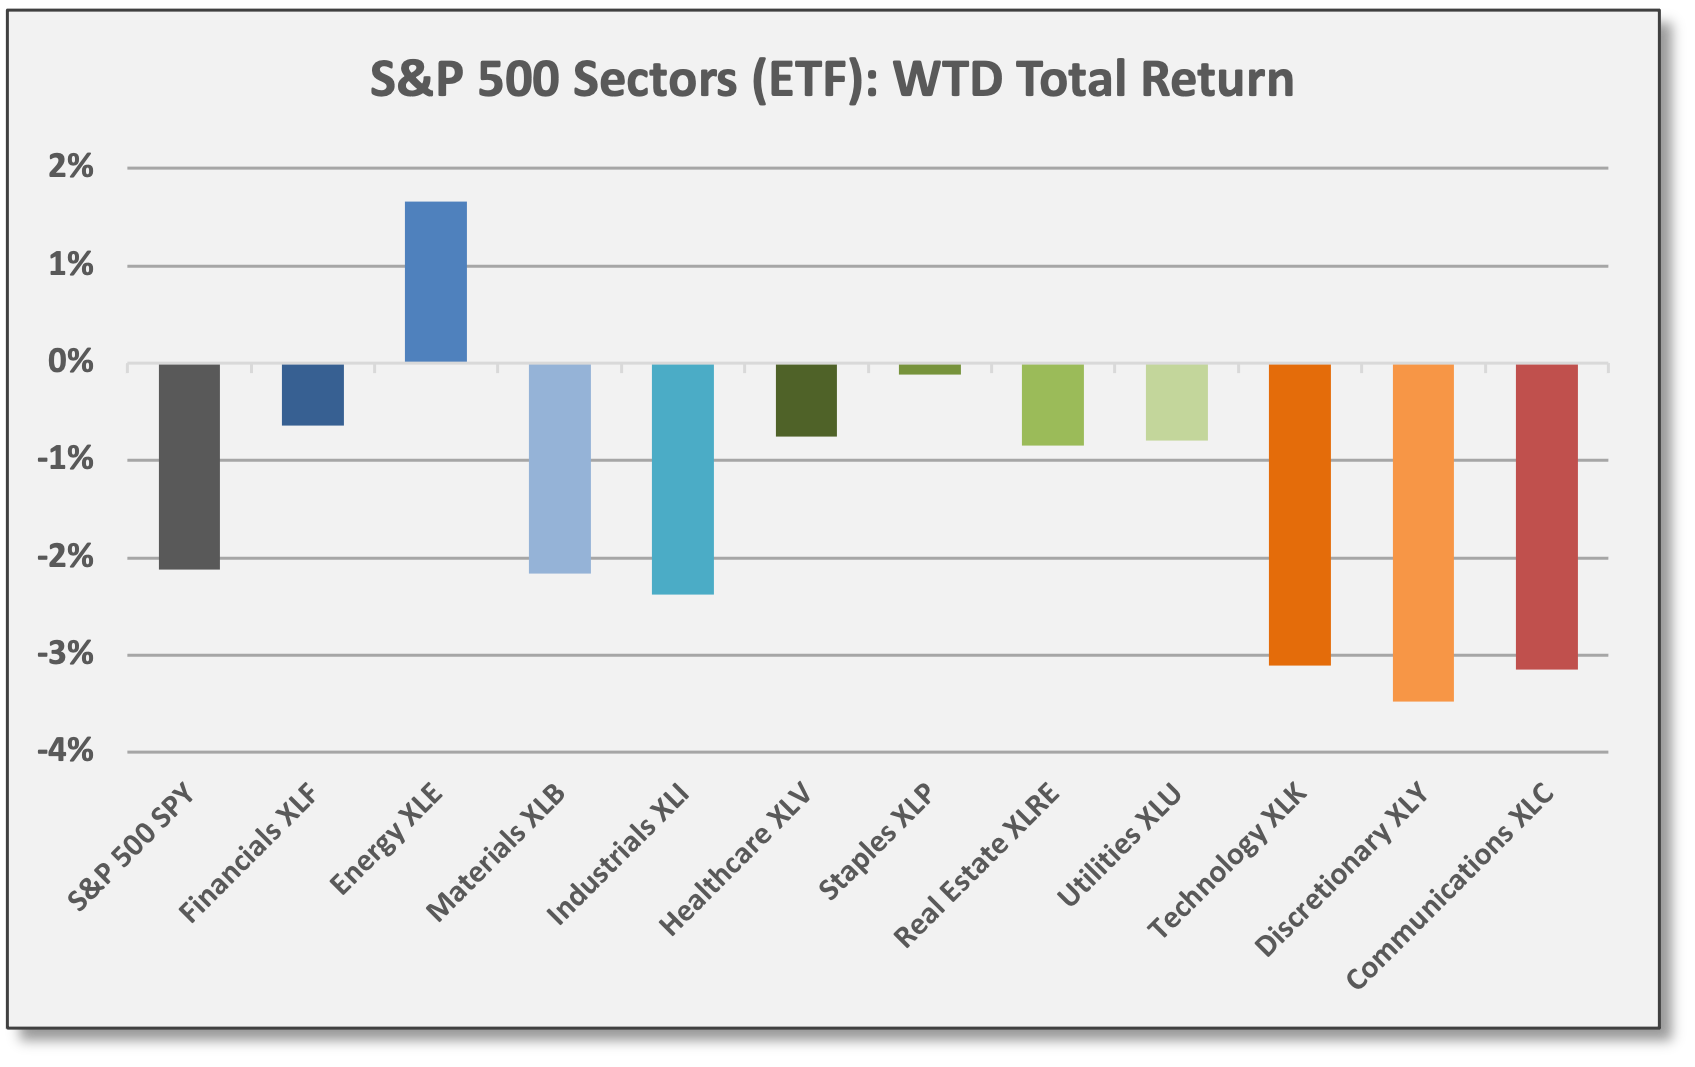
Cyclical/value equities underperformed on Friday amid fears of a COVID-driven slowdown, but secular/growth underperformed for the week. Ironically, Energy was pushing higher pre-holiday and still finished up for the week. XLE was the only S&P sector to post a gain last week. Energy equities (and commodities) rallied after the Biden Administration announced an SPR release of 50 million barrels.
Meanwhile, secular growth equities showed muted losses on Friday, but were already underperforming early in the week due to (1) a few sub-par earnings reports from digital communications companies and (2) the aggressive march higher in interest rates (which negatively impacted high-valuation shares).
Energy (XLE) and Financials (XLF) declined -4.0% and -3.3% on Friday. Within the S&P 500, these two recovery sectors remain the top performers for 2021.
For the week, Consumer Discretionary (XLY), Communications (XLC), and Technology (XLK) declined -3.5%, -3.2%, and -3.1%, respectively. If an actual COVID induced slowdown emerges, work/stay-at-home shares will probably outperform cyclical/re-opening, but it is too early to reach conclusions.
Other market segments perceived as cyclical/value underperformed last week: Russell 2000 (IWM) declined -4.2%. Developed Markets (EFA) and Emerging Markets (EEM) were down -4.0% and -4.4%, respectively.

Sources: CCM, Koyfin 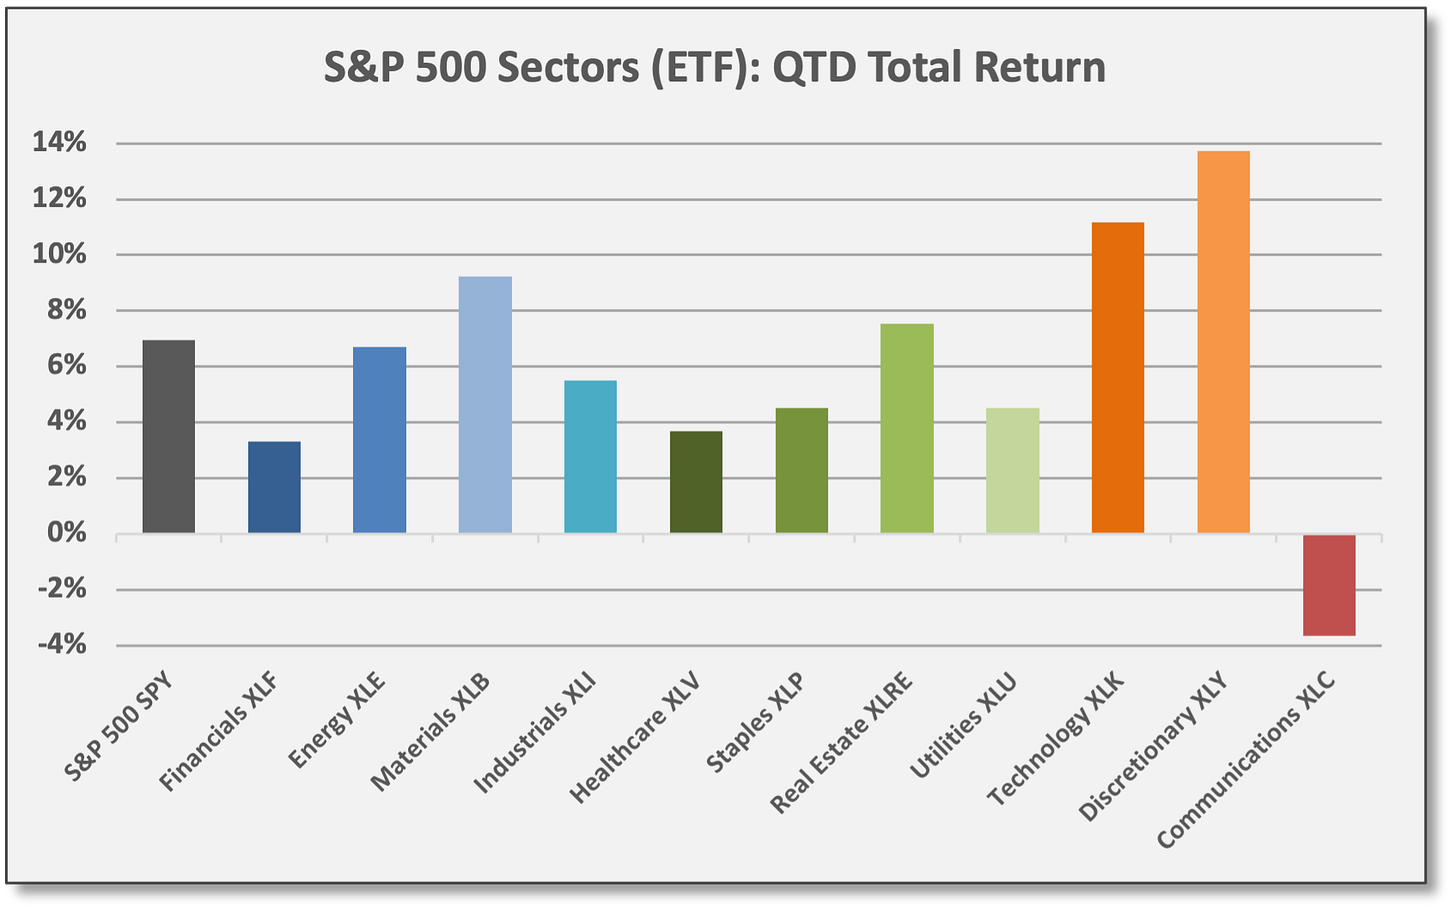
Sources: CCM, Koyfin 
Sources: CCM, Koyfin 
Sources: CCM, Koyfin


CCM Note: The following section, including the discussion on drawdowns, was planned before Friday’s sell-off.
Fundstrat’s Tom Lee is “constructive” on equities well beyond the near-term. Thomas J. Lee of Fundstrat Global Advisors discussed his outlook on The Money Show. Lee’s 30-minute video presentation from 11/18/21 can be viewed here.
“I think if we’re talking about negative rates… the S&P probably goes parabolic…” Tom Lee, Fundstrat Global Advisors, 11/18/21

Lee made several observations:
Lee views the current US market as being in the “mid-cycle” stage with upside EPS growth potential into 2022. He sees (1) pent-up consumer spending, (2) an ongoing inventory rebuild to keep pace with demand, and (3) increased capital spending from corporations to boost productivity.
Related to inflation, Lee notes that many companies are raising prices to offset higher commodity inputs. Meanwhile, cost of (debt) capital remains extremely low due to negative real rates. Thus, top-line sales are growing relative to capital costs and this is flowing to bottom-line profits. “I think if we’re talking about negative rates here, the S&P probably goes parabolic here,” Lee said while circling a period on a chart that covered the next 5-10 years. Lee does not see the US economy “overheating” any time soon based on the capacity utilization rate and the labor utilization rate, both of which remain below stressed levels. CCM Note: Aside from large retailers WMT and TGT, which held prices and took the hit to profit margins, many US companies were able to pass along price increases according to Q3 earnings reports.
Lee sees cyclical/value companies benefiting as interest rates continue to rise. This includes Energy and Financials.
Lee sees demographic trends supporting robust growth, especially via innovation and productivity growth from the Millennial generation in the years to come. In addition, Lee stressed the importance of paying attention to what the dominant generation favors. Hence, Lee views the broad crypto space — the intersection between digital assets and finance — as a potential growth industry. Lee mentioned bitcoin (BTC), but otherwise did not elaborate. CCM Note: In a separate appearance last week on CNBC, Lee predicted bitcoin would approach $100,000 by year-end. Currently, BTC trades at $53,758; bitcoin is experiencing a -22% drawdown since 11/9, but is still up 85% YTD.
Fundstrat’s favored themes/sectors: (1) Energy equities due to a structural shortage of capacity that needs to be addressed, (2) FAANG1 stocks, (3) Materials equities.
US blue-chip corporations are un-killable. An important observation from 2020 was the “un-killability” of US corporations, according to Lee. Referring to the COVID-related shutdown of the US economy, Lee said normally we would expect to see US companies going bankrupt, but instead, companies cut costs aggressively to protect profit margins and are effectively navigating other challenges (i.e., supply-chain disruptions, labor shortages, etc.). Lee said this shows US companies are “more resilient than people realize.”
Lee offered a contrast between investing and trading. He urged long-term growth-oriented long-term investors to manage equity portfolios for long-term gains, rather than managing to guard against drawdowns.
“People worry about losing capital, but that’s not how you invest… That’s what traders do, right? A trader has got to protect capital… Investors put capital to work to earn the best probability of a reward at a future date…” Tom Lee, Fundstrat Global Advisors, 11/18/21
“I think the mistake most people make is that if they think there’s a drawdown [coming], they liquidate their [equity] portfolio and go to cash… People worry about losing capital, but that’s not how you invest… That’s what traders do, right? A trader has got to protect capital… Investors put capital to work to earn the best probability of a reward at a future date — and that is literally the basis for investing and 2020 is a great example. I know so many people that said they were geniuses because they liquidated their accounts in April or May because the market was down 20%, but they avoided the next 10% loss, and they never bought, [never] got back in. And they still probably didn’t recover to the 2019 level.”
Simply put, drawdowns are an inherent part of publicly-traded equity markets.
In 2020, drawdowns were massive. Drawdowns for the S&P 500 (SPY) and Russell 2000 (IWM) were -34% and -42%, respectively. And yet, SPY gained 16% for the full year and IWM gained 18%.
For 2021, the largest drawdown for the S&P 500 (SPY) so far was -5.1% from early September to early October. For the Russell 2000 (IWM), the largest drawdown so far was -9.6% in March.

Sources: CCM, Koyfin, Strategas Research Partners 
Sources: CCM, Koyfin, Strategas Research Partners


Since 1988, the average intra-year drawdown for the S&P 500 is -14% and the median drawdown is -10%. For the Russell 2000, the average and median drawdowns are -18% and -14%, respectively.

Sources: CCM, Koyfin, Strategas Research Partners

Lee: “That is an example of why you should never manage your portfolio for a drawdown. I think you should manage it for long-term gains and that means buy the best things. So, my advice is, if you think there’s a drawdown, then you don’t put new capital to work. Do you liquidate your portfolio? I’ve never seen it work.”
Note: As an aside, we believe Lee’s comments are mostly directed and pertinent to long-term growth allocations. Within total portfolios, however, and depending on specific needs and investment objectives, we believe certain assets/strategies can be valuable as non-correlated diversifiers, producing alpha (positive risk-adjusted return) and protecting against equity market drawdowns. These include relative value, equity market neutral, and other low-beta skill-based equity/credit strategies.
Commodities & Real Assets
Crude prices plunged on Friday on negative COVID headlines, presumably on fears that potential lockdowns will squash growth. Basically, that’s the message from market-based pricing signals, but its’ a premature conclusion without more data.
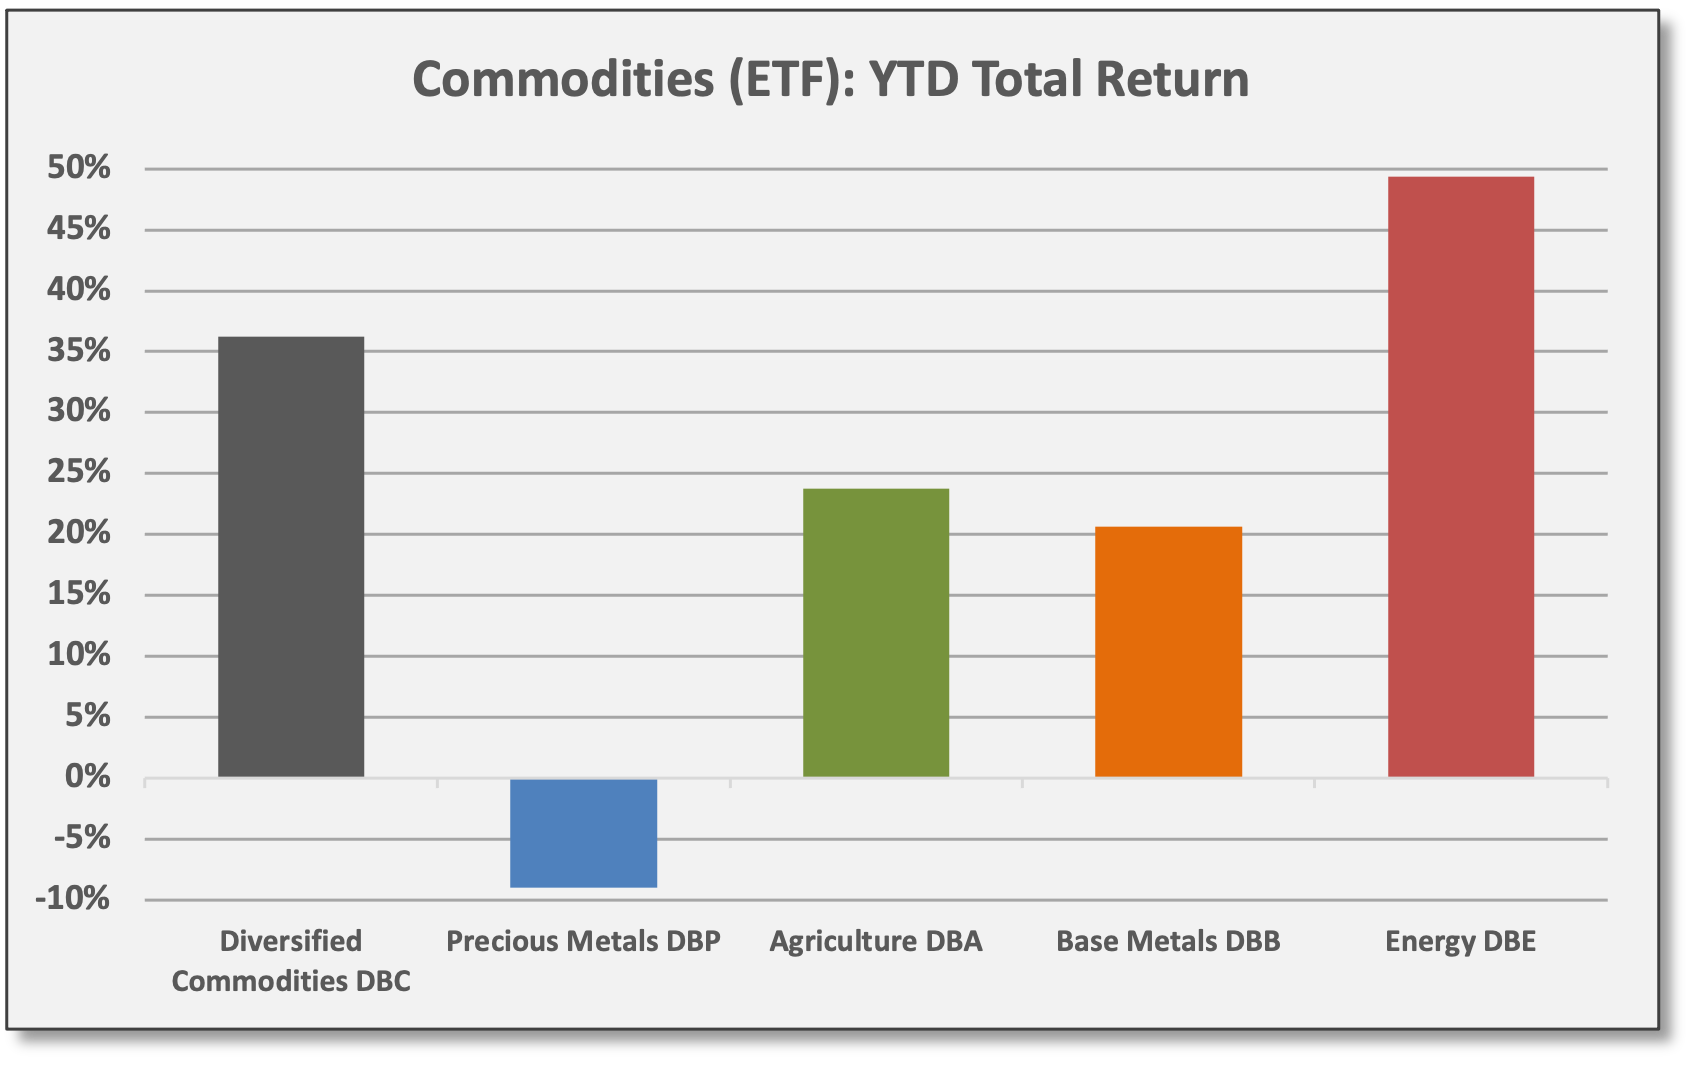
WTI Crude (USO) declined -11.1% on Friday. Ironically, oil prices were showing gains on the week leading into Friday, but USO finished down -7.7% for the week. USO is down -5.6% for Q4, but up 50.4% for 2021. Spot prices for WTI Crude futures were down -13% on Friday, closing at 68.15.
SPDR Gold (GLD) did not provide much protection on Friday but the decline was small at -0.2%. For the week, GLD was down -3.3%. GLD is up 1.6% for Q4 as inflation fears have ramped up, but GLD is down -6.5% for 2021.

Sources: CCM, Koyfin 
Sources: CCM, Koyfin 
Sources: CCM, Koyfin


The Biden Administration said last Tuesday it would release 50 million barrels of crude from the SPA (Strategic Petroleum Reserve). WTI Crude actually traded higher on the news, gaining 2.3% on Tuesday.
Energy specialists say the SPR move is fully reflected in crude prices and has no impact on the structural issues driving prices higher.
For context, global consumption of “petroleum and liquid fuels” is on pace to average 97.5 million barrels per day this year according to the Short-Term Energy Outlook for November 2021 from the EIA (US Energy Information Administration). The US averaged 18.2 million barrels per day in 2020 according to the EIA. Hence, the announced SPR release equates to roughly three days of US consumption based on this data — immaterial in our view. Regardless, energy specialists in our network say the SPR move is fully reflected in crude prices — it was telegraphed for weeks — and has no impact on the structural issues driving prices higher.

With Friday’s sell-off, WTI futures are traded below the 200-day moving average. Energy equities remain up-trending and are expected to benefit from structural factors, including continued demand and (currently) limited production capacity. Large-cap energy equities (XLE) and small-cap (PSCE) both traded below their 50-day moving average on Friday, but both remain above their 200-DMAs.
For 2021, WTI spot futures are up 40.5%. XLE and PSCE are up 51.5% and 65.6%, respectively.
Volatility, Flows/Positioning & Sentiment
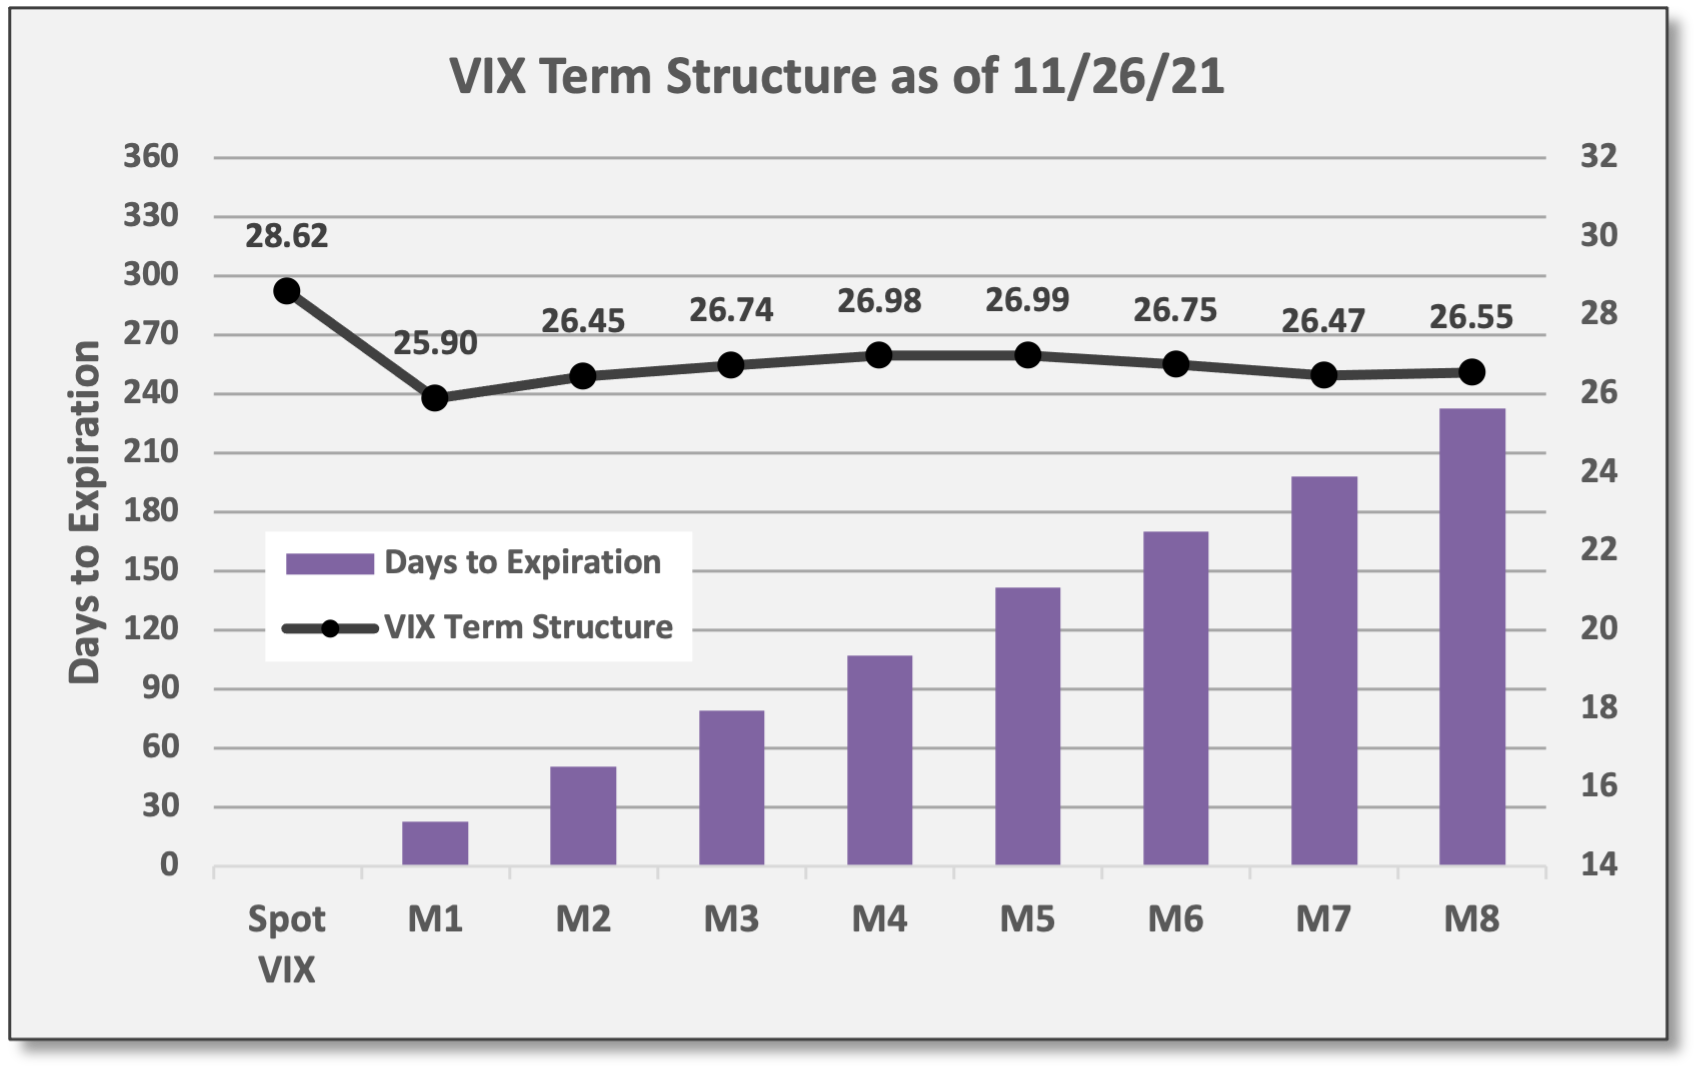
Implied (expected) volatility spiked on Friday with the VIX jumping to 28.62. As a result, equity “protection” strategies using put options are now more expensive. Further out the VIX futures curve, volatility increases were less pronounced. VIX futures already assumed elevated vol over extended time horizons (as is normally the case). By comparison, realized volatility for the S&P 500 (SPY) has been quite low. Even with Friday’s sell-off, trailing 30-day vol for SPY is just 9.44%. As always, volatility tends to spike on equity market declines.

The Market Ear summarized current conditions on 11/26: “As if the new variant wasn't enough, the SPX has now flipped into negative gamma. [Poor] liquidity and short gamma will make this market move big time. Make sure to understand short gamma works both ways, so the dealers that must puke deltas on the way down, will need to chase it to the upside. Basically all moves are from now on magnified by short gamma dealers chasing their tails...”
Alternative Assets/Strategies
Jefferies Prime Services issued a research report2 on trends across alternative investments. Observations included the following:
Improved absolute/risk-adjusted performance for hedge fund managers.
Steady appetite for private equity and hedge funds with investors willing to accept longer-duration structures with extended lock-ups and limited liquidity in exchange for lower fees and greater performance potential.
Jefferies sees an influx of “hybrid funds” as new offerings allow cross-over investments between public securities and private assets.
Increased demand for “emerging managers” — newly launched funds, primarily from experienced professionals. Funds are launching with greater resources and infrastructure. Funds with < $100 million in AUM have seen $4 billion in inflows over the last 18 months after suffering $650 million of outflows during the COVID-dominated first six months of 2020. Note: This trend probably reflects a challenging market environment and an improved opportunity set for skilled active management (i.e., a more selective market).
Digital assets and the related ecosystem are gaining interest. According to Jefferies: “Appetite for exposure to digital markets is growing exponentially. Ways to gain this exposure have diversified, allowing investors more options for playing the digital space without having to invest in assets with higher volatility. We see an increasing number of investors looking at the crypto-adjacent or crypto-ecosystem space, from index funds or ETFs to longer-locked venture funds focused on the broad crypto/digital asset ecosystem.”
Regarding digital investments, Jefferies sees a different implementation emphasis between institutional and retail investors. “Institutional appetite largely remains in the earlier stage, private company space, while retail more frequently focuses on the currencies themselves or index products.” We also see institutional investors favoring digital infrastructure as opposed to direct cryptocurrencies.
Portfolio Construction & Trading Ideas
The value of keeping “dry powder” available. From a portfolio management standpoint and without necessarily predicting near-term outcomes, Friday’s price action is a reminder of the importance of keeping “dry powder” available. Depending on one’s strategy and objectives, it usually makes sense to keep a portion of capital readily available in order to take action when market volatility creates opportunities.
The role of dry powder is (1) to protect capital during volatility events, equity drawdowns, and other market dislocations and (2) to provide capital to be tapped as a funding source for opportunistic investments.
Essentially, the role of dry powder is twofold: (1) protect capital during volatility events, equity drawdowns, and other market dislocations; (2) provide capital to be tapped as a funding source for opportunistic investments.
Dry powder could be cash, money market funds, high-quality short-term fixed income or another reasonably safe asset with ample liquidity.
In some cases, even low-beta alternative strategies can be used as a source of dry powder; although liquidity (access) is usually limited to monthly/quarterly windows, redemptions can be submitted to draw capital to fund larger and longer-duration opportunities.
Moreover, for investors who utilize leverage, various forms of financing can serve as a source of capital. In our view, leverage is not simply a means for amplifying risk/return potential, but rather, the smart use of leverage allows for greater capital efficiency (i.e., more return potential per unit of risk).
The main point here is that unexpected macro events occur on a periodic basis resulting in price volatility. When prices disconnect from fundamentals due to indiscriminate selling, both absolute and relative value opportunities are created. More often than not, quality assets trade lower along with troubled ones; technical factors often produce valuation anomalies. Keeping dry powder available is a matter of being prepared as events unfold and opportunities present themselves.
What Others Are Saying
George Washington, First US President, October 3, 1789: “Whereas it is the duty of all Nations to acknowledge the providence of Almighty God, to obey his will, to be grateful for his benefits, and humbly to implore his protection and favor — and whereas both Houses of Congress have by their joint Committee requested me to recommend to the People of the United States a day of public thanksgiving and prayer to be observed by acknowledging with grateful hearts the many signal favors of Almighty God especially by affording them an opportunity peaceably to establish a form of government for their safety and happiness. Now therefore I do recommend and assign Thursday the 26th day of November next to be devoted by the People of these States to the service of that great and glorious Being, who is the beneficent Author of all the good that was, that is, or that will be. That we may then all unite in rendering unto him our sincere and humble thanks — for his kind care and protection of the People of this Country previous to their becoming a Nation — for the signal and manifold mercies, and the favorable interpositions of his Providence which we experienced in the course and conclusion of the late war — for the great degree of tranquility, union, and plenty, which we have since enjoyed — for the peaceable and rational manner, in which we have been enabled to establish constitutions of government for our safety and happiness, and particularly the national One now lately instituted — for the civil and religious liberty with which we are blessed; and the means we have of acquiring and diffusing useful knowledge; and in general for all the great and various favors which he hath been pleased to confer upon us...”
Goldman Sachs, Equity Research, 11/26/21: “We remain pro-risk with overweights in equities and commodities, and an underweight in bonds. Sustained strong economic growth and low real yields should support risk asset prices. But as the year progresses, look for growth to slow even as rates start to rise — a combination that will likely flatten returns for risky assets from there. Lean into: alpha and relative value opportunities vs. beta-driven strategies.”
JPMorgan, Global Markets Strategy, 111/24/21: “Powell’s reappointment reduces uncertainty, and hence should be a positive for risk assets. Historically, markets try to test new Fed Chairs, so we believe this outcome will be avoided. Additionally, Powell’s experience from 2H18, where policy tightening contributed to the strong market selloff into year-end, will likely result in a cautious approach to liftoff next year.”
Cornerstone Macro, 11/24/21: “Looking ahead, we believe inflation is PEAKING here in 4Q: (1) Consumer spending (demand) on COVID-benefited sectors is clearly starting to fade… (2) For the goods sector, inventories (supply) are clearly elevated, and risk increasing even more, as demand ebbs, at the same time all those goods on all those boats are unloaded. Net, that portends LOWER prices for many sectors… And with shipping rates now declining, odds are [port] congestion is starting to ease, which will further boost imports, and in turn, supply. We expect deflation anecdotes to ramp up, into and after the holiday selling season.”
BlueBay Emerging Markets Credit Alpha Fund, 11/25/21: “One of the major EM events this week included the Politburo meeting in China where the Chinese authorities reiterated their commitment to the policy stance that is weighing on growth. At the same time, they are seeking to manage the fallout by easing liquidity conditions in some of the worst-hit parts of the economy, including real estate. The sense remains that at this stage any liquidity provision is likely to benefit the top tier of real estate companies while doing little to help the most leveraged names where default risk will remain elevated.” CCM Note: BlueBay is a multi-strategy EM credit fund that invests both long and short. The fund was up 7.6% YTD as of 11/19 compared to a decline of -2.6% for the JPMorgan EM Bond (EMB).
As always, reach out to us with questions or feedback. For additional research on any of the topics referenced throughout this briefing, please contact us.
In the new year, the Weekly Briefing will be available ONLY to paid subscribers. To ensure continued full access to Coffee & Capital Markets, please consider joining our research-driven community as a paid subscriber.
This material is for informational and educational purposes only. All data has been compiled from sources believed to be reliable, but there is no guarantee of its complete accuracy.
Facebook (now Meta Platforms), Amazon, Apple, Netflix, Google (now Alphabet).
Jefferies Prime Services, TRENDSGIVING 2021, 11/23/21.