


Weekly Briefing: 11/14/21
Inflation is above-trend, but many growth metrics are above-trend also...


Performance & Other Observations
Just days after a seemingly coordinated push-pack against rate-hikes by global central banks, US CPI printed its largest 12-month increase since October 1990. Core CPI was the highest since September 1991.
Nearly two weeks ago, interest rates moved lower in response to efforts by the Fed, the ECB, and the Bank of England. The collective message from central bankers was that interest rate hikes are not as imminent as market expectations suggested. All this was reviewed in detail in the Monetary/Fiscal Policy section of last week’s briefing.
But last week, those price moves reversed in the wake of the CPI report with rates ratcheting higher. (Details below in the Fixed Income, Rates & Credit section.)
No doubt, October’s CPI report was a bit of a stunner and US inflation trends are not as “transitory” as originally thought. Still, inflation data is probably in a process of peaking and should move lower in 2022. When the second derivative (rate of change) begins to trend lower, markets will get more comfortable with inflation even if levels remain elevated — and almost certainly, core inflation will settle into a range above pre-COVID levels. That might be 2-3% or 3-4% compared to the average of 2.1% over the last 10 years. Of course, these are just the official inflation metrics to which we refer. Other prices might be trending at higher rates.
During the Q3 earnings season, corporate management teams delivered a mostly positive message. For the S&P 500, 81% of reporting companies have beaten EPS estimates and profits are up ~42% year/year.1 Not only were profit/revenue results better than estimates, but companies broadly conveyed a unique ability to navigate different challenges, including labor shortages, rising commodity inputs (inflation), and supply-chain disruptions. However, the steady stream of positive reminders is fading as ~90% of the S&P 500 has reported. From now until year-end, company-specific catalysts will be limited, so “macro factors” could once again dominate asset prices. Keep this in mind when evaluating performance attribution and trying to discern potential fundamental implications.
From now until year-end, company-specific catalysts will be limited, so “macro factors” could once again dominate asset prices.
Usually, seasonal trends for equities are positive into year-end, but US equities have already delivered solid gains in Q4 with the S&P 500 (SPY) up almost 9% and the Nasdaq 100 (QQQ) up over 10%. How much of that year-end rally has played out already? Hard to say…
In the meantime, we remind our readers that rising inflation is set against a backdrop of strong consumer/corporate demand, rising employment, rising wages, and rising wealth effects (due to home price appreciation and rising equity values). We continue to see GDP growth estimates in the 4-5% range for 2022 — more than double the average 2.1% growth pace since the Global Financial Crisis.
In other words, inflation is NOT unfolding in a weak growth environment. Instead, corporate profits and other economic growth metrics are running above-trend.
Most major asset classes declined last week amid the negative inflation surprise. For equities, declines last week were a reasonable outcome after surging prices had lifted indices to extreme overbought conditions.
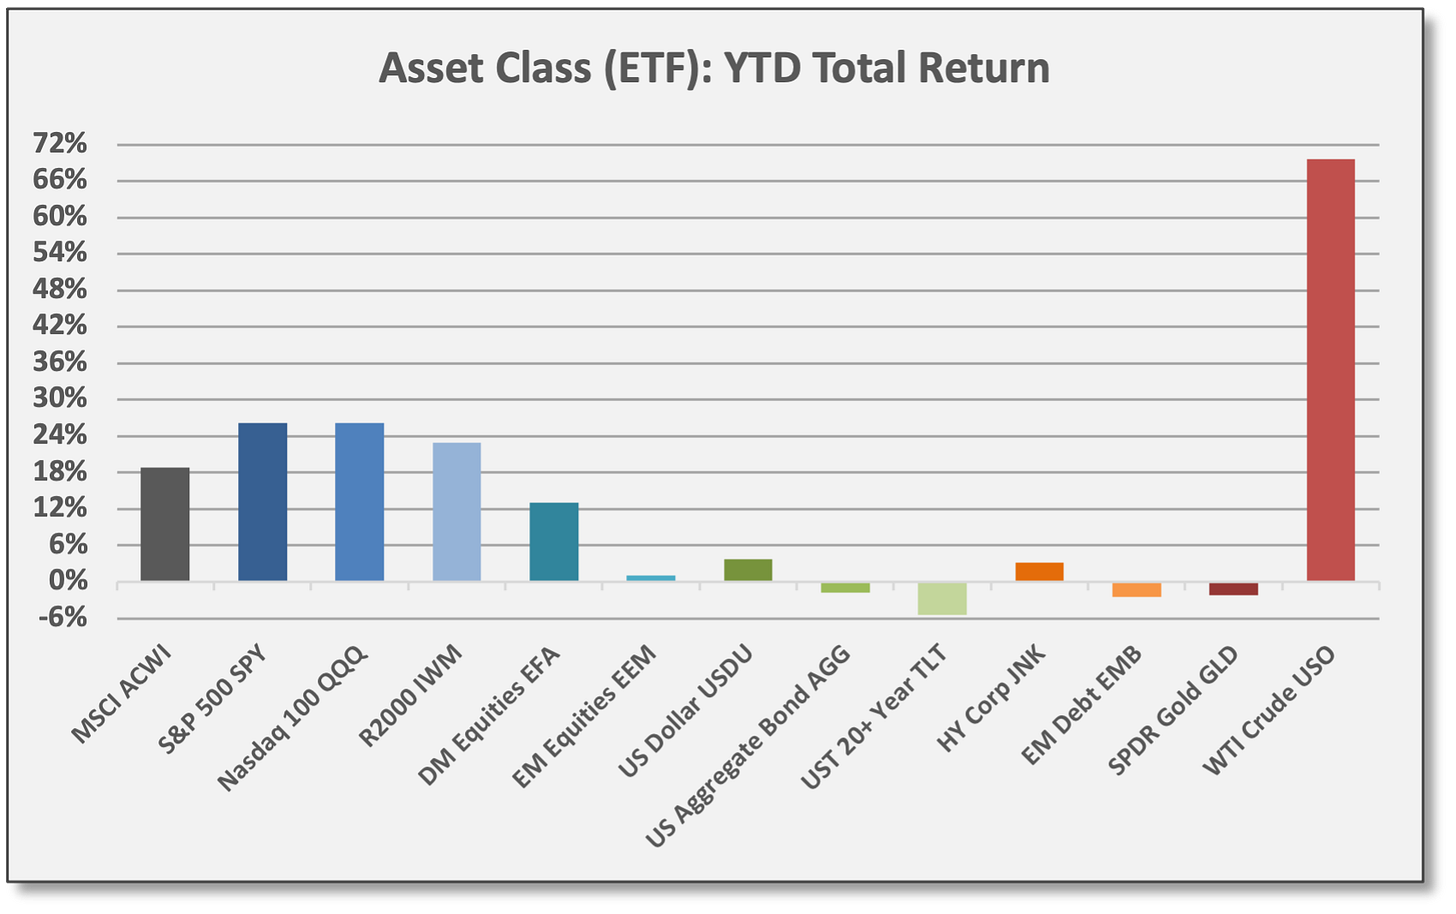
SPDR Gold (GLD) and Emerging Markets (EEM) were the top performers last week, gaining 2.7% and 2.1%, respectively. Perhaps gold is trying to reclaim its status as a perceived inflation-hedge. In a logical move for bonds, only inflation-protected TIPS delivered positive return last week.
For Q4, US equities continue to outperform. S&P 500 (SPY) is up 8.9% for Q4, but the Nasdaq 100 (QQQ) and small-cap Russell 2000 (IWM) have delivered bigger returns 10.3% and 9.5%, respectively.
For 2021, the story is mostly the same with US equities leading other global asset classes. Energy commodities are the exception. WTI Crude (USO) is up almost 70%.


Relative Value Spotlight
The Market Ear (TME) identified China-based equities as a potential relative value opportunity. TME referenced various research sources in forming a list of observations related to China. Several points are listed below, although we have paraphrased in most cases.
Valuations for Chinese equities trade at 18-month lows.
China allocations from active global mutual fund managers are below the 10-year average (EPFR). Moreover, underweights to China from active Emerging Markets fund managers are approaching record lows (EPFR).
Fast-money hedge funds have been sellers of local Chinese equities in recent weeks (JPMorgan). If that trend reverses, it could add upside/buying pressure.
Regulatory tightening is “old news” and might be in the early stages of easing (Goldman Sachs).
Similarly, the Evergrande situation and the regulatory effort to reduce leverage across the property sector is “old news” although there could be lingering effects/risks. Chinese HY bonds have been trading higher and TME calls this space “the weakest of Chinese assets” and a potential positive signal.
Chinese technology shares have been trading higher with a possible technical breakout to the upside.
The volatility gap between US equities and Chinese equities remains wider than normal, suggesting “fear” is still the dominant sentiment priced into markets.
The Market Ear: “If China manages catching a solid bid, the entire EM space will revive.”

Sources: CCM, Koyfin

Invesco China Technology (CQQQ) has underperformed the Nasdaq 100 (QQQ) by nearly 38% this year (illustrated above). Top holdings in CQQQ include Meituan, Tencent Holdings, and Baidu.
Note: We are not highlighting China as an investment recommendation, only relaying research we viewed as interesting and contrarian.
In the new year, the Weekly Briefing will be available ONLY to paid subscribers. To ensure continued full access to Coffee & Capital Markets, please consider joining our community as a paid subscriber.
Economic Data & Trends
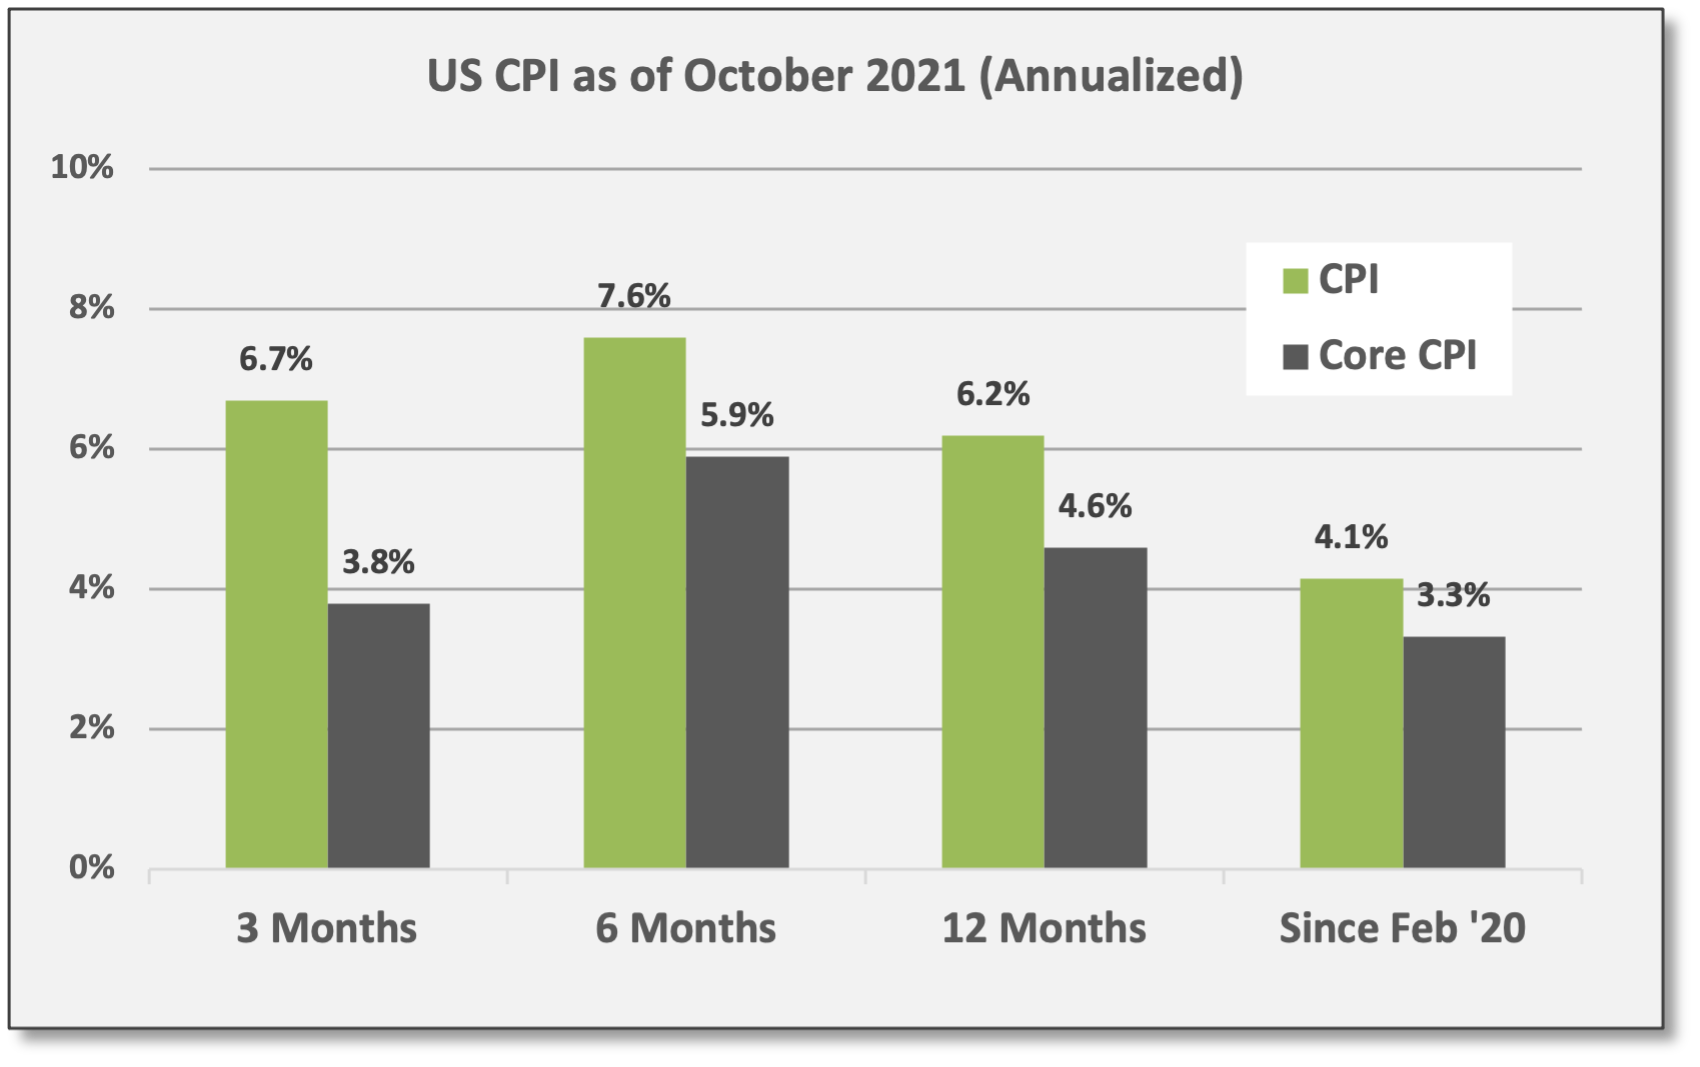
US CPI showed an alarming surprise in October. After several months where various indicators offered some measure of hope that price inflation was peaking and might even be poised to pivot lower — CPI surged 0.9% in October. CPI is now up 6.2% over the last year — the largest 12-month gain since 1990. Core CPI (excluding food and energy) jumped 0.6% and is up 4.6% versus a year ago. Moreover, trimmed-mean CPI (which excludes the most extreme CPI segments in either direction) was up a record 8.9% (annualized) and median CPI was up a record 7.1%.
“Inflation is clearly a problem and the Federal Reserve’s claim that it’s ‘transitory’ looks more and more ridiculous each month.” First Trust, 11/10/21
Notably, inflation is not just rebounding from depressed COVID levels as CPI is up 4.1% (annualized) versus February 2020. Core CPI is up 3.3%.
Energy Prices — a 7% CPI weighting — surged 4.8% in October (non-annualized) and are up 30.0% over the last year. Over the last three and six months, energy prices are up 37.1% and 24.5% (annualized), respectively.
Owners’ Equivalent Rent — a 24% CPI weighting — increased 0.4% in October and are up 30.0% over the last year. Over the last three and six months, energy prices are up 37.1% and 24.5% (annualized), respectively.

Sources: CCM, Bureau of Labor Statistics 
Sources: CCM, Bureau of Labor Statistics, First Trust 
Sources: CCM, fred.stlouisfed.org


Inflation expectations are rising. Rising prices resulting from temporary supply/demand conditions can be reasonably viewed as transitory, but rising inflation expectations can be more problematic. When workers, property owners, and suppliers/producers demand higher wages, rents, and prices to offset rising costs, respectively, then inflationary trends become more structural and persistent.
According to the NY Fed’s Survey of Consumer Expectations for October, consumers expect CPI to rise at a median level of 5.7% (annualized) over the next 12 months and 4.2% over the next 36 months. Both are record highs since the inception of the survey in June 2013. Similar expectations reported by the Michigan Consumer Sentiment surveys where consumers expect 6.7% inflation over the next 12 months and 3.7% over the next 60 months.
Positive economic growth indicators: Inflation coverage obscured other positive growth data reported last week.
JOLTS2 show improving employment conditions. For September, job openings were essentially flat versus August, but “quits” increased to 4.4 million (record high) and 3.0% of total US employment (record high) with the private quit rate up to 3.4% (also a record high). Quits are mostly voluntary; the “quits rate” measures workers’ willingness/ability to transition from one job to another. Voluntary transitions are usually based on higher wages/compensation and/or better conditions/benefits. Thus, a rising quits rate indicates strong labor demand and a growing economy. Meanwhile, average hourly earnings are up 4.9% over the last year with the average work-week up 4.2% as of the October jobs report.
C&I (commercial and industrial) loan activity accelerated to a 10% year/year pace in October, according to Bespoke, based on data from the NY Fed’s Q4 Senior Loan Office Outlook Survey (SLOOS). Besides steady demand, banks reported an easing of lending standards.
NFIB Small Business Optimism declined in October, but sales/demand trends are holding up well. At 98.2, the Optimism index sits near the middle of its pre/post-COVID range. When asked to identify the top problem they are facing, “quality of labor” was listed by 24% of small business owners, making it the largest issue identified in the survey. Quality of labor is up from a year ago (21%) and is close to its highest reading in the history of the survey (28%). Taxes (17%) and inflation (16%) were the next two most challenging problems being faced. Only 5% listed “poor sales” as the top problem, down since a year ago (15%) and near its lowest reading in survey history (2%). Throughout the Q3 earnings season, strong sales/demand has been a theme from corporate management teams.
Fixed Income, Rates & Credit
WIth rising inflation fears and interest rates, bonds delivered negative returns last week.
Last week, only UST inflation-protected bonds (TIP) and the US dollar (USDU) showed gains, delivering returns of 0.6% and 0.4%, respectively.
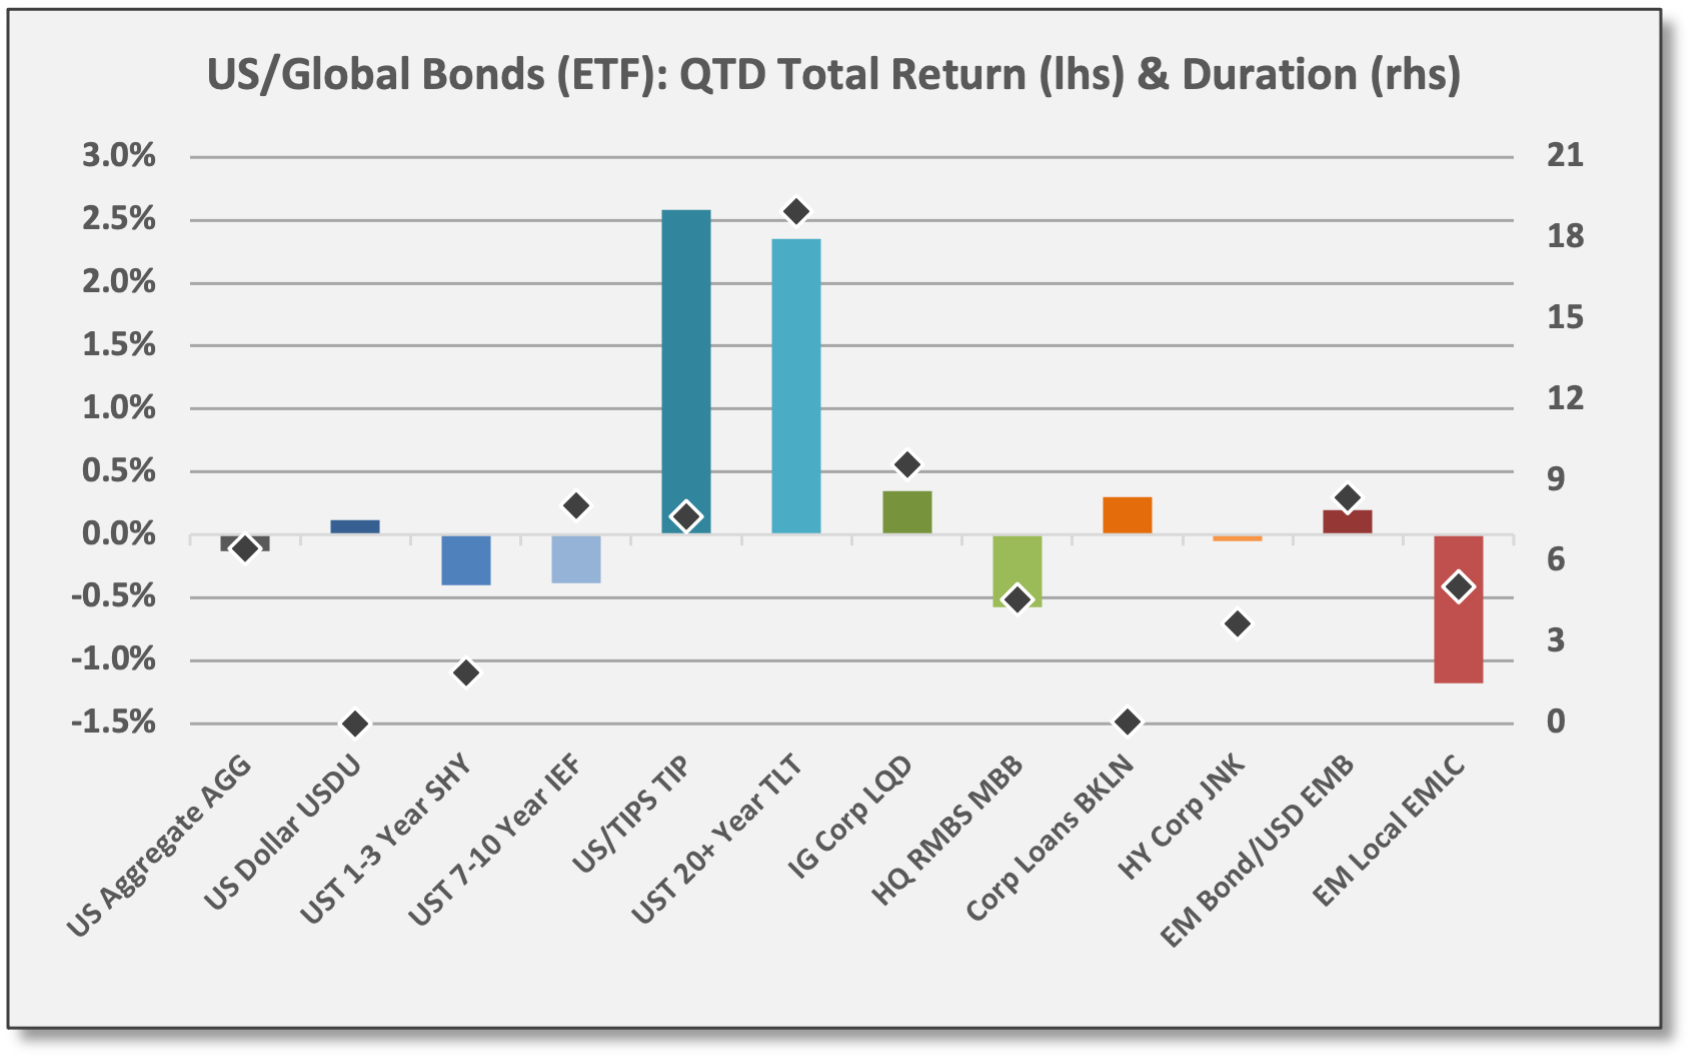
For Q4, TIPS and long-duration USTs have outperformed. TIPS have benefited from rising inflation and inflation fears. Meanwhile, USTs with 20/30-year maturities have gained with long rates (surprisingly) moving lower this quarter; the yield curve has flattened as short and intermediate-term rates have moved higher on inflation/policy concerns.
For 2021, TIPS and the US dollar are the top-performers along with high-yield corporate bonds/loans. Again, TIPS are benefiting from rising inflation concerns. USD tends to benefit from higher US policy rates (and resulting higher real rates); a Fed Policy shift is underway with tapering (reduced asset purchases) having commenced this month, although rate hikes are still off in the distance.

Sources: CCM, Koyfin 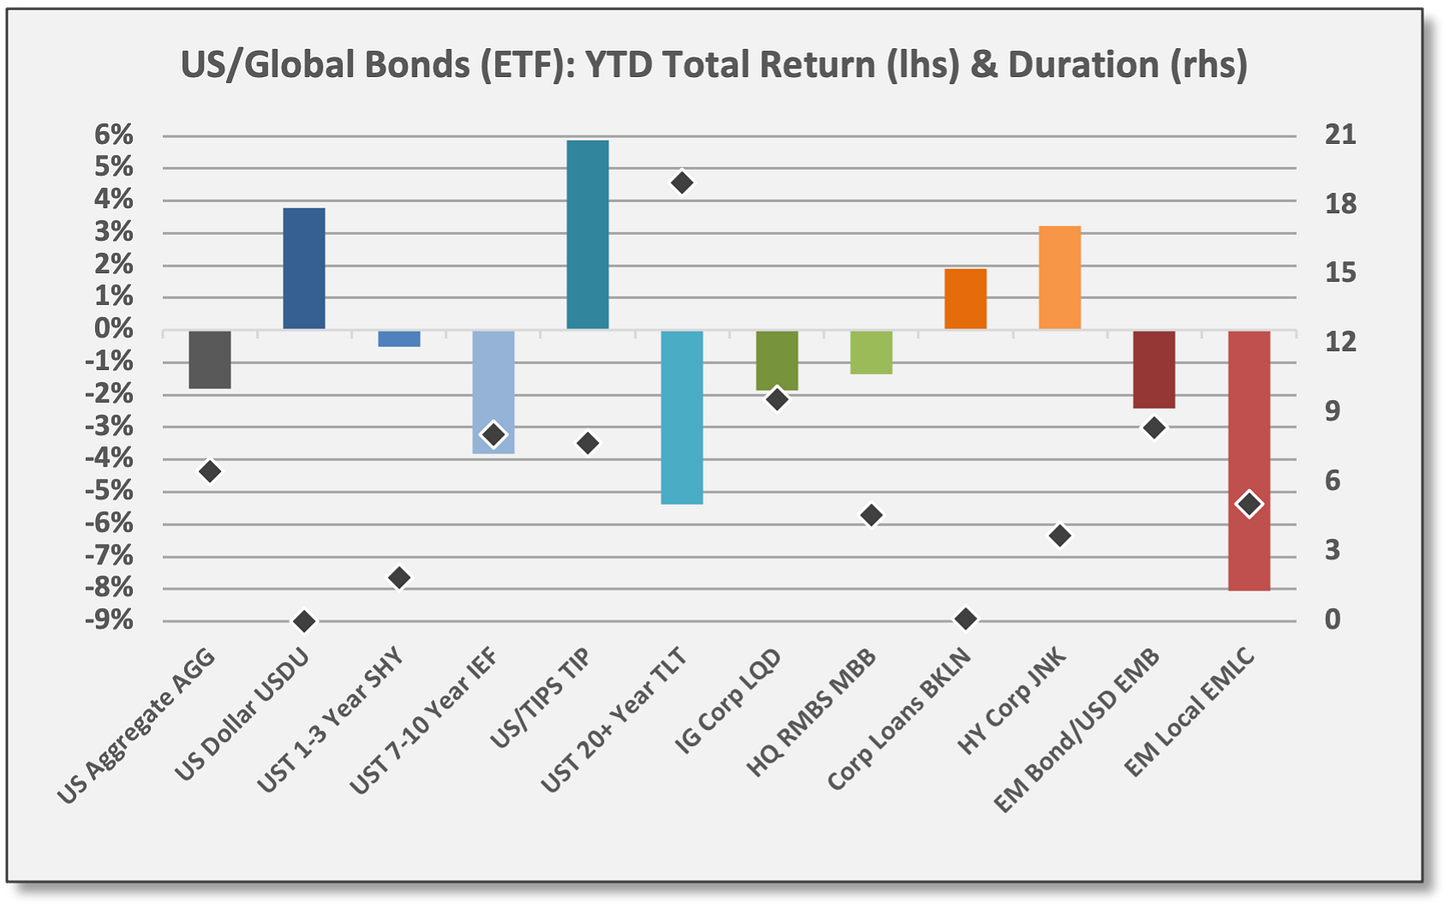
Sources: CCM, Koyfin

Bond volatility remains elevated, according to the BofA MOVE Index. Similar to the VIX for the S&P 500, the MOVE — Merrill Lynch Option Volatility Estimate — measures implied (expected) volatility for UST securities based on one-month call/put options. MOVE is yield-curve weighted based on the size/issuance of 2/5/10/30-year USTs.
US interest rates have been vacillating over the last two weeks based on inflation data and Fed Policy intentions.
Rates were increasing leading up to the FOMC meeting on 11/3 based on expectations the Fed would begin to reduce bond purchases and eventually embark on rate hikes. Indeed, the Fed confirmed tapering will commence this month, but Fed Chair Powell downplayed rate hikes (and the ECB and BoE also joined the no-hikes-yet chorus). The message was unambiguously dovish and interest rates promptly recalibrated lower.
Rates continued to drift lower until the CPI report this week. Even as the consensus concluded that inflation was not nearly as “transitory” as the Fed originally suggested, markets were more or less accepting that the Fed would hold off on hikes.
But rates jumped on news of the inflation surge, then drifted higher on Friday after bond markets were closed for Veteran’s Day. The market seems to be saying the Fed cannot ignore inflation any longer. Short/intermediate rates finished the week higher than where they were before the FOMC meeting — so the entire rate decline has been undone.

Sources: CCM, treasury.gov

Are rates markets overreacting? Possibly yes, but the recent moves are rational based on the incoming data — at least from a directional standpoint.
Besides spot rates moving higher, probabilities for rate hikes have once again increased. As of Friday’s close, Fed futures were pricing an 83% probability of at least two hikes by December 2022, up from 62% a week ago.
The market-based probability of three hikes next year jumped to 30% from 20%.

Sources: CCM, CME FedWatch Tool (cmegroup.com)

Negative real rates across the curve. With CPI up by 6.24% over the last year, “real rates” are negative by ~465-575 basis points for USTs with 2/5/10-year maturities.
UST 10-year closed the week with a yield of 1.58%. UST 5-year closed at 1.24%. TIPS trade at negative yields of -1.15% and -1.87% for the 10-year and 5-year maturities; principal amounts for TIPS are adjusted for changes in CPI.
Inflation “breakevens” imply 3.1% CPI over the next five years and 2.7% inflation over the next 10 years (based on nominal UST yields and TIPS yields).
Unless rates move higher or inflation moves lower, UST coupons alone will be hard-pressed to deliver positive inflation-adjusted returns in the years ahead. Of course, if interests move lower, the duration impact of higher prices could generate positive total returns for USTs.

Sources: CCM, treasury.gov

US/Global Equities
US equities declined last week, but remain the leader for 2021.
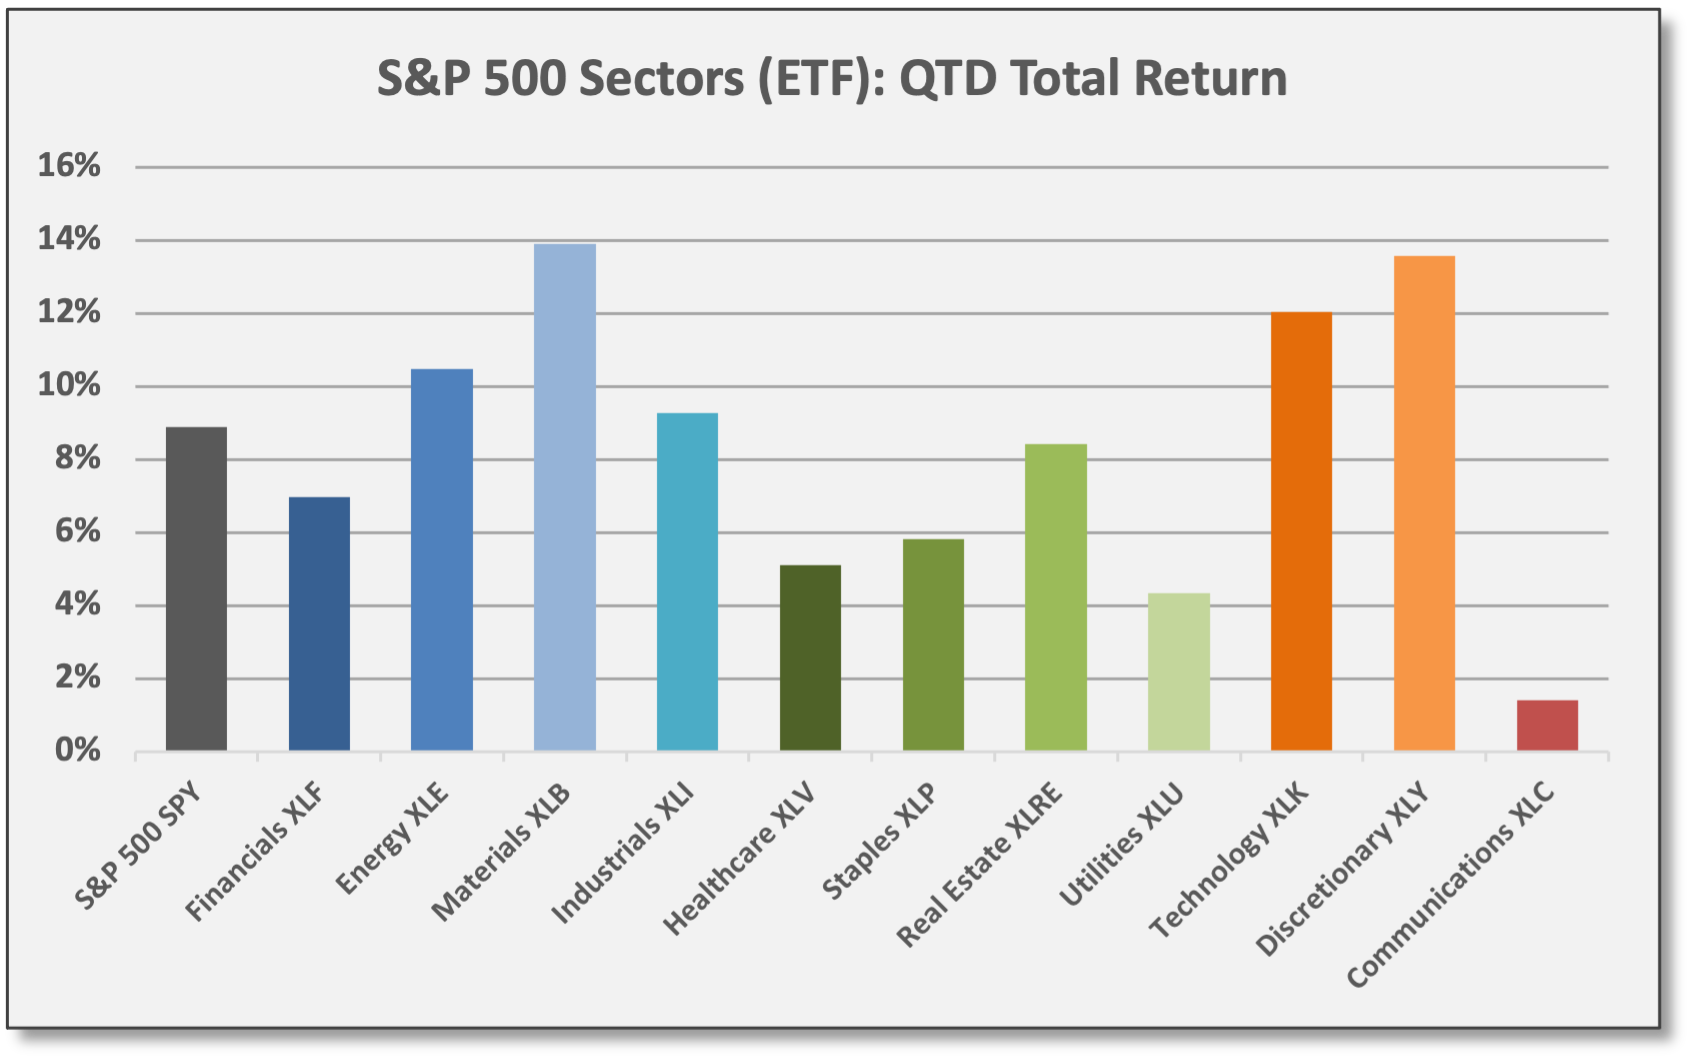
Last week, the S&P 500 (SPY) declined -0.3% on less robust earnings reports and the negative US inflation surprise. Six sectors declined and five gained. Largest movers for the week: Materials (XLB) up 2.6%, but Consumer Discretionary (XLY) down -3.5%.
For Q4, all S&P 500 sectors are up. Cyclical/value and quality/secular growth are leading the way with the exception of Consumer Discretionary (struggling due to Meta Platforms (FB)). Defensive/yield sectors are positive for Q4, but lagging with rising inflation fears and short/intermediate rates, although Real Estate (XLRE) is performing well due to underlying exposures in digital communications services and other growth sectors.
For 2021, cyclical/value — especially Energy and Financials — are leading.

Sources: CCM, Koyfin 
Sources: CCM, Koyfin

On a global basis, Emerging Markets outperformed last week with leadership from China. MSCI China (MCHI) and CSI 300 (ASHR) gained 4.5% and 1.6%, respectively.
For Q4, the US is outperforming. For 2021, the US is outpacing most Developed Markets and Emerging Markets with a few exceptions. The S&P 500 (SPY) is up 26.2% YTD. Russia (ERUS), however, is the top major market with a gain of 32.4% — due mostly to energy industry exposures.

Sources: CCM, Koyfin 
Sources: CCM, Koyfin


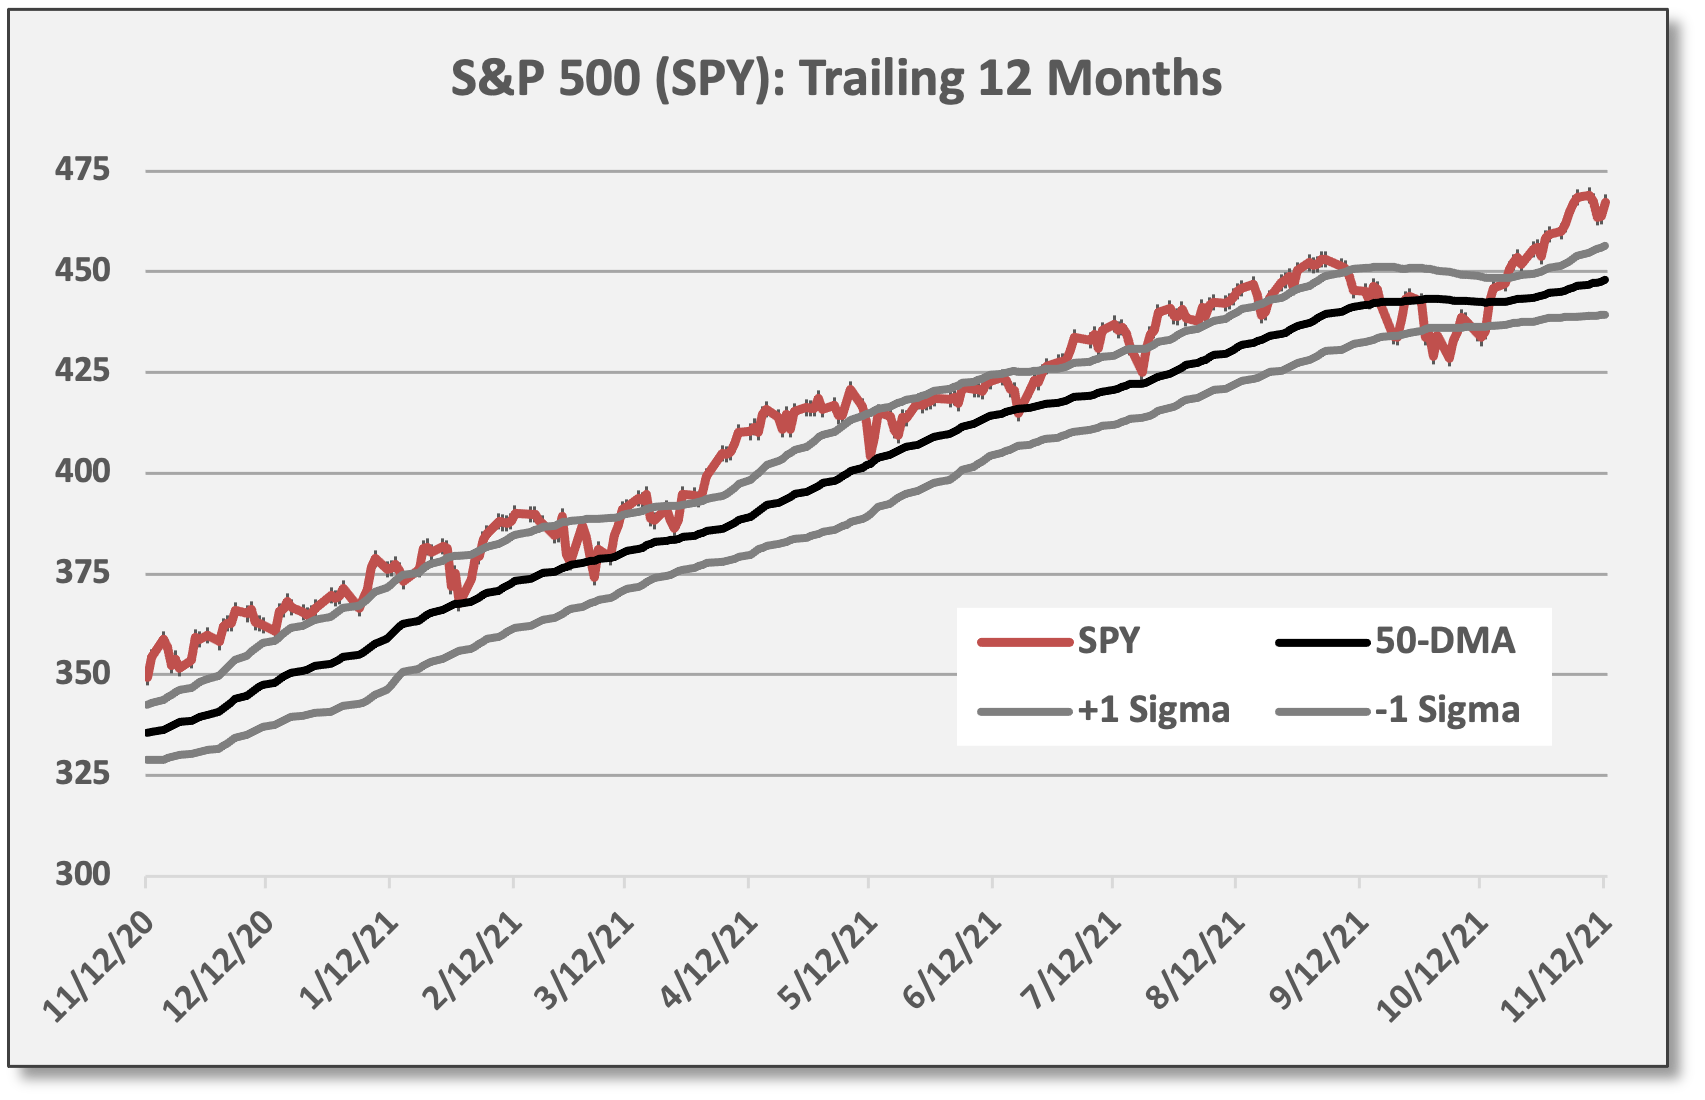
A week ago, US equity markets were trading at “extreme overbought” levels. With equity declines last week — and given the passage of time to allow moving averages to catch up — conditions now are less extended on a technical basis, but remain overbought.
Looking inside the S&P 500, “only” 46% of the underlying stocks are overbought and 12% are oversold, so “there are plenty of areas of the market that aren’t overheated and thus could have room to run higher as investors rotate into and out of various groups and sectors,” per Bespoke.

Company-specific highlights from last week:
PayPal (PYPL): Net income gained 6.5% year/year and EPS gained 7.0%, beating estimates by 3%. Total payment volume gained 24% versus a year ago and revenues gained 13%, but both missed estimates. PYPL traded lower following the revenue miss. However, PYPL announced an agreement with Amazon to enable users to pay with Venmo. CEO Schulman is “appropriately cautious” looking into 2022 with global supply chain disruptions negatively impacting PYPL’s “merchant” client base and he said consumer confidence has “weakened with the absence of stimulus payments.” PYPL is a global Fintech company that provides online payments services. PYPL declined last week and is down -11% YTD.
Coinbase (COIN): Net income gained 400% year/year and EPS gained 600%, beating estimates by 8%; net revenues gained 330% year/year, but missed estimates by 17%. On a sequential basis versus Q2, trading volumes (-29%), revenues (-39%), and net income (-75%) all declined, but “monthly transacting users” beat forecasts according to Bespoke and COIN raised full-year guidance for this metric. Coinbase offered this: “Swings in market conditions are expected in these early days of the crypto-economy. However, the crypto-economy is growing and innovating throughout, and Coinbase is positioned to thrive.” ARK Investment is the top institutional holder of COIN; hedge funds Tiger Global and Citadel are listed among the top holders of the Fintech company that provides a trading/custodial platform for cryptocurrencies. COIN is down -10% from its IPO last April, but has rallied 51% QTD.
Palantir (PLTR): Adjusted EPS were flat year/year, but beat estimates by 10%. Revenues increased 36% year/year, slightly beating estimates. Founded by Peter Thiel, PLTR is a software firm focused on “big data” analytics. PLTR declined for the week and is down -3% YTD, but is up 128% since its IPO 13 months ago.
Upstart (UPST): Adjusted net income increased 366% year/year with EPS beating estimates by 80%. Revenues increased 250%, beating estimates. Third Point is the top institutional shareholder with a 17% stake; other hedge funds including DE Shaw and Renaissance Technologies are among the top holders. UPST is an AI-oriented Fintech company that connects consumer borrowers to lenders; the firm’s loan origination supplies fund managers in the structured credit space. UPST declined last week, but rallied on Friday; UPST is up 548% YTD and 916% since its IPO last December.

Break-ups announced last week: JNJ, GE, and Japanese-based Toshiba.
Johnson & Johnson (JNJ) announced it would split into two companies: A revamped JNJ will focus on high-growth pharmaceuticals and medical devices, while a “new consumer health company” will focus on defensive/consumer brands. Currently, JNJ is the #2 holding in S&P Healthcare (XLV) with an 8.5% weighting.
GE (GE) announced a pending split into three companies focused on (1) aviation, (2) healthcare, and (3) renewable energy/power. GE is the #7 holding in the S&P Industrials (XLI) with a 3.8% weighting.
The announced restructurings at JNJ and GE will take at least 18-24 months to complete.
“While the US has a long history of corporate spin-outs and de-mergers, the Japanese market has historically proven very resistant to activist-driven efforts to create shareholder value and break-ups of conglomerates in general.” Bespoke, 11/12/21
In Japan, Toshiba (TOSYY) announced aa split into three companies focused on (1) energy and infrastructure services, (2) technology devices and storage, and (3) a holding company for Toshiba’s interests in Kioxia and Toshiba Tec (technology hardware and semiconductors). Bespoke: “If anything, the Toshiba announcement is more significant than the JNJ or GE ones; while the US has a long history of corporate spin-outs and de-mergers, the Japanese market has historically proven very resistant to activist-driven efforts to create shareholder value and break-ups of conglomerates in general.”
JPMorgan favors Japanese equities, which tend to provide cyclical/value exposure based on global manufacturing. “We stay positive on Japanese stocks into 2022 since: (1) a future recovery in earnings is not adequately priced; (2) Japanese stocks should catch up with overseas stocks given the large valuation gap; and (3) overseas investors are likely to become net buyers. We also expect a Value preference to continue.”
Commodities & Real Assets
Diversified Commodities gained last week.
Precious Metals (DBP) — 80% gold and 20% silver — gained 3.1% last week. DBP is the top-performing commodity group for Q4 with a gain of 7.9%. SPDR Gold (GLD) gained 2.7% last week to rank as the top-performing primary asset class we follow. GLD is up 6.2% for Q4, but remains down -2.2% for 2021. Based Metals (DBB) also gained 3.1% last week.
Energy (DBE) was down last week, but remains the top performer YTD with a gain of 65.0%.

Sources: CCM, Koyfin 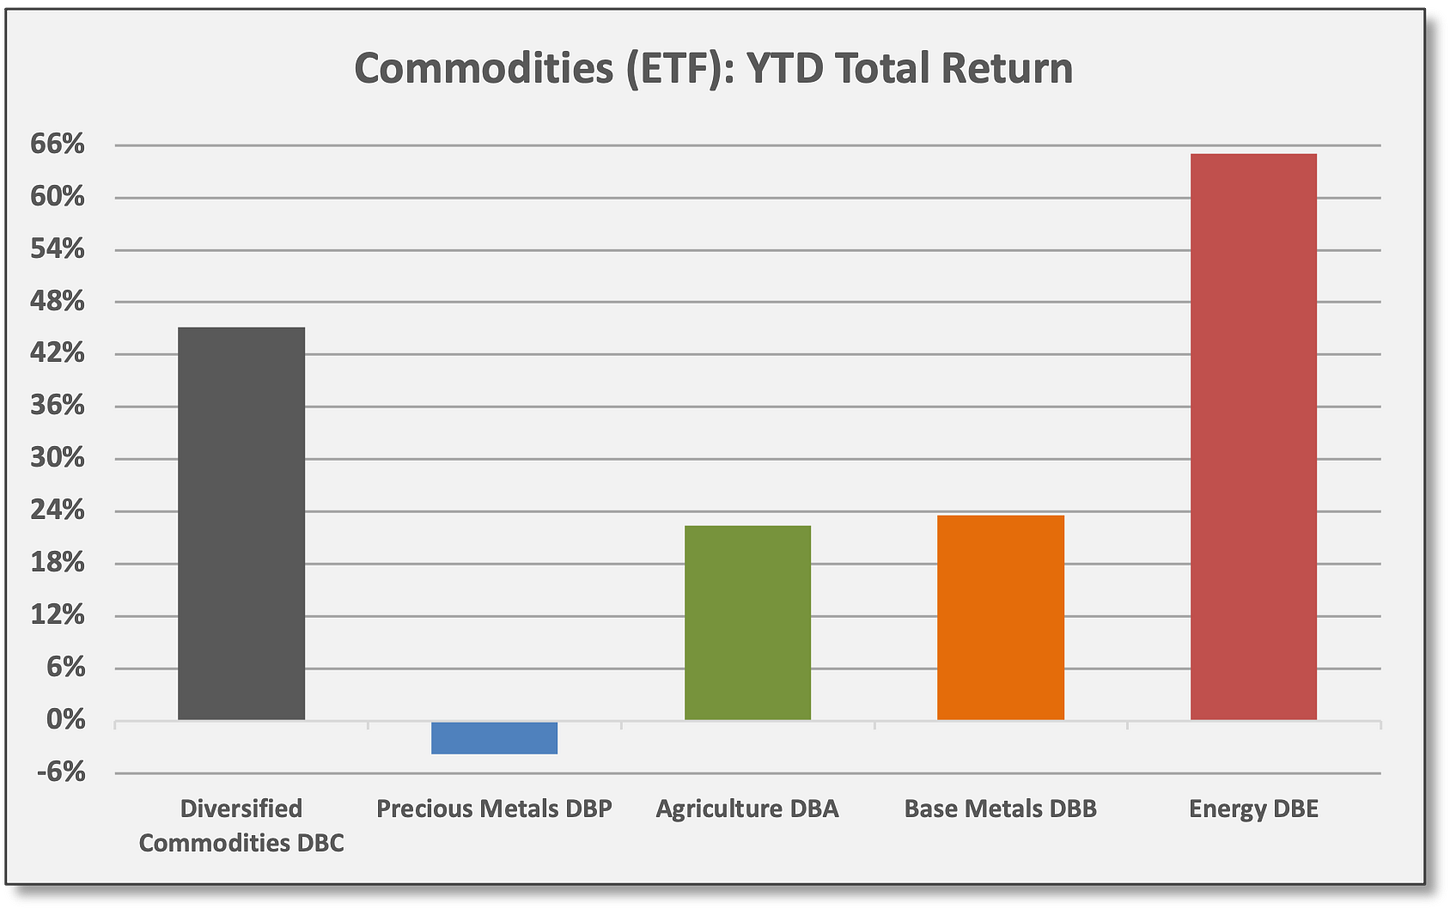
Sources: CCM, Koyfin


The Market Ear as of 11/12: “Is that old boring shiny thing that ‘just sits’ there the inflation hedge to love? One thing is [for] sure: Gold is unloved and a lot of people have switched from gold to BTC. Imagine they start reversing that ‘fundamental’ trade?”
Volatility, Flows/Positioning & Sentiment
Next Friday 11/19 is the expiration date for November options. Monthly options expire on the third Friday of every month. As opposed to weekly options, monthly options have larger trading volumes (open interest). Options-related activity can influence cash equity markets during options expirations so we monitor “OpEx” week.
Over the last year, with options trading volumes rising, equities have experienced (1) more volatility and (2) weak overall returns during OpEx week “as investors look to square their positions ahead of the Friday settlement,” according to Bespoke. That is not to say larger options volumes are necessarily creating this performance phenomenon and the sample size is small at just 12 data points, but an interesting data point.

Over the last 12 months, the S&P 500 Index has delivered positive returns during OpEx week just 25% of the time — a lower than usual rate — but S&P returns during the week before and the week after have been positive 75% of the time (both higher than usual rates). Since 2010, the S&P has been positive 59% of the time during OpEx week — and positive 59% and 57% of the time during the week before and the week after, respectively.
We are not trying to predict weekly performance, but rather to point out that technical and other non-fundamental factors exert influence on short-term asset prices.
The performance divergence has been pronounced over the last year — enough to get our attention.
Note: In highlighting this data, we are not trying to predict weekly performance, but rather to remind readers that technical and other non-fundamental factors exert influence on short-term asset prices. Keep this in mind when evaluating performance attribution and drawing fundamental conclusions.
What Others Are Saying
David Zervos, Chief Market Strategist, Jefferies, 11/14/21: “The market continues to miss the COVID-induced disinflationary productivity surge that will continue for years to come and instead expects short-term supply bottlenecks to somehow be permanent. Based on the reaction to the latest CPI print, there may be an opening for some hedges to move into more attractive territory.”
The Market Ear, 11/9/21: “‘Everything is overbought’ is probably the main ‘buzz’ phrase that comes to our minds as we read our inboxes. The problem with ‘overbought’ is the fact that it can remain overbought for longer than you may think is possible. NDX is overbought, but we have seen much more overbought markets on many occasions... not to mention the late 90s melt-up... We speak to a lot of smart people on a daily basis. Most have missed the latest seasonality squeeze and they are all trying to explain how overbought this market is etc. There is some logic to what they are saying, but in this options-driven market, the smart guys aren't in charge. Just a few weeks ago some of these smart short people were excited about the market moving lower while they were arguing ‘look at Citi's economic surprise index, bro.’ It was printing new post-Corona lows, but since mid-Sep, the CESI/US has moved higher and SPX has caught up with a lag. The year is coming to an end. Most smart people have not performed overly well. We ask ourselves how open the CIO is, explaining to you that the net-shorts you are running as this [CESI/US] ‘fundamental’ indicator is pointing straight up and investors aren't happy with your performance... Could we get another squeeze higher where the last bears need to give up and chase equities higher?”
JPMorgan, Global Markets Strategy, 11/10/21: “We continue to expect this reopening trend to lead to a strong cyclical recovery as pent-up consumer demand is unleashed, and corporates ramp up CAPEX and rebuild depressed inventories. While equities have begun to price in this outcome, staging a notable rally over the past month and beginnings of a rebound of cyclical segments, we believe they have much further to go (particularly in respect to cyclical/value outperformance), and recent bond market moves appear disconnected. Yields fell over the past couple of weeks, largely driven by technicals/position unwinds, which were exacerbated by the BOE surprise hold last week and weak liquidity. As this positioning pain is worked though, we expect longer-term rates to resume their rise. Meanwhile, the cyclical recovery, persistence of inflation and energy supply risks continue to support our large commodity OW.”
HN Summit House Credit Opportunities, 11/5/21: “Despite the low return and tight spread environment within the broader credit landscape, our portfolio managed to outperform [in Q3] given the continued focus on idiosyncratic situations where we can capture illiquidity premium. A lack of participation from larger managers allows prices to remain depressed for longer periods of time until a catalyst causes the credit instruments to re-rate... While it would be disingenuous to claim that the broader credit opportunity set is as attractive as it was eighteen months ago, there continues to be idiosyncratic opportunities that populate our segment of the market. Irrespective of market conditions or cycles, management teams will find ways to over-lever their balance sheets which inherently result in periods of transitory credit stress. Our business is predicated upon finding situations where we can properly price those negative developments and get paid in excess of fair value for the risk we are taking. Our tendency to invest in the most senior portion of the capital structure creates some inherent downside protection as we are typically first in line to recover should a situation worsen.”
Note: HN Summit House is a Dallas-based credit specialist focused on stressed corporate debt situations in the small/middle-market segment. Founder/PM Jed Walsh, previously with Verition Fund Management, runs a capital call/drawdown structure; HNSH has $55 million in committed capital. Fund I was up 23.8% YTD as of 9/30 with a current distribution yield of 10%.
North Reef, 11/8/21: “It’s early November, but we’ve already seen the Federal Reserve commit to taper its bond buying — a substantial policy event that has been well-received by the market as of this writing. We are maintaining our relatively neutral market exposure and a bit lower leverage as this is a massive change in ‘easy money’ policy (even though it has been well telegraphed) and I prefer to be patient in evaluating the full ramifications. Our focus remains on company-specific idiosyncratic opportunities — this is where we generate the most alpha — of which our basket of new ideas is quite full.”
Note: North Reef is a low-beta/low-net sector fund devoted to Financials. Founder/PM Jimmy Hanna launched the fund in May 2021 after a tenure as PM inside Millennium Management. Hanna believes the “easy money” in Financials was made in the first half of the year and alpha generation going forward will require the ability to differentiate “specific stock and sub-sector stories.” North Reef is up 10.0% over the six months since its inception with gross and net exposures averaging ~260% and 5%, respectively.
BlueBay Emerging Markets Credit Alpha Fund, 11/11/21: “In EM fixed income, inflation also remains the key variable as EM central banks have raised rates quite aggressively in a bid to maintain credibility in the face of rising inflationary concerns and weaker fiscal discipline in many countries. Those hikes will be much more impactful if inflation actually begins to stabilize as many of the forecasting models predict in the fourth quarter of this year. There remains much skepticism around the ability of forecasters to get this call right, given the extent of the miss so far this year, but that skepticism has also resulted in a poor risk/reward for further paid positions in many markets. In local markets, therefore, we continue to view valuations as attractive but recognize that a catalyst in the form of a more stable inflation outlook is required before that cheapness will result in outperformance.”
Note: EM Credit Alpha is a long/short EM credit strategy. The fund was up 8.3% YTD as of 11/5 versus the JPM EM Bond (EMB) down -1.3%.
This material is for informational and educational purposes only. All data has been compiled from sources believed to be reliable, but there is no guarantee of its complete accuracy.
According to JPMorgan, Global Equity Strategy dated 11/12/21.
Job Openings and Labor Turnover Summary (JOLTS) issued by the US Bureau of Labor Statistics. Openings actually declined 1.8% from August to September, but the losses were concentrated in leisure/hospitality and presumably related to a late summer COVID wave, which faded in October as cases declined.