


Weekly Briefing: 9/19/21
Four legs good. Two legs bad...


“Four legs good. Two legs bad.” That was the maxim from Animal Farm, George Orwell’s precursor to 1984.1
Orwell’s writing might offer many applications, but our main reference today relates to the binary nature of recent market leadership. Since the onset of COVID, growth and value have jostled for the spotlight. We detailed the back-and-forth rotation on 8/29.
Specifically, the enduring nature of quality secular growth has traded leadership with the boom/bust of value/cyclicals. During the economic shutdown, secular growth outperformed. Then reopening built momentum and value/cyclicals set the pace from September 2020 to March 2021. Since then, growth has been dominant once again as above-trend growth levels collided with a deceleration of growth momentum amid delta variant concerns and rising COVID cases.

Lately, it’s been “secular growth good, value/cyclicals bad.” In fairness, growth and value styles are both up for 2021, but the performance disparity has been stark of late. Russell 1000 Growth (IWF) and Russell 1000 Value (IWD) are up 19.1% and 17.6% YTD, respectively. Since 3/8, however, IWF is up 24.8% and IWD is up just 8.2%.
Markets might be grappling with what comes next.
Over the last several trading sessions, investors have been in a risk-off mood. Has the data shifted? Not necessarily: Last week, US retail sales were stronger than expected and inflation was lower than feared. Maybe it’s investor fatigue or simply a lack of data momentum, but either way, investor sentiment could remain moody until corporate earnings season ramps up in early October.
In the absence of positive company-specific catalysts (earnings season), investors are left mulling other concerns. Last week, we heard a lot of chatter about sell-offs and how the S&P 500 is due for a drawdown of at least 5-8%. A drawdown could happen at any time for virtually any reason, especially after an extended period of robust gains. Indeed, certain market sub-sectors have already experienced painful declines. (For more drawdown data, see US/Global Equities below.)
Ironically, for all the emphasis on sell-offs, most strategists anticipate accelerating growth fundamentals into year-end with broad gains for US/global equities.
A few observations and reminders:
Short-term volatility is part of the capital markets. Investors endure the near-term ebb and flow to capture the larger trend over time. And notably, “year-end” is barely three months away; not exactly an extended holding period.
Time horizon matters and it varies for different investors along with return objectives and risk tolerance. Positioning for short-term leadership swings is the domain of skilled traders and specialists; it requires exceptional execution (both entry and exit). Such moves are less relevant for multi-asset allocators who keep some degree of balance across their factor exposures.
Nonetheless, tracking the fundamentals, investor sentiment, and the various attribution sources driving performance remains an important discipline. Discerning such factors will influence allocation decisions — even tactical rebalancing trades with shorter time horizons. All this depends on one’s approach to portfolio construction and investment management.
The binary narrative keeps flipping back and forth. Below the surface, however, behavior is more nuanced. Many companies have overlapping factor exposures. Usually, the best equity opportunities combine improving growth with relative value.
For full access to Coffee & Capital Markets, please consider joining our community as a paid subscriber.
Performance Observations
Another nondescript week for asset class performance as markets struggle to figure out where policy and growth fundamentals and inflation will go.
US/global equities mostly declined last week. S&P 500 (SPY) was down -0.4%.
Across US equity sectors, results were mixed last week. No obvious themes.
Russell 2000 (IWM) gained 0.3% last week, but Emerging Markets (EEM) were off -2.0%. For Q3, these two proxies for global value/cyclicals have declined.
MSCI China declined -4.2% last week amid continued investor outflows.
Nasdaq 100 (QQQ) — the epitome of secular growth — is the top-performing equity market for both 2021 and Q3. Last week, QQQ declined -0.7%.
On a technical basis, most equity groups, sectors, and regions have worked off their “overbought" status — trading in line with 50-day moving averages.
Long-duration bonds gained last week as the yield curve bull-flattened on the positive inflation surprise. UST 20+ Year (TLT) gained 0.5%. Corporate credit was modestly higher. UST 10-Year closed at 1.37%, up 44 bps for 2021.

Sources: CCM, Morningstar 
Sources: CCM, Morningstar 
Sources: CCM, Koyfin

Economic Data & Trends
Retail sales beat expectations in August, increasing 0.7%. Economists actually were expecting a decline, but July sales were revised lower — a reminder that monthly data is volatile and subject to revision.
Over the last year, US retail sales are up 15.1%, although the three-month annualized rate shows a sales decline of -0.9%. Notably, retail sales are 17% above the pre-COVID peak of January 2020.
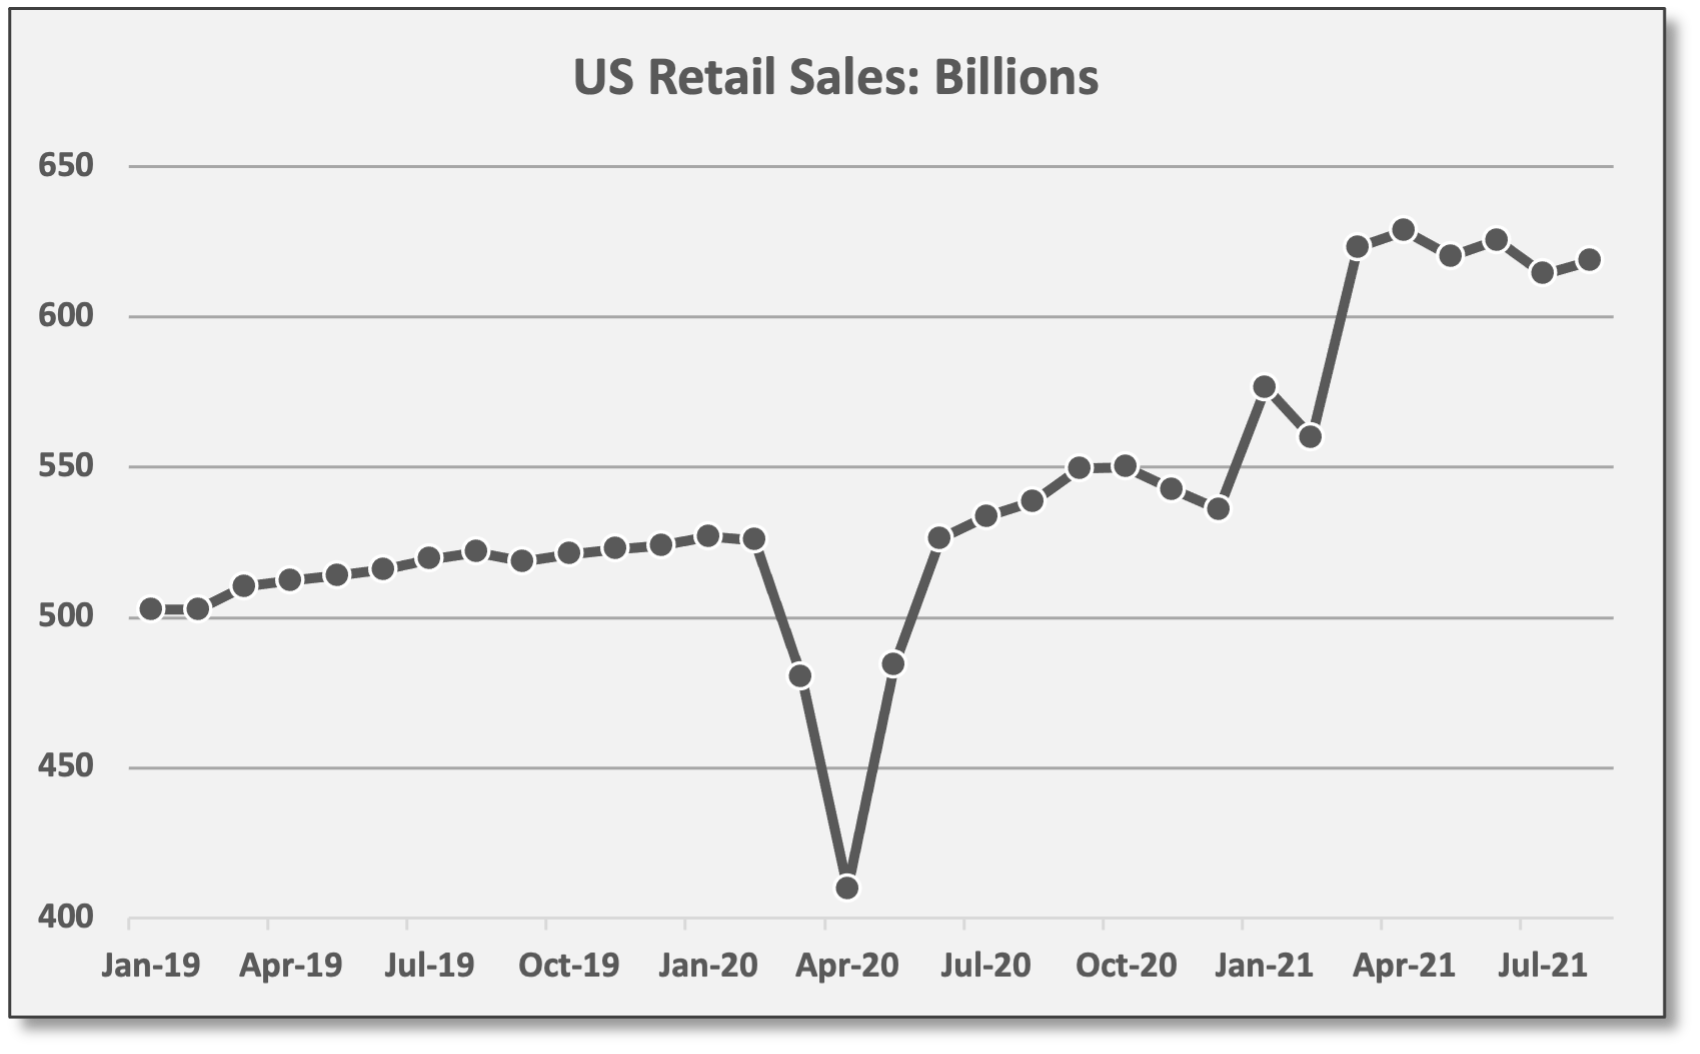
First Trust: “In the months ahead, the path of retail sales will be a battle between a number of opposing factors. Rising wages, jobs, and inflation will all be tailwinds for retail sales, while the waning of the temporary and artificial boost from ‘stimulus’ checks along with the end to overly excessive jobless benefits will be headwinds.”
Consumer Price Inflation (CPI) rose 0.3% in August, mostly in line with expectations, but Core CPI at 0.1% was below expectations. Over the last year, CPI and Core CPI are up 5.3% and 4.0%, respectively, although price trends have been even more elevated over the last 3-6 months.

Obviously, COVID disruptions have led to data distortions. Comparing current price levels to pre-COVID levels helps to smooth out the ups and downs. Since February 2020, CPI and Core CPI are up 3.6% and 3.1% (annualized), respectively. Those levels are above the Fed’s 2% target and could persist longer than expected.
Cost pressures could be mounting. Government data is one thing, but how inflation impacts business operations is another. Last week, companies across different industries issued profit warnings due to supply-chain disruptions and rising commodity prices. These included Consumer Staples company Brown Forman (maker of Jack Daniels), and Materials companies PPG and 3M Company. The CEO of APM Terminals, a division of Danish shipping firm Maersk, identified logistical issues related to crowded ports, a shortage of transportation resources, and storage limitations, according to ZeroHedge. Something to monitor during the upcoming earnings season.
Inflation Debate: An intelligent debate is unfolding inside the Jefferies strategy team.
David Zervos, Chief Market Strategist, believes housing prices are rising for “structural” supply/demand reasons. Looking several quarters ahead, he does not see this having a lasting effect on inflation. “Don't fall prey to the rhetoric that strength in home prices will drive inflation further.”
Aneta Markowska, US Economist, believes inflation will continue marching higher through Q1/2022. She sees a goods shortage (from supply-chain disruptions) colliding with increased seasonal demand and cost pressures in housing/rents. “Is the inflation scare really over? We think it's premature to expect a full normalization of inflationary pressures… We see a good chance that Core CPI touches 5% in Feb, before base effects push it into reverse.”
Both sides are well represented and both could be correct depending on time horizons.
As JPMorgan noted, the downside surprise in CPI for August was driven by re-opening sectors (rental cars, airfares, lodging, restaurants), which suffered due to rising COVID cases. JPM: “Away from those [re-opening] components, however, the month-on-month readings if anything increased, suggesting a conclusion that this week’s US CPI release signals a dissipation of inflation risks is somewhat premature.”
US GDP Growth: Despite some recent metrics slowing, economic growth should remain above-trend in 2022.
US GDP for Q1 and Q2 was 6.3% and 6.6%, respectively. For Q3, the Atlanta Fed estimates a slump to 3.6%. For 2021, GDP should reach at least 5-7%.
Jefferies estimates real GDP growth of 5.4% in 2022. Cornerstone Macro is forecasting 4.0%. Since the 2008, US GDP has averaged 2.1% per quarter.
Keep in mind, the above-trend GDP numbers are no longer a matter of making up lost ground. US GDP has fully recovered and surpassed pre-COVID levels.
“ …the prospects are good for this expansion to continue delivering above-trend growth and push underlying inflation higher…” JPMorgan
JPMorgan: “With balance sheets healthy, slack limited, and policy stances remaining growth-oriented, the prospects are good for this expansion to continue delivering above-trend growth and push underlying inflation higher… Despite concerns about the recent downshift in momentum, we remain confident that strong growth lies ahead.”
Monetary/Fiscal Policy
The FOMC meets this week. The Fed is widely expected to join the ECB and announce a “tapering” plan for Q4. In the BofA Securities Fund Manager Survey, 84% expect a tapering event by year-end. An upbeat message on the US economy from Fed Chair Powell this Wednesday could soften the blow.
Each month, the Fed’s quantitative easing program is purchasing $120 billion of debt securities (mostly USTs and mortgage securities). This helps to keep interest rates low along the yield curve. Tapering means the Fed will be scaling back its purchases.
Job gains have been steady, if not robust; core inflation might have peaked, but remains persistently elevated. It probably makes sense to move forward on tapering and markets seem ready.
After the COVID shutdown, the Fed pledged to keep “emergency” stimulus in place until the US economy made “substantial progress” on employment and inflation. Job gains have been steady, if not robust; core inflation might have peaked, but remains persistently elevated and above the Fed’s 2% target. It probably makes sense to move forward on tapering and markets seem ready. In fact, declines for certain long duration growth equities last week could be a signal that markets anticipate some movement from the Fed.
For now, the Fed will keep short-term rates near zero. Based on pricing in futures markets, no rate hikes are expected before December 2022.
Fixed Income, Rates & Credit
Long-duration high-quality bonds squeezed out a positive return last week, but duration has been a source of negative attribution this year with rates moving higher. Only high-yield bonds/loans have produced measurable gains for 2021.

JPMorgan sees unfavorable risk/reward in high-quality rate-sensitive bonds. Assuming continued above-trend GDP growth, JPM sees rates moving higher with a steeper yield curve: “Despite the sell-off [this year], US yields are still rich relative to fair value and remain at levels that would be consistent with flattish growth over the coming year. While we see some downside risks to near-term growth, [jobless] claims show little impact from the delta variant and there are signs that the [COVID] wave is peaking…”
“US yields are still rich relative to fair value and remain at levels that would be consistent with flattish growth over the coming year.” JPMorgan
In terms of specific positioning, JPM is short the UST 10-year note, betting on higher rates. In a curve-steepened trade, JPM is long 3-year USTs and short 7-year USTs.
Shorting Credit as a Hedge/Diversifier: Coincidentally, Morgan Stanley favors short positions in corporate credit — both IG and HY. Besides potential for rising rates, MS sees potential for wider credit spreads if growth encounters unexpected struggles.
Meanwhile, volatility levels on investment-grade corporates have been grinding lower. Thus, put options on IG credit are relatively less expensive, so this might be one way of expressing the diversifier trades mentioned above. As The Market Ear says repeatedly, “Buy protection when you can, not when you need it...”
As an aside, the use of short positions probably makes the most sense for portfolios that operate with leverage — or gross exposures above 100%. Otherwise, return profiles might be too muted. This is a topic to be explored in future posts.
Credit spreads remain tight. To reiterate, corporate bonds seem to offer limited upside return potential.
IG spreads are +90 — below the 10-year median of +134.
HY spreads are +306 — below the median of +443 and average of +478.

Sources: CCM, fred.stlouisfed.org

With spreads tighter than average, risk/return looks sub-par for long-only corporate credit, but Bespoke sees spreads as positive indicator for equities and the growth outlook: “There isn’t a huge amount of risk premium left in corporate spreads... That said, the rally in corporate bonds is a good sign that risk appetite is firm and that financial conditions remain easy, despite the fact that growth has at least temporarily decelerated…”
“… the rally in corporate bonds is a good sign that risk appetite is firm and that financial conditions remain easy, despite the fact that growth has at least temporarily decelerated…” Bespoke Investment Group
Corporate defaults continue to grind lower. With above-trend economic growth, credit fundamentals are mostly improving, although that varies by industry and company-specific factors.
For US bonds and loans, default rates dropped to 1.1% in August.
In Europe, the trailing 12-month default rate for corporate bonds is 2.1%.
Corporate credit fundamentals look strong. Despite high debt levels on balance sheets, debt service (interest cost) is low.
US/Global Equities
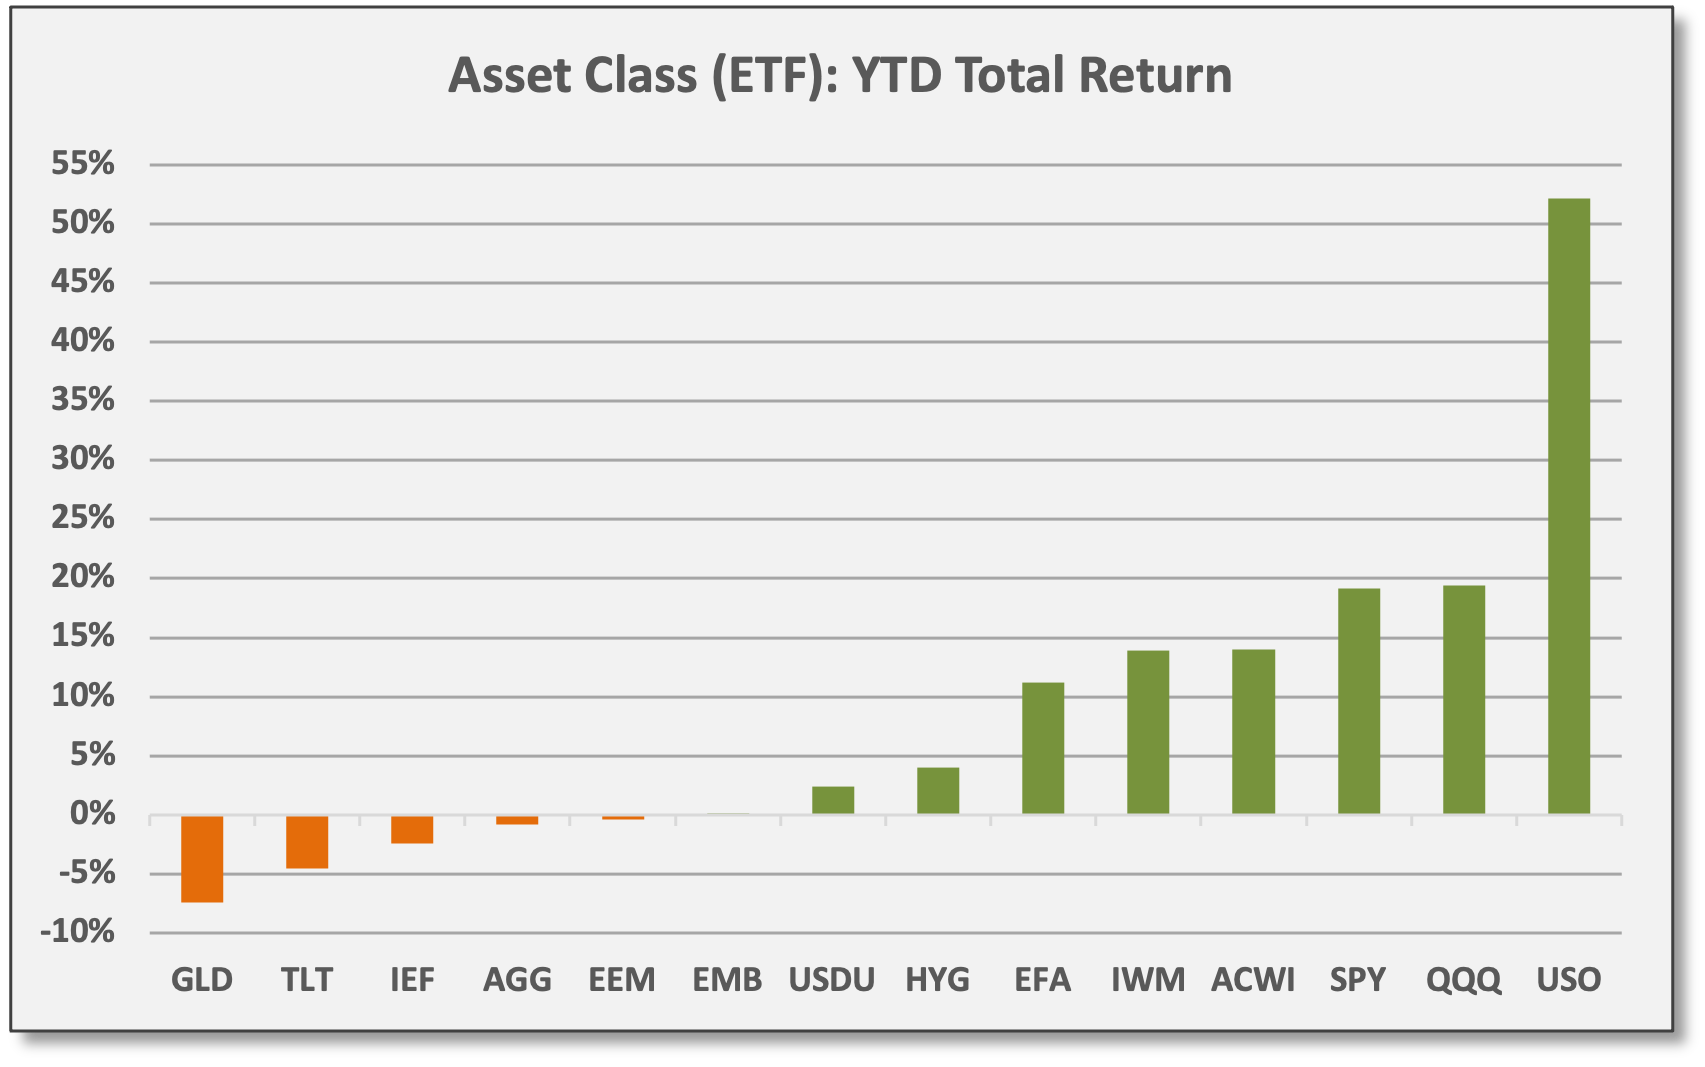
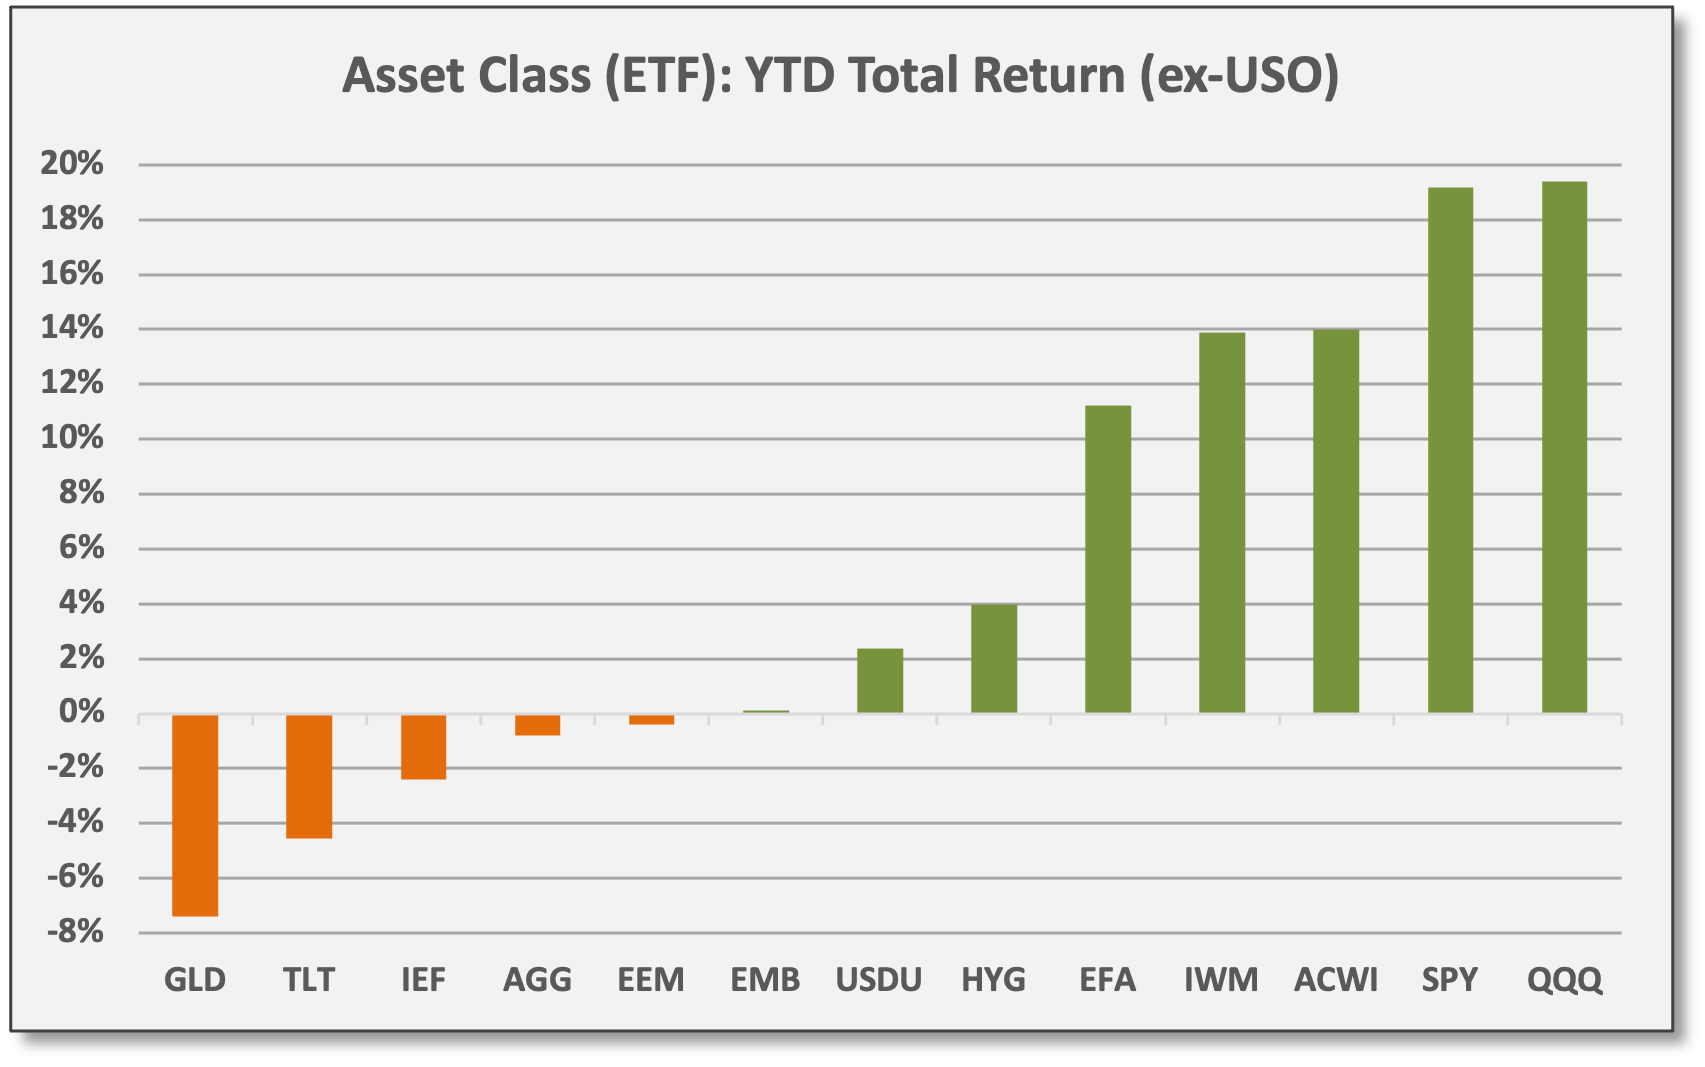
For 2021, the S&P 500 (SPY) is up 19.2%. Energy is the top performing sector as a pure-play on the global re-opening/recovery. Financials (Banks) have performed well as a more diversified value/cyclicals trade, outperforming in Q1 but lagging a bit since.

For Q3, SPY is delivering a solid gain of 3.1%. Defensive/yield-oriented and “safe growth” equities are outperforming. Pure-play value/cyclicals are down for Q3 with outright losses for Energy, Industrials, and Materials. Financials have bucked that trend as a “safe value” industry with banks benefit from rising rates.

Real Estate (XLRE) is an interesting segment this year. It’s performed well during both risk-on and risk-off periods. XLRE delivered strong gains in Q1 alongside Financials and other value/cyclicals, but XLRE has also performed well with more defensive/yield-oriented assets in Q3 when value/cyclicals have struggled.2
Top YTD attribution sources for XLRE include:
American Tower (AMT): Wireless and broadcast communications infrastructure. AMT is the top holding in XLRE with a 14% weighting. AMT is up 32% YTD, contributing 4.2% of positive attribution.
Prologis (PLD): Warehouse facilities that support global supply chains. A 10% weighting. PLD is up 33% YTD, adding 3.1% of positive attribution.
Equinix (EQIX): Internet connection and data centers. An 8% weighting. EQIX is up 24% YTD, adding 2.0% of positive attribution.
Crown Castle (CCI): Communications infrastructure. An 8% weighting. CCI is up 21% YTD, adding 1.9% of positive attribution.
In fact, XLRE offers a rather diversified portfolio based on its underlying industry exposures. Besides those mentioned above, XLRE provides exposure to apartment communities, commercial real estate services, and timber development.
Drawdown concerns have emerged. From what we can gather, the fears are not based so much on fundamentals, but simply on the fact that the S&P 500 has not experienced a sharp decline this year.
Drawdowns measure the percent decline from peak to trough. Drawdown durations vary. In the past, drawdowns lasted over extended periods, especially when economic/corporate fundamentals have deteriorated since it takes time to recover.
Drawdowns reflect the inherent volatility in equity markets and occur even during up years.
Liquidity-driven drawdowns tend to be more violent, but shorter-lived. When stressed investors are forced sellers and/or when leveraged funds de-risk portfolios, losses can be abrupt, but asset prices tend to rebound quickly as liquidity conditions normalize.
For the S&P 500, the largest drawdown so far in 2021 has been -4%.
Median drawdown since 1988 has been -10% with an average of -14%.

Sources: CCM, Strategas Research Partners For the Russell 2000, the largest drawdown this year has been -10%.
Median drawdown since 1988 has been -14% with an average of -18%.

Sources, CCM, Strategas Research Partners


Clearly, drawdowns for the S&P 500 have been much less severe than usual this year. For the Russell 2000, this year is not so unusual.
Bear in mind, drawdowns reflect the inherent volatility in equity markets and occur even during up years as illustrated. Over the last 34 calendar years (including 2021), the median returns for the S&P 500 and the Russell 2000 were 13% and 15%, respectively.
Commodities & Real Assets
Commodities performance in 2021 has followed familiar themes. Growth-sensitive Energy and Base Metals have gained, but defensive Precious Metals have declined.
In Energy, WTI crude (USO) is up 52.1% YTD.
In Base Metals, Copper (JJC) has gained 20.2%.
In Precious Metals, Gold (GLD) is down -7.4% YTD.

Sources: CCM, Morningstar

As mentioned above (see US/Global Equities), REITs and other publicly-traded Real Estate (XLRE) are exposed to various underlying industries, including communications infrastructure, residential/commercial real estate, retail/industrial sectors, and natural resources. For better or worse, exchange-traded REITs also capture equity beta (and related price volatility) to which private real assets are not subject. An important distinction to explore further in future posts. Equity beta could be a positive or negative influence, depending on market conditions. XLRE is up 30.1% YTD.
JPMorgan favors certain commodities for inflationary growth potential and structural reasons. “We maintain a large commodity OW, focused on Energy, as a hedge for inflation and given a supply/demand imbalance driven by recovery from the pandemic and chronic underinvestment in supply…”
Volatility, Flows/Positioning & Sentiment
Investor sentiment has rapidly deteriorated in recent weeks. Bespoke: “The S&P 500 is down under 2% from its record closing high on September 2nd and has been hovering right above its 50-DMA this week. While neither of those may sound dramatic, it seems to have sent shivers down the spines of individual investors…”
AAII Bullish Sentiment dropped to 22.4% last week, the lowest reading since July 2020 which falls in the bottom 5% of all readings since the survey was established in 1987. The average Bullish Sentiment is 38.0.
Bearish Sentiment jumped to 39.3%, the highest reading since last October. The average Bearish Sentiment is 30.5.
The Bull-Bear spread is now negative at -16.9%, the lowest reading since August 2019.
How does the S&P 500 perform when bullish sentiment is so muted? S&P 500 returns are more consistently positive with better than average gains over subsequent periods after similar AAII readings, according to Bespoke.

When AAII Bullish Sentiment scored between 20-25 (114 occurrences), returns going forward averaged 5.2%, 8.8%, and 15.6% over the subsequent three months, six months, and one year, respectively. Correspondingly, returns were positive 84%, 83%, and 90% of the time.
Keep in mind, investor sentiment can change quickly.
Observations from Goldman Sachs:
Inflows to global equity fund flows remain firm, but overweights to equities across investor segments are mostly due to price appreciation.
Low realized volatility has allowed systematic strategies — risk-parity funds and trend-following CTAs — to add to equities. However, if vol levels shoot higher in an equity sell-off, de-risking from systematic funds could amplify a move lower.
Meanwhile, survey-based sentiment measures (like AAII) “look more cautious.”
Despite an overweight to equities, investors are defensively positioned. “Below the market surface, we think investors have moved up in quality and out of cyclicals and value. As a result, positioning within equity looks fairly defensive. With a less supportive macro backdrop past peak growth, we would expect continued moderation in sentiment… That said, we think that low yields and TINA (There Is No Alterative) can still drive further equity inflows and, given high cash balances, corporates can further support equity demand from here. Within equities, we think investors are likely to maintain some of their growth/defensive positions, but there is scope for some pro-cyclical rotation into year-end.”
BofA Securities Fund Manager Survey (FMS): Latest survey results from 9/3 to 9/9 covered 258 panelists representing $839 billion in AUM.
An overwhelming majority of panelists expect “above-trend growth and above-trend inflation” as opposed to stagflation, but the former view has moderated.
GDP/profit expectations dropped to the lowest levels since April/May ‘20.
Incongruous: FMS expects profit margins to worsen (presumably on higher input costs), but separately, panelists expect inflation to inflect lower. By 69% to 28%, panelists say inflation is transitory as opposed to permanent. Perhaps rising wage costs are not viewed as inflation?
FMS panelists are still taking “higher than normal risk” via overweighted equity allocations, but the OW is down from peak levels.
Overweights: OW value/cyclicals, including Financials/Banks, Commodities, Industrials. Note: Banks are essentially “safe value” and benefit from rising rates and a steeper yield curve, but they are not aggressive “re-opening” plays.
Underweights: UW growth/defensives like Technology equities and Bonds, but managers have been adding to defensive Healthcare and Staples.
In early 2021, FMS expected small-cap/value/junk to outperform large-cap/growth/quality, but that view has completely reversed. Note: Positive relative performance for the value/cyclicals trade peaked in February ‘21 just as FMS sentiment towards this group was peaking. It seems there is room to add to this theme should fundamentals dictate.
Most Crowded Trade: (1) long Technology, (2) long ESG, and (3) short China.
84% expect the Fed to begin the tapering process by year-end. On rate hikes, FMS panelists see Fed hikes beginning in February ‘23, whereas Fed Funds futures are pricing the first hike in December ‘22.
BofA: “Growth expectations are saying equity allocations should fall, but risk taking is telling the story that investors are ignoring the macro.”
Alternative Assets/Strategies
Hedge fund managers continue to migrate into private investments to boost return potential — primarily venture capital or later-stage growth equity. Given their LP structures — with one-year lock-ups, quarterly redemptions, and other liquidity restrictions — it makes sense to take advantage of opportunities in illiquid assets.
Essentially, hedge funds are competing with Silicon Valley for private companies. For years, Tiger Global Management has been an active investor in pre-IPO technology firms. As of June, Tiger had invested $10.5 billion this year in ~90 private companies, according to Crunchbase News. That beats the $4.1 billion deployed by venture specialist Sequoia Capital. Now, Tiger Global is poised for gains from two upcoming IPOs — Toast and Freshworks — according to Institutional Investor.
According to Felix Salmon in Axios, Tiger takes an aggressive approach. “Tiger has a well-deserved reputation in the industry for writing bigger checks, more quickly, at higher valuations, with fewer strings attached, than any big VC.”
Other hedge funds are following a similar strategy. Coatue Management has invested $6.9 billion this year. Third Point has benefited from two IPOs this year: Upstart (UPST) and SentinelOne (S). Third Point is the largest shareholder in UPST, which is up 929% since going public last December.
What Others Are Saying
Mike Sarraille, Retired US Navy SEAL, 9/14/21: “We learn more from failures and hardships than we do from the good or easy times.” Excerpted from Truth+Tribe podcast, After Action Review (Part 1).
Marko Kolanovic, JPMorgan, Global Markets Strategy, 9/15/21: “We retain a pro-risk allocation on strong global growth as the world continues to recover from the pandemic, accommodative policy, and continuing earnings surprises. Reopening of the global economy was delayed by the delta variant spread, but the delta wave is likely receding in the US and globally, and the pandemic recovery should restart… As delta subsides, and inflation persists due to supply frictions from reopening and accommodative monetary policy, we expect the reflation/reopening trade to resume its outperformance and believe that bond yields and cyclicals likely bottomed early last month. We therefore keep large OWs in equities (tilted towards value and cyclical segments) and commodities, funded by an UW in bonds. Regionally, we implement our preference for cyclicals/value via an OW in EM, Japan and Europe vs. the US, and we increase our OWs in EM and Japan this month given their recent underperformance and an anticipated boost in Japan from a political regime change.”
Morgan Stanley, Cross-Asset Playbook, 9/17/21: “September-October sees heavy supply, poor seasonality, weak but possibly bottoming growth, ‘all or nothing’ US fiscal policy and a potentially hawkish FOMC all collide. While the cycle ultimately has further to go, this is a challenging window. The events put markets between a rock (growth disappoints, earnings revisions fall, US fiscal fails) and hard place (data rebound, hawkish FOMC, rates rise). With these risks highest in the US and EM, we recently downgraded US equities to UW, and remain UW bonds. Policy divergence is a key theme, supporting ex-US DM equities and USD. Our trades reflect light overall exposure (equity beta 0.1x) and a bias towards equity value, short rate duration, long USD, energy over metals and credit default risk over spread risk. For hedges, we like put spreads in both US equities and credit, and puts on gold, which we think could underperform on more hawkish surprises (they did in 2013-14).”
Bespoke, The Closer, 9/14/21: “Another tailwind for economic activity and financial markets… is the weakness of the US dollar. The broad greenback has stabilized over the last several months but is still down over the past year. Dollar declines stimulate exports and are a big positive for commodities and risk-taking more generally.” Note: If US interest rates start to move higher, especially real rates, expect the US dollar to reverse course and get stronger. For now, real rates are firmly negative.
Christopher Wood, Jefferies, 9/12/21: “GREED & fear continues to believe that the five-year/five-year forward inflation expectation rate is the key variable for equity fund managers to monitor, in terms of the timing of a market-moving tapering scare, and for now it remains well below what GREED & fear regards as the 2.5% stress level… GREED & fear continues to recommend for equity portfolios a barbell strategy of owning both growth and value. Ultimately, the relative merits of both will be determined by the outcome of the current debate on whether the pickup in inflation is transitory or not. Still, even if it is not transitory, growth stocks will not be as impacted as negatively as they might otherwise be, at least initially, if the Federal Reserve and other G7 central banks favor policies of financial repression over monetary tightening in line with GREED & fear’s base case.”
Ikarian Healthcare Master Fund, 9/14/21: Ikarian is a long/short equity fund and healthcare/biotech specialist. Ikarian has an annualized return of 19.4% since inception in 2016 with a beta of 0.2 to the S&P 500 Index. "Biotech is having one of its worst years in recent history... While there will be murmurs about a capricious FDA and drug pricing rhetoric weighing on the sector, the real elephant in the room has been the lack of liquidity… Tangibly speaking, it’s our belief that private investment mark-ups and IPO crossovers worked great to pad returns in 2019-20, and have matured into largely illiquid public equities in 2021. Therein lies the rub. We believe many of these investments were poorly due-diligenced, and have either disappointed fundamentally or are too early to exist as public entities with catalysts that are years out. For biotech funds that have relatively high beta to poorly performing sector indices, there has been and is likely to be increased pressure to succumb to the current de-grossing movement and unload the aforementioned low-conviction holdings. Given the lack of liquidity pervasive in such names, it is not uncommon to now see these names down 60-70% from the highs, with violent single-day down-moves on apparently no news... The sector’s already sub-par returns since the beginning of 2016 would have been even poorer if not held up by a handful of names, most notably the COVID-19 vaccine names which in our view are detached from fundamentals and driven by extraneous factors... ‘Attack.’ That remains the operative word as far as the Ikarian strategy is concerned. We believe the ‘blood in the streets’ sector sentiment has created a pocket of arbitrage... several dislocated names where the equity alone offers up a significant potential payout versus the typical upside…”
This material is for informational and educational purposes only. All data has been compiled from sources believed to be reliable, but there is no guarantee of its complete accuracy.
Animal Farm was published in 1945. 1984 was published in 1949
XLRE shows positive correlation to high-quality bonds according to Venn factor analytics.