


Guide to The Weekly Briefing
August 29, 2021


Greetings from Substack
After a nine-month hiatus, we are back to publishing our weekly research briefing.
Some readers will recall we previously dubbed our publication the CMO Weekly, but this created endless confusion. Our “CMO” referred to capital markets observations, an apt description of our content (we thought), but many readers presumed we meant collateralized mortgage obligations. With our content relaunch via Substack, we decided to change the title. Ironically, we see value in mortgage-related structured credit strategies. In fact, we traded mortgage securities early in our career at a Chicago-based institutional fixed income firm, but we digress…
Since 2008, we have been publishing some form of the Weekly Briefing, distributing to clients, colleagues, and peers across our network. Our content parallels the prior work we performed inside investment advisory firms, where we presented market outlooks to other team members during weekly investment committee meetings (usually on Monday mornings).
Essentially, the Weekly Briefing documents the work we are already doing. It’s a matter of sharing it with those in our network. The global capital markets present a never-ending stream of twists and turns and evolving challenges, so researching the markets is an exercise in intellectual stimulation. We enjoy the process. To a degree, we view ourselves as investigative journalists, searching for truth and relative value.
In this regard, Substack is a good platform for us.
Substack offers an efficient no-frills infrastructure, allowing us to focus on content. Specifically, our aim is to deliver recurring insights, perspective, and talking points. Our goal has always been to keep readers “informed and equipped” for better decision making and/or more effective client engagements.
Our role is to survey a diverse set of research sources, study the data for ourselves, search for anomalies or under-appreciated factors obscured by popular narratives, engage specialist practitioners directly to gather their views, contemplate the findings… and relay our discoveries to others… Our aim is to provide context and perspective in a concise format…
Other research sources can provide countless data and detailed analysis. That is not our mission, per se. Instead, our aim is to provide context and perspective in a concise format, often alerting readers to the important analyses of others. Our role is to survey a diverse set of research sources, study the data for ourselves, search for anomalies or under-appreciated factors obscured by popular narratives, engage specialist practitioners directly to gather their views, contemplate the findings, and subsequently to summarize and relay our discoveries to others who need to stay current.
Guide to the Weekly Briefing
The Weekly Briefing has structure, but we aim to be flexible. Our postings will target relevant data and trends in the following areas:
Performance Observations
Economic Data & Trends
Monetary/Fiscal Policy
Fixed Income, Rates & Credit
US/Global Equities
Commodities & Real Assets
Flows/Positioning, Sentiment & Volatility
Alternative Assets/Strategies
Portfolio Construction & Trade Ideas
What Others Are Saying
Our approach is to highlight what’s driving asset prices and what’s being overlooked. It’s an imperfect process, but hopefully, on balance, we bring useful insights.
Go where the research leads and avoid being dogmatic.
As we go about our work, we are guided by our ongoing philosophy: “Go where the research leads and avoid being dogmatic.” Essentially, this means we strive to be professionals who are continuously learning and adapting.
Performance Observations
The recovery trade was in vogue last week. The full spectrum of value/cyclicals outperformed, while defensive and rate-sensitive assets lagged.
Energy commodities and US/global equities gained last week while high-quality bonds declined.
It was a nice bounce for value/cyclicals which had paused amid rising COVID cases in recent months.
Across asset classes, US Oil (WTI crude) rallied 10.9%, Russell 2000 small-cap equities (IWM) gained 5.1%, and Emerging Markets (EEM) gained 4.2%. Long-duration and intermediate USTs were down -0.7% and -0.3%, respectively.
Across US equity sectors, the same pattern emerged. Energy (XLE) jumped 7.5%, Financials (XLF) 3.5%, and Materials (XLB) 2.6%. Utilities, Staples, and Healthcare declined -2.0%, -1.4%, and -1.1%, respectively.
So far in 2021, value/cyclicals have outperformed due to the growth recovery and rising interest rates. Gains have been supported by strong fundamentals with US GDP up 6.3% and 6.6% in Q1 and Q2, respectively. Meanwhile, profits for the S&P 500 are pacing towards a full-year gain of 43% (2021 EPS versus 2020 EPS).
Aside from WTI crude, which has soared 40% this year, US equities have been the runaway leaders so far as the recovery pace has been slow in non-US markets.


Over the last 18 months, performance leadership has toggled back and forth between growth and value factors based on COVID-related events.1 As broad (and imperfect) proxies for the two investment styles, we offer a simple illustration using index ETFs from iShares: Russell 1000 Value (IWD) and Russell 1000 Growth (IWF).
Initially, secular growth businesses outperformed during the shutdown, while industries with greater sensitivity to the economic cycle struggled. This was true for equity prices as well as corporate fundamentals (sales, profits). Banks were hit hard by falling rates, a flatter yield curve, and the threat of mounting credit losses. This period lasted roughly six months from the onset of COVID. From 2/28/20 to 9/1/20, Growth (IWF) outperformed Value (IWD) by 36%.
In September 2020, the reopening theme gained traction. Value/cyclicals took leadership over the next six months. Meanwhile, the underperformance of long-duration assets (including secular growth equities) was amplified in February as valuations corrected sharply in response to an inflation scare that caused a jump in interest rates. Value (IWD) outperformed by 20% from 9/1/20 to 3/8/21.
Since early March of this year, growth has reasserted itself while the recovery trade moved sideways (until last week). This has occurred as emerging COVID variants raise concerns about a return to normal. Interest rates have moved lower due to growth concerns and some moderation to inflation data. During this phase, secular growth equities have demonstrated their “defensive” properties as their revenues are so persistent — regardless of the underlying macro environment. Since 3/8, Growth has outperformed by 15%.
Over the full period, Growth (IWF) has a cumulative total return of 73.8% (44.7% annualized). Value (IWD) has a cumulative total return of 39.6% (25.0% annualized). Either way, COVID-related losses are a distant memory.

Of course growth and value are more diverse than the proxies referenced above. Last week’s performance showed the more pronounced returns from pure-plays. There are multiple sub-segments within the two investment styles.
For instance, the Russell 1000 Value includes businesses defined as value/cyclicals, slow-growth defensives, income-oriented yield plays, and stressed/failing companies. All these can behave in different ways in response to different events and factors.
Similarly, the Russell 1000 Growth includes defensive/secular growth (i.e., AAPL, MSFT) as well as more aggressively-valued speculative innovators (i.e., TSLA). Even when sub-segments perform in the same direction, magnitudes can be vastly different.
Sectors are regularly used as proxies for growth and value, as we referenced above. However, the sectors are limited for such purposes; their messaging is made in broad brush strokes. Actually, the 11 GICS economics sectors are segmented into 124 industry groups by S&P. Many industries within the same sector behave differently. In Consumer Discretionary, Internet & Direct Marketing Retail (AMZN) is quite different from Homebuilding (DHI) and Automotive Manufacturers (F).
Size (market capitalization) and regional factors (US or Developed/Emerging/Frontier Markets) also behave with different style tilts depending on sector/industry exposures and other factor betas including quality, momentum, volatility, and liquidity.
Thus, detailed performance attribution is more nuanced and requires a multi-factor approach — something we will explore further in coming reports.
Economic Data & Trends
According to Car and Driver, the 2021 Mercedes-AMG C63-S delivers 503 hp and a top speed of 180 mph. In testing, the sporty beast accelerated from 0-60 mph in 3.7 seconds. Compared to the relatively calm sensation we might feel when cruising at a steady velocity of 120 mph, the g-force effect of accelerating from 0-60 would create a more exhilarating experience. (The relative sensation would be even more pronounced if we were decelerating from 120 mph to 100.)
In other words, rate of change > level.
So is the case with economic growth: Levels and growth rates both matter, but growth rates usually have a bigger impact on sentiment. In short, investors love positive momentum and hate negative momentum. This makes sense as growth rates signal where we are going and, more importantly, how fast we might get there. Unfortunately, there is a normal ebb and flow to economic indicators, so data must be analyzed carefully.
Investors love positive momentum and hate negative momentum.
Our tedious illustration probably describes the current environment for investors.
Recently, the Citi Economic Surprise Index turned negative, so a majority of the latest US indicators are falling short of expectations. The same is true across Europe.
The popular narrative attributes any Q3 slowdown to threats — real and perceived —from emerging COVID variants. Cases have increased in recent weeks and certainly this is impacting spending behavior and sentiment. The Consumer Sentiment Index from the University of Michigan dropped to 70.3 in August, a sharp decline from July and its lowest reading in over a decade. According to David Zervos, Jefferies’ Chief Market Strategist, the Michigan survey validates his view that consumers remain cautious after so many turbulent events in recent years. This should keep the Fed in a supportive mindset per Zervos.
At the same time, some of the slowdown/deceleration should be expected as part of the normalizing process after a robust recovery.
So, it might feel like growth is slowing to troubling levels, but we don’t really see that in the data. Absolute levels for many indicators remain firm in most cases and growth rates are continuing at above-trend levels.
Across key metrics, growth has fully recovered to levels above pre-COVID levels:
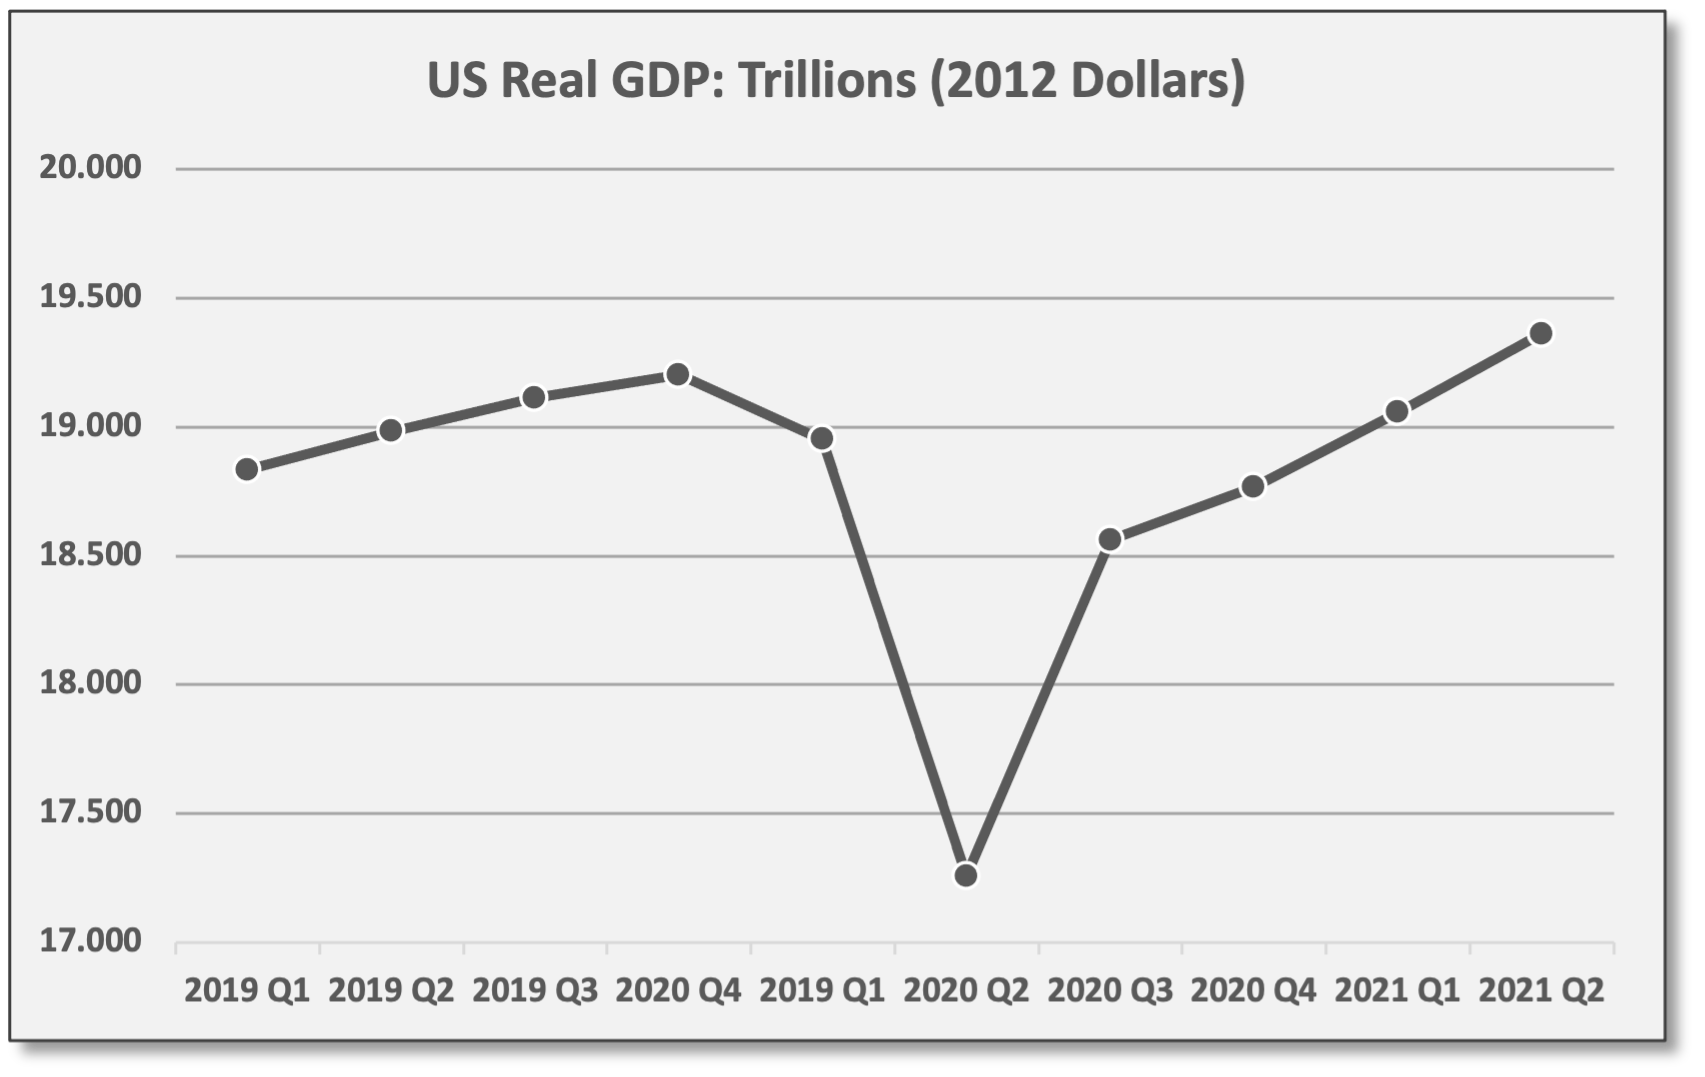
US GDP growth eclipsed pre-COVID levels in Q2 of this year.

Sources: Coffee & Capital Markets, fred.stlouisfed.org US GDP growth for Q2 stands at 6.6% based on the latest revision as of 8/26/21. For Q3, the Atlanta Fed GDPNow is estimating GDP of 5.1%. Technically, this would mark a modest deceleration, but the prevailing growth pace remains well above the longer-term trend. Since the Global Financial Crisis in 2008, US GDP has averaged 2.1% per quarter.2 Meanwhile, Jefferies is forecasting an above-trend 5.4% GDP growth in 2022 for the US.

Sources: Coffee & Capital Markets, fred.stlouisfed.org US Retail Sales dropped -1.1% in July, but monthly data is volatile. Over the last 12 months, retail sales are up 15.8%. More notably, sales are now 17.2% above the pre-COVID peak in January 2020. Consumer spending looks sustainable due to a healthy personal savings rate (currently 10%), rising wages (up 4.0% over the last 12 months), and a record low Household Financial Obligations ratio dating back to 1980.3 Meanwhile, industrial/manufacturing inventories sit hear record lows, further supporting sustainable GDP growth.

Sources: Coffee & Capital Markets, fred.stlouisfed.org


We see similar patterns for other indicators: Solid growth levels and continued expansion, but at a slower rate.
For instance, IHS Market released flash PMI data last week. An early look into August trends. Across global markets, services activity was negatively impacted by COVID concerns, but manufacturing activity showed better resilience. (Readings above 50 signal economic expansion.)
US Flash PMI Composite dropped to 55.4, an eight-month low, but still reflects a strong expansion. As it relates to equities and profit growth, a score above 54 leads to continued positive earnings revisions per JPMorgan. A year ago, early in the post-shutdown recovery, the US Composite PMI was 54.7.
Eurozone Flash PMI Composite dropped from a 15-year high to 59.5 in August, but remains at the second-best expansion level since 2006.
UK Flash PMI Composite declined to 55.3 as growth momentum slows.
UK Japan PMI Composite declined to 45.9 with mixed data. Manufacturing showed a reasonably healthy 52.4, but Services continue to struggle at 43.5.
Unquestionably, we are seeing downgrades to Q3 GDP forecasts, but this could be nothing more than activity delayed to Q4 or early 2022. Regardless, projected growth levels for Q3 are still tracking above pre-COVID trends.
Monetary/Fiscal Policy
On US monetary policy, nothing much has changed.
The Fed’s asset purchase program – quantitative easing or “QE” – will continue for now. On a monthly basis, the Fed has been purchasing $80 billion in USTs and $40 billion in high-quality mortgage securities.
Several Fed bank presidents have been urging an end to asset purchases, but steps to “taper” — or reduce — the program are on hold for now. That was the clear and reassuring message from Fed Chair Jerome Powell last Friday.
Tapering could be engaged by year-end, provided US economic growth continues along with steady improvement in employment. Tapering is more likely to be triggered as inflation metrics persist or trend higher.
Beyond tapering, markets are more concerned about a larger Fed Policy shift, specifically higher interest rates. Tapering is viewed as a precursor to rate hikes.
Originally, QE was established as a temporary/emergency program to bolster the US financial system amid the Global Financial Crisis. QE adds to the US money supply, but its overall impact is continuously debated. Undoubtedly, asset purchases have supported economic activity, but the real impact depends on factors such as the “velocity” of money.4 If consumers/corporations are not borrowing/spending, then the added money supply just sits in the banking system in the form of excess reserves.
Presumably, Fed-driven liquidity has induced investment activity and risk-taking, adding to asset inflation. For this reason, financial markets tend to sell-off whenever tapering rhetoric gains momentum...
Over the last 10-12 years, QE has helped the US housing industry to recover and fortified the capital position of US banks. This has benefited US consumers (homeowners) and strengthened the entire US financial system. Presumably, Fed-driven liquidity has induced investment activity and risk-taking, adding to asset inflation. For this reason, financial markets tend to sell-off whenever tapering rhetoric gains momentum — and vice versa. Meanwhile, inflation for goods/services has been fairly muted until recently — at least based on CPI, PCE and other core inflation metrics used by policymakers.
On interest rates, no policy changes are imminent.
Currently, the Fed Funds target range is 0.00% to 0.25%. Based on CME futures markets, traders do not see any rate hikes before December 2022.
Beyond that, markets are pricing approximately three hikes over the ensuing two years, lifting Fed Funds by ~80 basis points by December 2024.
Bespoke: “Actual hikes require a ‘different and substantially more stringent test’ suggesting that rate hikes are not just around the corner and that easy monetary policy will remain for some time to come.”
Bottom Line: Tapering matters, but investors might be overly preoccupied. Asset purchases are a tactical strategy, just like setting interest rates, but the overall Fed Policy remains extraordinarily accommodative. Moreover, the Fed has repeatedly demonstrated its willingness to intervene with additional support whenever trouble emerges.
On fiscal policy, Democrats in the House passed an ambitious $3.5 trillion budget plan last week. From what we can assess, the bill could face stiff opposition from moderate Democrats in the Senate. Previously, the Senate passed a bipartisan $1.2 trillion spending bill with an emphasis on traditional infrastructure. Federal spending programs are rather arcane; the bill increases spending budgets, but apparently only adds an estimated $500 billion in direct spending over a 10-year horizon, according to the CBO. Spending is partially funded from an estimated $50 billion in new revenues.

To put the net-new spending in perspective, the Senate plan would add less than 0.24% to federal outlays as a percentage of US GDP (on an annual basis). It would add less than 0.22% to federal deficits as a percentage of US GDP (on an annual basis).
Fixed Income, Rates & Credit
The main headlines related to the fixed income markets last week surrounded the Fed’s Jackson Hole gathering — actually a virtual event this year. Takeaways are reviewed above under Monetary/Fiscal Policy.
Other observations:
Interest rates inched higher last week and the UST 10-year note closed at 1.31%.
UST 10-year TIPS yield -1.08%, which implies a break-even inflation rate of 2.39% over the next 10 years. Markets do not see a severe sustained inflation.
Across global markets, 10-year government bonds in the UK, Germany, and Japan yield 0.58%, -0.43%, and 0.02%, respectively. Given the wide range in relative yields, any evaluation of US rates should go beyond US fundamentals. Indeed, Fed Policy tends to consider foreign rates as yield differentials have bearing on the US dollar and currency markets. Keep this in mind.
Corporate credit spreads tightened last week. ICE BofA investment-grade bonds trade at a spread of +93 basis points. ICE BofA high-yield spreads are +320.
US Aggregate Bond (AGG) was down five basis points last week, but HY Corporate Bonds (JNK) gained 0.8%.
US/Global Equities
Q2 earnings season has ended. Results beat expectations.
For the S&P 500, Q2 reported profits were 91% higher versus a year ago. For 2021, full-year profits could show a gain of at least 43% compared to 2020.
Based on data compiled by Bespoke, Raymond James, and JPMorgan:
80% of US companies beat REVENUE estimates versus an average of 56%.
76% of US companies beat PROFIT estimates versus an average of 59%.
S&P 500 companies beat EPS estimates by 16% in aggregate, well above the average beat margin of 5%.
Compared to a year ago, corporate profits benefited from base effects (easy comparisons). For the S&P 500, Q2 reported profits were 91% higher versus a year ago. For the STOXX Europe 600, profits were 71% higher. For Japan’s TOPIX, profits were 52% higher. Revenues for the S&P 500, STOXX 600, and the TOPIX were up 27%, 28%, and 18%, respectively.
During the recent earnings season, 21% of reporting companies raised EPS guidance for the balance of the year. Only 5% lowered guidance. In addition to positive signaling from corporate management teams, analyst revisions continue to show positive trends as well.
With two quarters behind us and the Q3 earnings season set to begin in early October, we have a good read on 2021. Based on consensus analyst estimates, EPS for the S&P 500 could reach 200 this year, marking a 43% gain over 2020. Assuming results continue to beat expectations, reported profits for 2021 could finish much stronger.
Beyond 12-18 months, earnings visibility is always limited. As it stands, S&P 500 EPS for 2022 are projected at 218 — an increase of 9% over current 2020 estimates.

Other observations:
Last week, Taiwan Semiconductor (TSM) reported it would raise prices 10-20% in 2022 — pricing power that protects operating profit margins (currently 42%).
Virtually every industry is supported by semiconductors, including computing, communications, media/gaming, automotive, industrial manufacturing, energy/materials production, household durables, and various electronics, not to mention any industry that uses data/storage.
Semiconductors are ubiquitous providing exposure to both secular growth and value/cyclicals. Moreover, semiconductors are global: NVDA, AVGO, INTC, QCOM, and TXN derive over ~85% of their revenues from non-US markets. This compares to 27% non-US revenue for the Russell 1000 and 44% for the Russell 1000 IT sector.
Bespoke views the semiconductor industry as a growing market leader. iShares Semiconductor ETF (SOXX) is a 30-stock portfolio of industry leaders, including the six names mentioned above. SOXX is up 24.6% YTD. For most portfolios, SOXX could serve as a core growth-oriented equity position.
In future posts, we will offer more theme-based and company-specific insights including important takeaways from the earnings reports of industry leaders.
Commodities & Real Assets
A few thoughts on how we approach commodities and real assets:
Commodities are a unique asset class where prices are driven by supply/demand fundamentals and other factors such as storage/delivery costs. Commodity futures are impacted by other factors such as interest rates and term structure.
Real assets include (1) real estate, (2) natural resources and other commodity-related assets, including exploration, production, distribution, and storage facilities, and (3) infrastructure. The list has expanded over the years. Usually, real assets are considered to have inflation-protected pricing power, but this varies depending on contractual terms.
Both commodities and real assets gained popularity after the tech collapse in the early 2000s. Residential housing, commercial real estate and other assets became an alternative to equities. Commodities also gained acceptance due to robust performance, but in hindsight, much of this boom was attributed to the massive multi-year infrastructure investment across China and other Emerging Markets (and not the result of any enduring or inherent diversification benefits from commodities).
For investors considering allocations to commodities and real assets, an important distinction is whether the targeted assets are public or private.
Publicly-traded assets — equities or debt securities — offer daily liquidity, but short-term prices are influenced by all sorts of (unwanted) market betas. This means prices are impacted by investor sentiment, fund flows, general market volatility, and other non-fundamental factors. Such financialization applies to REITs and equities from other sectors like Energy/Materials. This is not necessarily bad, but adds risk/return factors to be considered.
Private real assets, on the other hand, are illiquid. Investment capital is locked-up and usually unaccessible for years. This is not necessarily a problem as private real assets often require an extended time horizon to perform. Private assets are not impacted by the same market betas referenced above, which is viewed as a benefit, but this is strictly due to their illiquid nature.
Are commodities and real assets considered alternative investments? Opinions vary.
We define alternatives as either assets or strategies that deliver unique sources of risk/return that are not easily replicable in daily-liquid markets. On that basis, commodity futures are the exception to the rule.
Commodities — whether tangible hard assets like gold bars or commodity futures — are viewed as alternative assets. Prices move based on supply/demand factors; there are no company-specific operations or fundamentals to consider.
Due to company-specific factors and the influence of other market betas, we do not view commodity-related equity/debt securities as alternative assets. Others might hold a different view.
Private real assets are justifiably viewed as alternative assets because their risk/return attributes are unique compared to publicly-traded securities. More on this topic in future posts.
Finally, JPMorgan and others see commodities as being on the verge of a super-cycle. This is based on the view that energy/materials producers have underinvested in production capacity over the last decade or so. More on this topic in future posts.
Flows/Positioning, Sentiment & Volatility
Over the years, we have learned to appreciate non-fundamental factors. Fundamentals are the main driver of asset prices over extended time horizons, but non-fundamentals exert enormous influence over short periods.
Pay attention to non-fundamental factors. They account for roughly 90% of daily trading volume.
A June 2017 report by Marko Kolanovic, JPMorgan’s Chief Global Markets Strategist, solidified our conviction. JPM estimated that ~90% of the daily trade volume on the NYSE came from quant-based, passive, or other non-fundamental strategies. In other words, only 10% of trade activity came from discretionary fund managers analyzing fundamentals. “While fundamental narratives explaining the price action abound, the majority of equity investors today don’t buy or sell stocks based on stock-specific fundamentals,” according to Kolanovic.5 Other sources have affirmed this conclusion.
Non-fundamental factors include fund flows from quantitative rules-based strategies such as passive index funds, risk-parity funds that invest based on correlation and volatility factors, momentum-based strategies like trend-following CTAs, trading-oriented hedge funds, and options dealers who buy/sell futures/securities to hedge their underlying options exposures.
Non-fundamental factors include fund flows from quantitative rules-based strategies, passive index funds, risk-parity funds, momentum-based or trend-following CTAs, trading-oriented hedge funds, options dealers, central banks, and pension funds…
Moreover, certain institutional investors — by mandate — are forced to make investment decisions for non-economic reasons. For instance, the US Federal Reserve makes asset purchases to support liquidity conditions and keep interest rates low. Pension funds remain buyers of long-duration government bonds, not so much because of attractive total return attributes, but in order to immunize their long-duration liabilities. Indeed, Japanese pensions have been large buyers of USTs in recent years given flat-to-negative nominal yields in JGBs.
Why should we care so much about non-fundamentals?
As market prices move on a daily, weekly or even a monthly basis, we tend to assign fundamental explanations (narratives). This is mostly rational, but we need to account for non-fundamental factors. Usually, the direction of any price move — up or down — is appropriately linked to a fundamental event or policy decision. However, once the large non-fundamental buying/selling flows begin to roll, the magnitude of price moves can sometimes be amplified, causing overshoots in either direction. Eventually, the flows subside and prices recalibrate towards fair value, but this can take time. More importantly, we believe investors who fail to consider the influence of non-fundamentals are at risk of reaching erroneous conclusions; a misinterpretation of performance attribution could lead to misjudgments about the macro/fundamental environment which could lead to sub-optimal allocation decisions.
Usually, the direction of any price move — up or down — is appropriately linked to a fundamental event or policy decision. However, once the large non-fundamental buying/selling flows begin to roll, the magnitude of price moves can sometimes be amplified, causing overshoots in either direction.
The proliferation of strategies that base investment decisions on non-fundamental factors has only added to their influence. Thus, these are important areas to monitor.
In future posts, we will alert readers to key developments across non-fundamental factors, including fund flows and positioning changes, investor sentiment, and volatility (which increasingly influences cash securities via options markets).
What Others Are Saying
Jefferies, JEFMacro Weekly, 8/29/21: “Powell’s commentary from Friday represented pure dovishness… This aligns with the long-term disinflationary playbook and points to overlooking more hawkish commentary from Fed presidents.”
Jerome Powell, Fed Chair, 8/27/21: “We have much ground to cover to reach maximum employment, and time will tell whether we have reached 2% inflation on a sustainable basis... The unemployment rate has declined to 5.4%, a post-pandemic low, but is still much too high, and the reported rate understates the amount of labor market slack.... it is worth noting that, since the 1990s, inflation in many advanced economies has run somewhat below 2% even in good times. The pattern of low inflation likely reflects sustained disinflationary forces, including technology, globalization and perhaps demographic factors, as well as a stronger and more successful commitment by central banks to maintain price stability.” Powell’s full comments available here.
Cornerstone Macro, 8/27/21: “August back-to-school foot traffic is at an all-time high with overall foot traffic solidly back to pre-outbreak levels. Slowing inflation (see gas and used cars), strong job gains (falling claims, strong JOLTS), and potentially peaking COVID cases, all set the stage for strong spending into year-end.”
Bespoke, Morning Lineup, 8/27/21: “Afghanistan: While the bombings yesterday at Kabul’s airport amidst the frenzied effort to withdraw US troops, citizens, and Afghan staff from the country were shocking, we do not see the situation in the country as a major catalyst for risk assets either way. For broad markets, violence in economic and financial backwaters like Afghanistan is just not a major driver. We will monitor it for unlikely spillovers that may actually drive trading, but at this point any impact would be short-term in nature.”
Raymond James, Portfolio Strategy, 8/26/21: “The Delta variant has been a headwind for the recovery over the past couple of months, along with areas most levered to the economy... However, cases could be peaking with the pace of new cases slowing… This potential inflection is spurring rotation back into re-open areas in recent days, and this is where we see the most opportunity... Moreover, we remain positive on the fundamental backdrop. Q2 earnings season finished well ahead of expectations for the fifth quarter in a row, and we believe upside remains for forward estimates. Also, margin estimates have held steady at record high levels despite the ongoing pressure of supply chain shortages, as demand remains high. We continue to believe that low interest rates and enormous stimulus are supporting elevated valuations and fundamental momentum in the recovery — resulting in upside to equities...”
JPMorgan, Global Markets Strategy, 8/25/21: “We recently upgraded our year-end targets for Equities in both Europe and the US on strong growth and continuing earnings surprises. In EM, we favor cyclical sectors focusing on reopening and reflation, as both valuation and positioning are supportive, given their underperformance vs DM. Bond yields were lower on the week given concerns over delta and geopolitics, but we maintain that valuations appear rich and are consistent with flat GDP growth over the next year. In Credit, we are positive on spreads but anticipate near-term choppiness due to delta risks and Jackson Hole… We continue to expect higher oil prices and see upside risk emanating from the situations in Iran and Afghanistan, but we edged our year-end targets lower due to demand concerns in EM Asia.”
Based on ETF total return data sourced from Koyfin for the period 2/28/20 to 8/27/21 .
Based on the 50 calendar quarters from January 2009 to June 2021.
Household debt from mortgages, auto loans, credit cards relative to disposable income.
Velocity relates to the frequency at which US dollars are used to purchase goods/services.
JPMorgan Global Quantitative & Derivatives Strategy, Market and Volatility Commentary, June 13, 2017.