


Weekly Briefing: 12/12/21
Volatility subsided and global risk assets recovered as the Omicron threat comes into better focus...


Performance & Other Observations
Volatility subsided and global risk assets recovered last week as the Omicron threat came into better focus. Accordingly, high-quality bonds and other safe-haven assets declined. Specifically, data continues to emerge signaling the mild and downtrending severity posed by Omicron compared to prior COVID variants. In fact, cases in South Africa — where Omicron originated — already seem to be peaking and death rates are substantially lower than Delta based on numerous weekend reports.
Across global asset classes, US equities and commodities were the top performers.
Diversified Commodities (DBC) gained 4.3%, driven by a rebound in WTI Crude prices, which rallied 8.7%.
S&P 500 (SPY) gained 3.8%, making a full recovery from the recent sell-off and closing the week at an all-time high. Nasdaq 100 (QQQ) gained 3.9%.
Apple (AAPL) was the top attribution source across US equities, gaining 10.9% for the week. AAPL is a 7.0% weighting in the S&P 500 and a 4.2% weighting in the MSCI All-Country World Index (ACWI).

Sources: CCM, Koyfin 
Sources: CCM, Koyfin


For 2021, US equities dominate most markets and asset classes. The exception is commodities, where rising energy prices have delivered robust gains.
SPY is up 27.1% YTD. Nasdaq 100 (QQQ) is up 27.3%. For both US funds, Microsoft (MSFT) is the top contributor for 2021 followed by Apple (AAPL). MSFT and AAPL are up 55.3% and 36.1%, respectively, contributing a combined 530 basis points to SPY and 920 basis points to QQQ.
Diversified Commodities (DBC) are up 38.3% YTD. WTI Crude (CL1) and Natural Gas (NG1) futures are up 48.4% and 52.9%, respectively. Supply/demand conditions — including limited production capacity due to underinvestment in recent years — support gains across the energy complex going forward according to most sources.

Sources: CCM, Koyfin

The week ahead represents a heavy wave of options expiration. Over the last year, OpEx week has tended to add an increased layer of market volatility and weak performance as investors square positions ahead of the Friday settlement. The S&P 500 shows modest declines of 25-50 basis points on an average/median basis during OpEx week (over the last 12 months) with positive returns just 33% of the time, according to Bespoke. This might be a function of increased call option activity since no such negative trend is evident for the previous period dating back to 2010.
In the new year, the Weekly Briefing will be available ONLY to paid subscribers. To ensure continued full access to Coffee & Capital Markets, please consider joining our research-driven community as a paid subscriber.
Economic Data & Trends
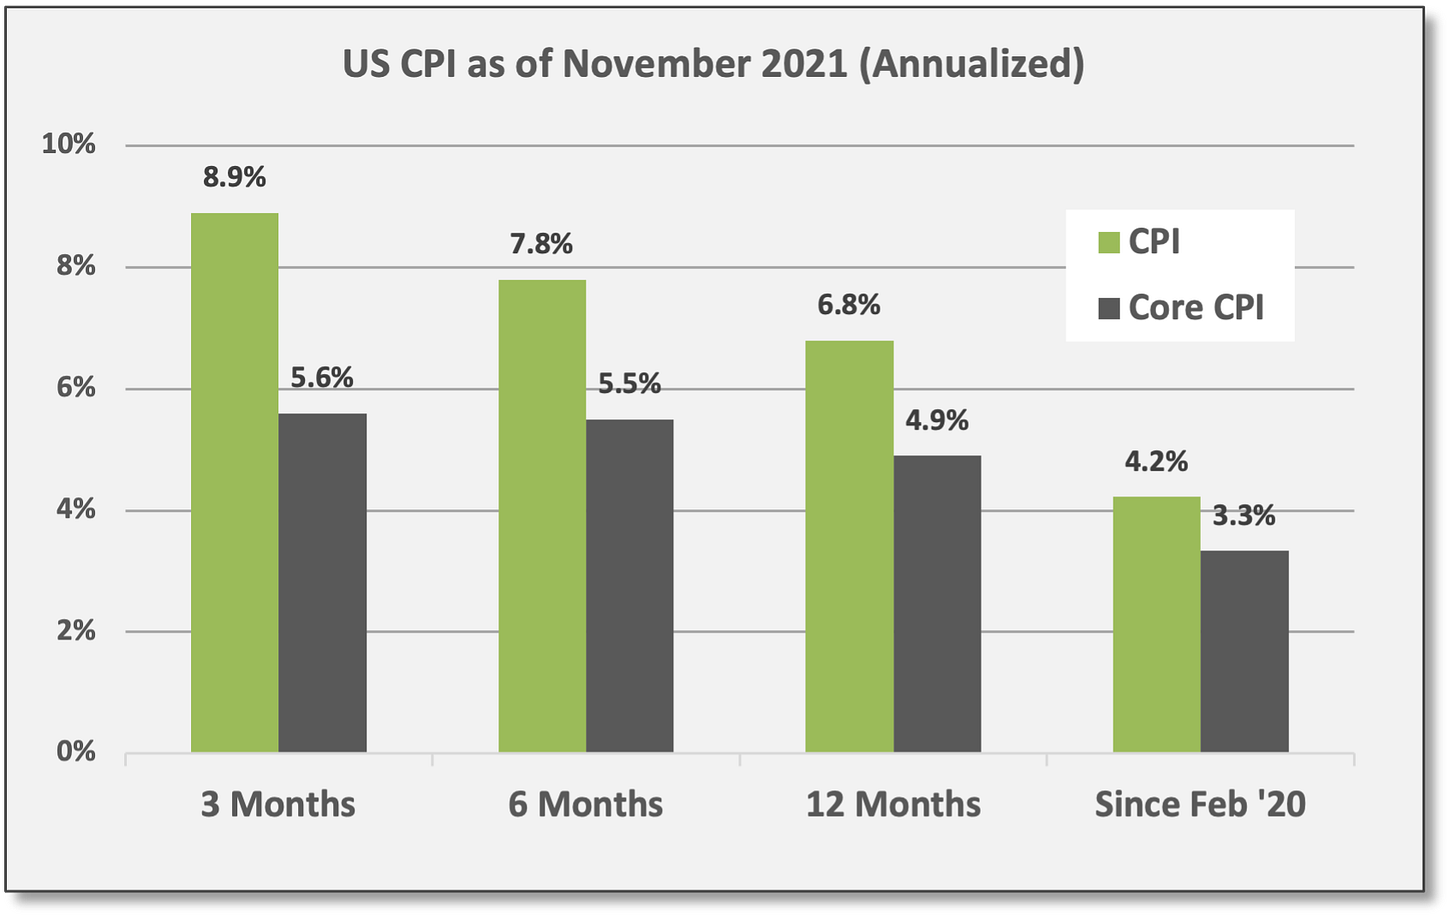
US CPI increased 0.8% in November with a trailing 12-month increase of 6.8%, the largest year-over-year increase since May 1982. Core CPI rose 0.5% for November and is up 4.9% over the last year.
Despite alarming headlines, official inflation measures are probably in the process of peaking based on base effects and other factors. For instance, prices for new vehicles and used cars/trucks leaped higher over the last year by 11.1% and 31.4%, respectively, but such prices are expected to level off as demand normalizes at lower levels. Plus, rising semiconductor production will help alleviate supply shortages.
However, even if the pace of inflation fades, we should expect prices to remain elevated versus pre-COVID levels as consumer/corporate balance sheets are flush with cash. In other words, demand trends look persistent for both consumer spending and corporate capital expenditures (CAPEX).
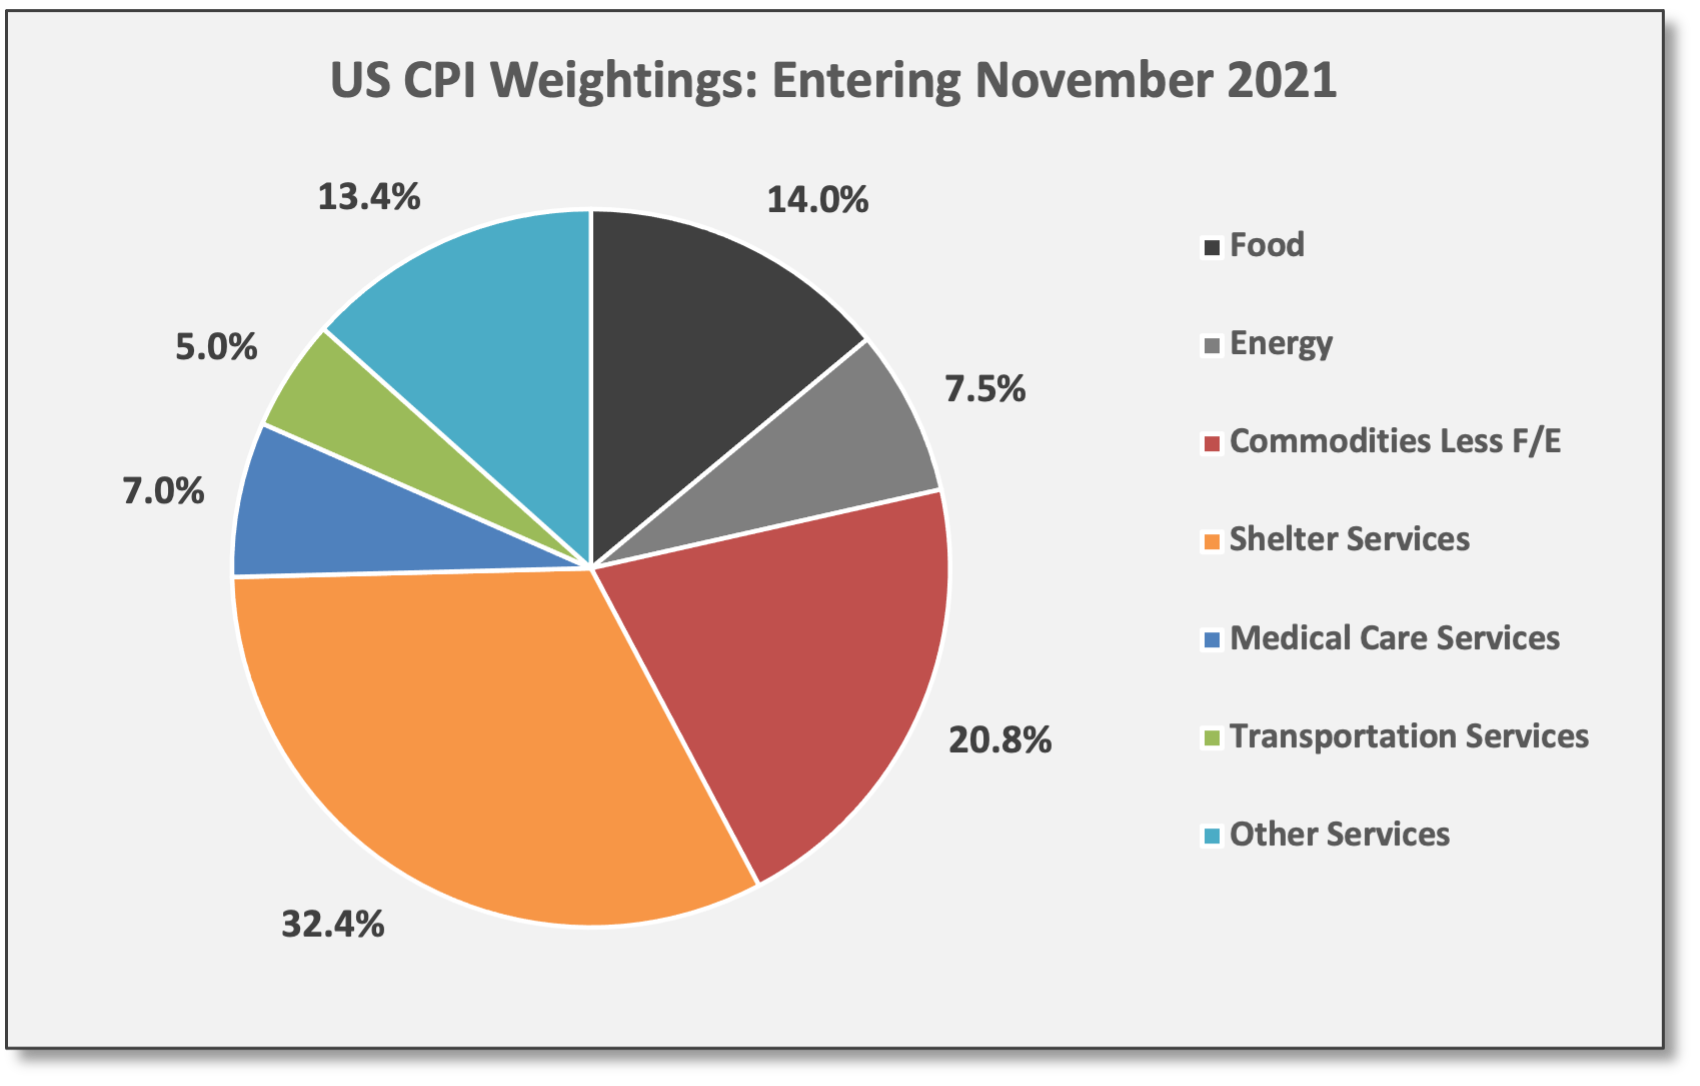
In addition, price trends for housing/shelter look to be persistently strong and sticky with no signs of demand deterioration. Here, price levels are not as high as the more volatile sectors (i.e., new/used autos), but prices are still running above-trend. Moreover, housing/shelter is a large weighting at 32% of CPI and 41% of Core CPI.

Sources: CCM, US Bureau of Labor Statistics Notably, inflation gains are not simply a matter of prices rebounding from the COVID-related plunge. Compared to price levels from February 2020 — before COVID emerged — annualized CPI and Core CPI are up 4.2% and 3.3%, respectively. This compares to a rolling 12-month average CPI of 2.2% since 2000.
Sources: CCM, fred.stlouisfed.org

In structuring wealth management programs, a crucial objective is to preserve purchasing power over time. This ensures one’s current standard of living (wealth, income, spending, etc.) is sustainable. In short, to protect and preserve one’s purchasing power, the value of investment assets must keep pace with price inflation.1
Since 2000, US Consumer Price Inflation (CPI) has averaged 2.2% on a rolling 12-month basis. Essentially, this matches the stated 2% policy target of the US Federal Reserve Bank. Recently, the Fed has re-oriented market expectations to the idea of an “average” inflation target of 2%, which implies a tolerance for inflation running > 2% for an extended period to adjust for periods when inflation runs < 2%.

Indeed, many economists expect a higher rate of US inflation in the years ahead. Moreover, market-based pricing — for US Treasury notes and UST inflation-protected securities — assumes CPI will average ~2.8% and ~2.5% over the next five-year and ten-year periods, respectively.2
Practical “inflation” could be defined differently for specific consumers and institutions depending on their unique spending patterns.
Certainly, inflation is set to run above-trend for a period of time, but eventually inflation will probably remain controlled due to pervasive technology improvements, the digital transformation, productivity gains, and other factors. That being said, practical “inflation” could be defined differently for specific consumers and institutions depending on their unique spending patterns.

Assuming a 2.2% inflation rate over the next 20 years, the purchasing power of $1 would be reduced by 36%. For a family with an annual spending budget of $120,000 ($10,000 per month), it would require over $186,000 to purchase the same level of goods/services 20 years from now. Put differently, that same $120,000 today will only provide enough purchasing power to buy about $76,000 worth of goods/services in two decades.

All this presents a challenge, but again, asset values and purchasing power can be protected if investment returns match or exceed the inflation rate. In other words, if the investment portfolio generates a net return greater than the 2.2% CPI rate from the illustration above, then the purchasing power of the capital base will be preserved.
Inflation-Plus-Spending: If annual distributions are being withdrawn from the investment portfolio to support spending needs, then the investment assets need to achieve an even greater return to preserve the purchasing power of the remaining capital base (assuming that is a core objective). In short, the required return would be equal to inflation-plus-spending. For example, if an investment portfolio is distributing 4% of its assets each year, the target return would need to be at least 6.2% based on the CPI assumption referenced above (2.2% CPI + 4% distribution rate). In this way, the purchasing power is protected for (1) the annual distribution amounts as well as (2) the remaining capital base.
Monetary/Fiscal Policy
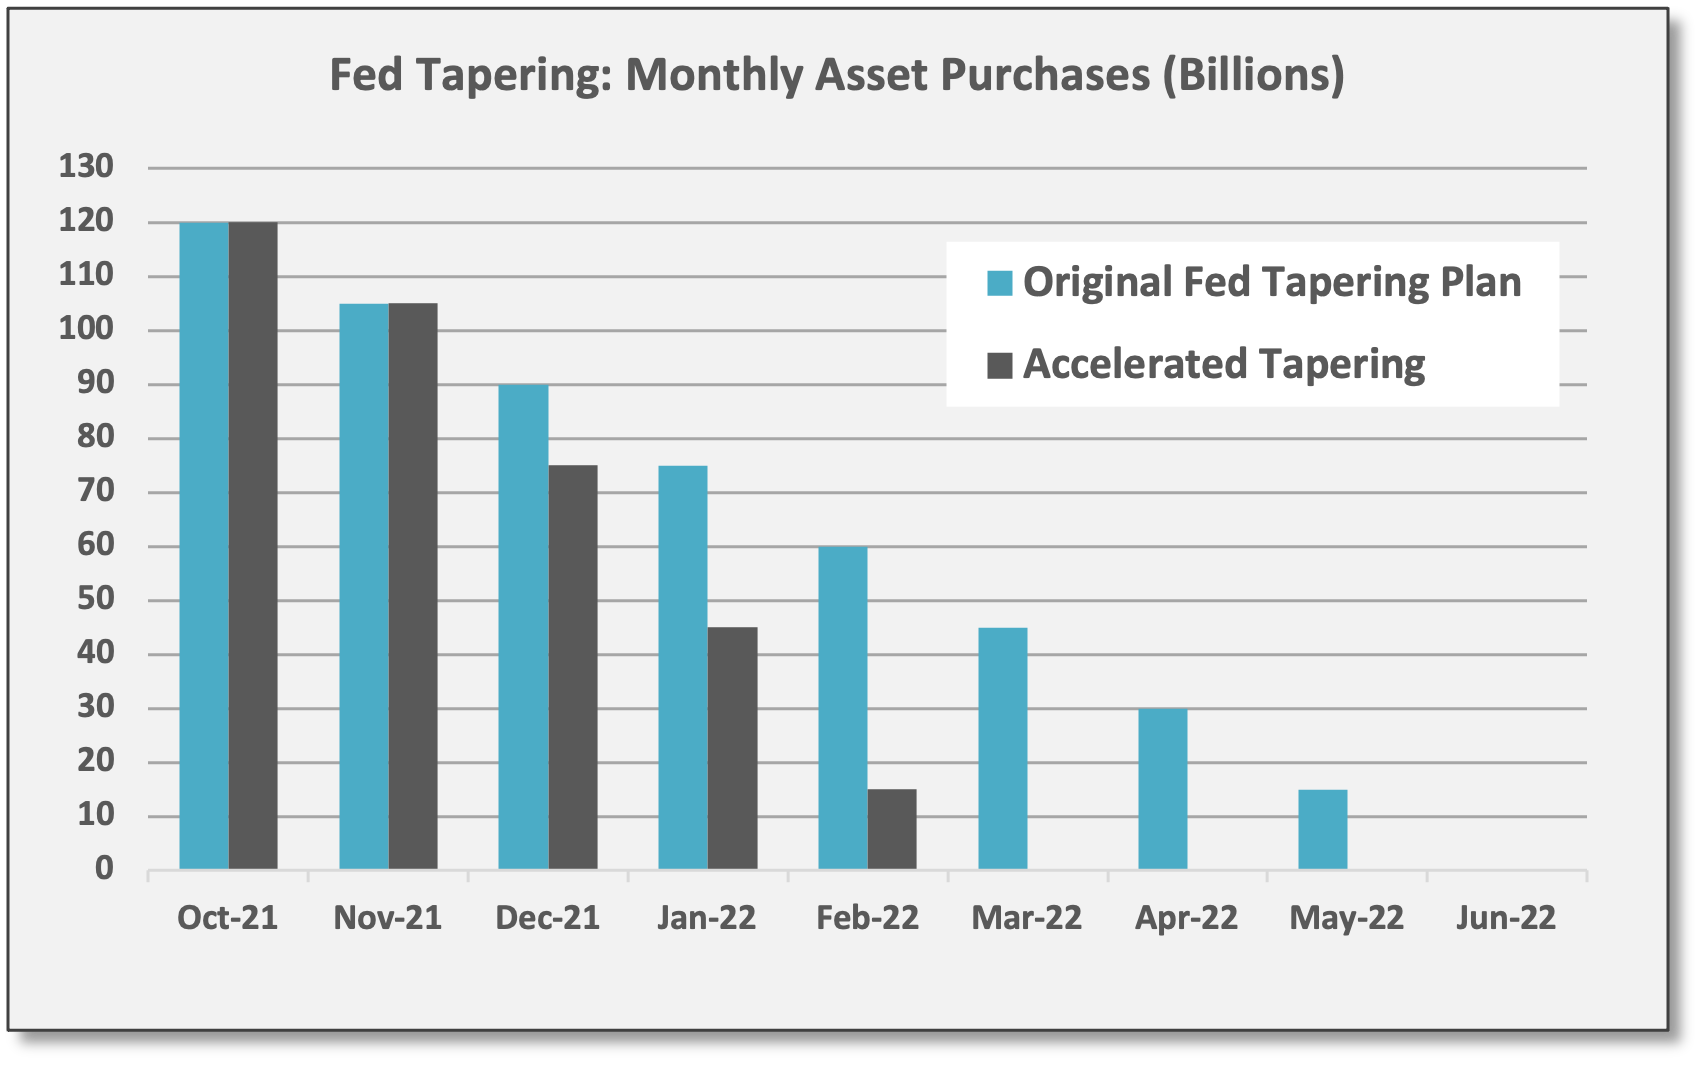
At the FOMC meeting later this week, expect the Fed to push ahead with accelerated tapering. Essentially, this would match the message from Powell’s recent testimony before Congress. The plan for accelerated tapering — scaling down asset purchases at a faster rate — was outlined at the last FOMC meeting on 11/3/21. That plan has been reiterated publicly by Powell and other FOMC members in recent weeks, so the policy action to end quantitative easing has been well telegraphed. In fact, markets were accepting of this reality and only balked at Powell’s recent testimony because it came amid the depths the Omicron panic.
Nonetheless, because Powell’s recent public comments before Congress were interpreted as “hawkish” — and we suspect this view was less about a rational processing of Fed Policy and more about an emotional reaction to the COVID “fear du jour” — it’s reasonable to expect Powell to communicate a soothing tone to reassure investors that rate hikes will only be implemented if GDP growth and employment are progressing as expected. And we expect Powell conveys reasonable confidence in the outlook for both.
Fixed Income, Rates & Credit
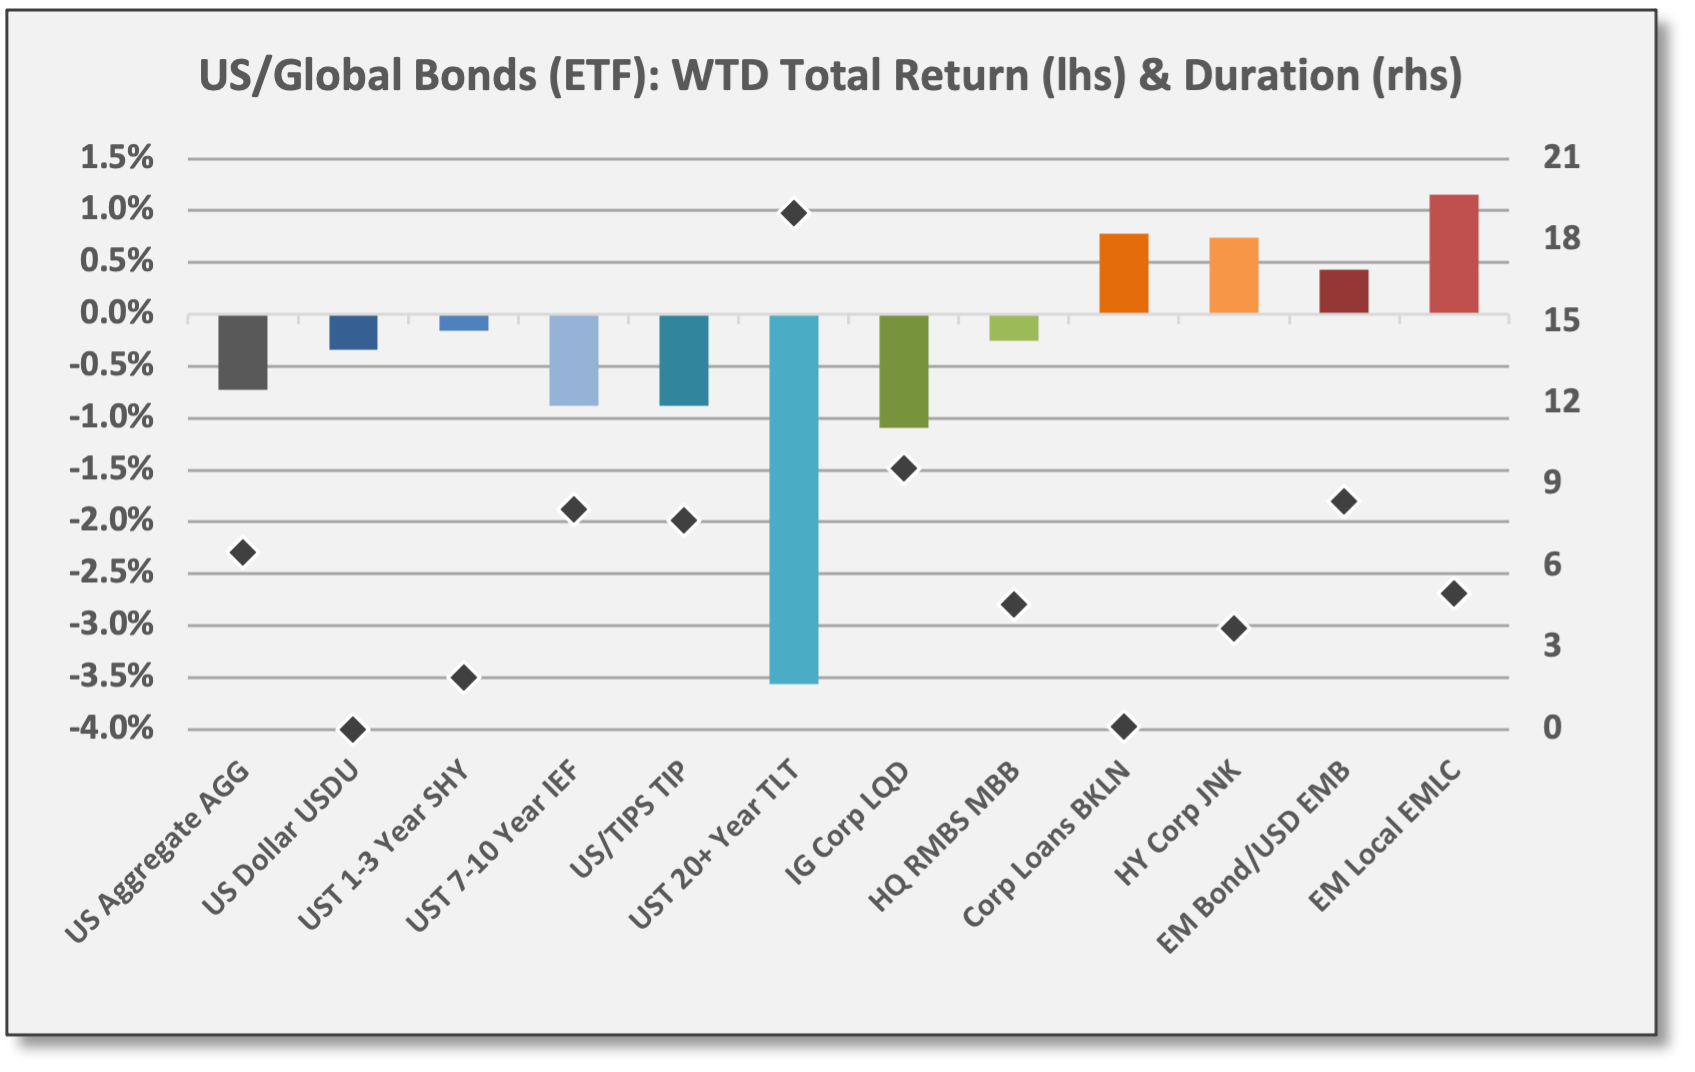
With interest rates moving higher, high-quality duration-sensitive bonds declined last week, but more growth-sensitive credit-based strategies gained.
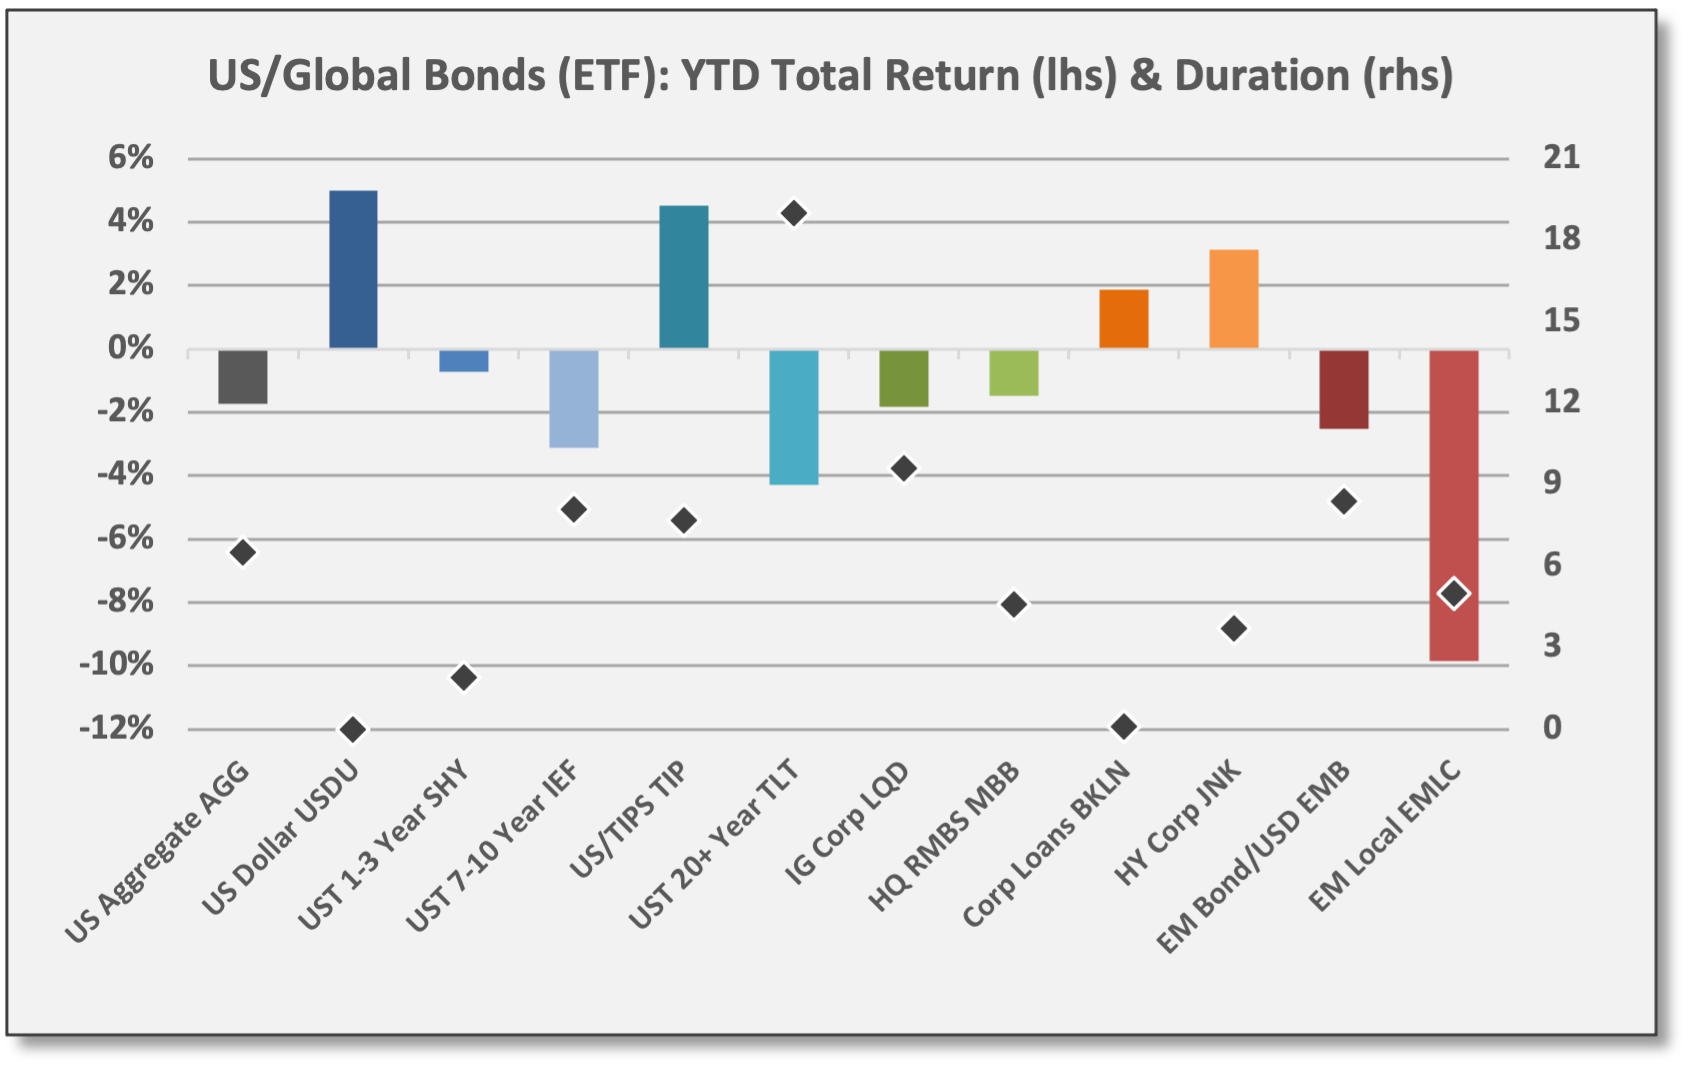
High-yield bonds/loans delivered gains along with Emerging Markets debt. Floating-rate HY Bank Loans (BKLN) — with virtually zero rate duration — added 0.8% for the week. HY Corporate Bonds (JNK) added 0.7% as credit spreads tightened ~30 basis points to +325 (as of 12/9). Emerging Markets Local Currency Bonds (EMLC) gained 1.2%, benefiting from risk-on sentiment and a weaker US dollar.
UST securities declined as rates moved higher for most points all along the yield curve. UST 20+ Year (TLT) declined -3.6%. US Aggregate Bond (AGG) declined -0.7%.

Sources: CCM, Koyfin
For 2021, most high-quality bonds have declined in response to interest rates moving higher.
US Aggregate Bond (AGG) is down -1.7% for 2021.
Top performers: UST Inflation-Protected Securities (TIP) and the US dollar (USDU). Both are insulated — to an extent — from rising rates. TIP is up 4.5%, adjusting principal value for changes in CPI. USDU is up 5.0% based on (1) outperforming US assets and positive flows from foreign investors and (2) expected changes to Fed Policy which eventually should lead to improved real rates.
HY corporate bonds/loans have delivered modest positive returns this year as credit spreads have tightened amid the growth recovery.

Sources: CCM, Koyfin
The UST yield curve steepened a bit last week with rates up for most maturities. UST 10-Year closed at a yield of 1.48%, up five basis points for the week. UST 30-Year closed at 1.88% for a jump of 13 basis points. The yield for the UST 2-Year was up just two basis points to 0.67%. For 2021, rates are higher and the yield curve has become less steep, although the 2-10 spread is virtually unchanged.

In China, credit spreads tightened last week, especially for the property sector. China Evergrande, the large property developer, officially defaulted on an estimated $1.2 billion in debt securities last week. Apparently, prices for outstanding Evergrande bonds were mostly unchanged as a default has been anticipated for months. Bonds and equities tied to the real estate sector in China actually gained last week.
As mentioned above, the JPM EM Local Currency Bond (EMLC) gained 1.2% last week. The fund is sponsored by Van Eck. At 11%, China bonds represent the largest country weighting for EMLC followed by Indonesia at 10% and Brazil at 9%.
Goldman Sachs is now taking a more constructive view on China high-yield bonds, including issues from the real estate sector. “We maintain the view that defaults will stay elevated, and managing tail risk remains key to investing in China property HY… incremental policy easings are likely to disproportionately benefit the better quality [HY] credits… whilst staying cautious on the weaker credits. This compares with our previous stance which was to focus on low-beta names to minimize default risks and market volatility.”
Reportedly, 14 Chinese real estate developers (with over $220 billion in combined debt) have missed debt payments this year. As the issuers move ahead with restructurings, Goldman expects lower-than-average recovery rates. “Higher-than-anticipated liabilities, lower-than-anticipated assets, and a small pool of unsecured common creditors means that in the event of restructuring or liquidation, some recovery rates for bondholders could test the 24-33% historical averages cited by S&P for Chinese companies that have defaulted.”
US/Global Equities
US/global equities delivered solid gains last week with Nasdaq 100 and Technology leading the way as Omicron concerns fade.
S&P 500 (SPY) gained 3.8% for the week. SPY is fully recovered from its recent sell-off and once again trades at an all-time high.
S&P Technology (XLK) was the top performer last week. Apple (AAPL) gained 10.9% for the week.
MSCI China (MCHI) was the best performing global market, benefiting from a tech/media rebound there. MCHI gained 4.5% last week with Alibaba (BABA) up 11.7%.

Sources: CCM, Koyfin 
Sources: CCM, Koyfin


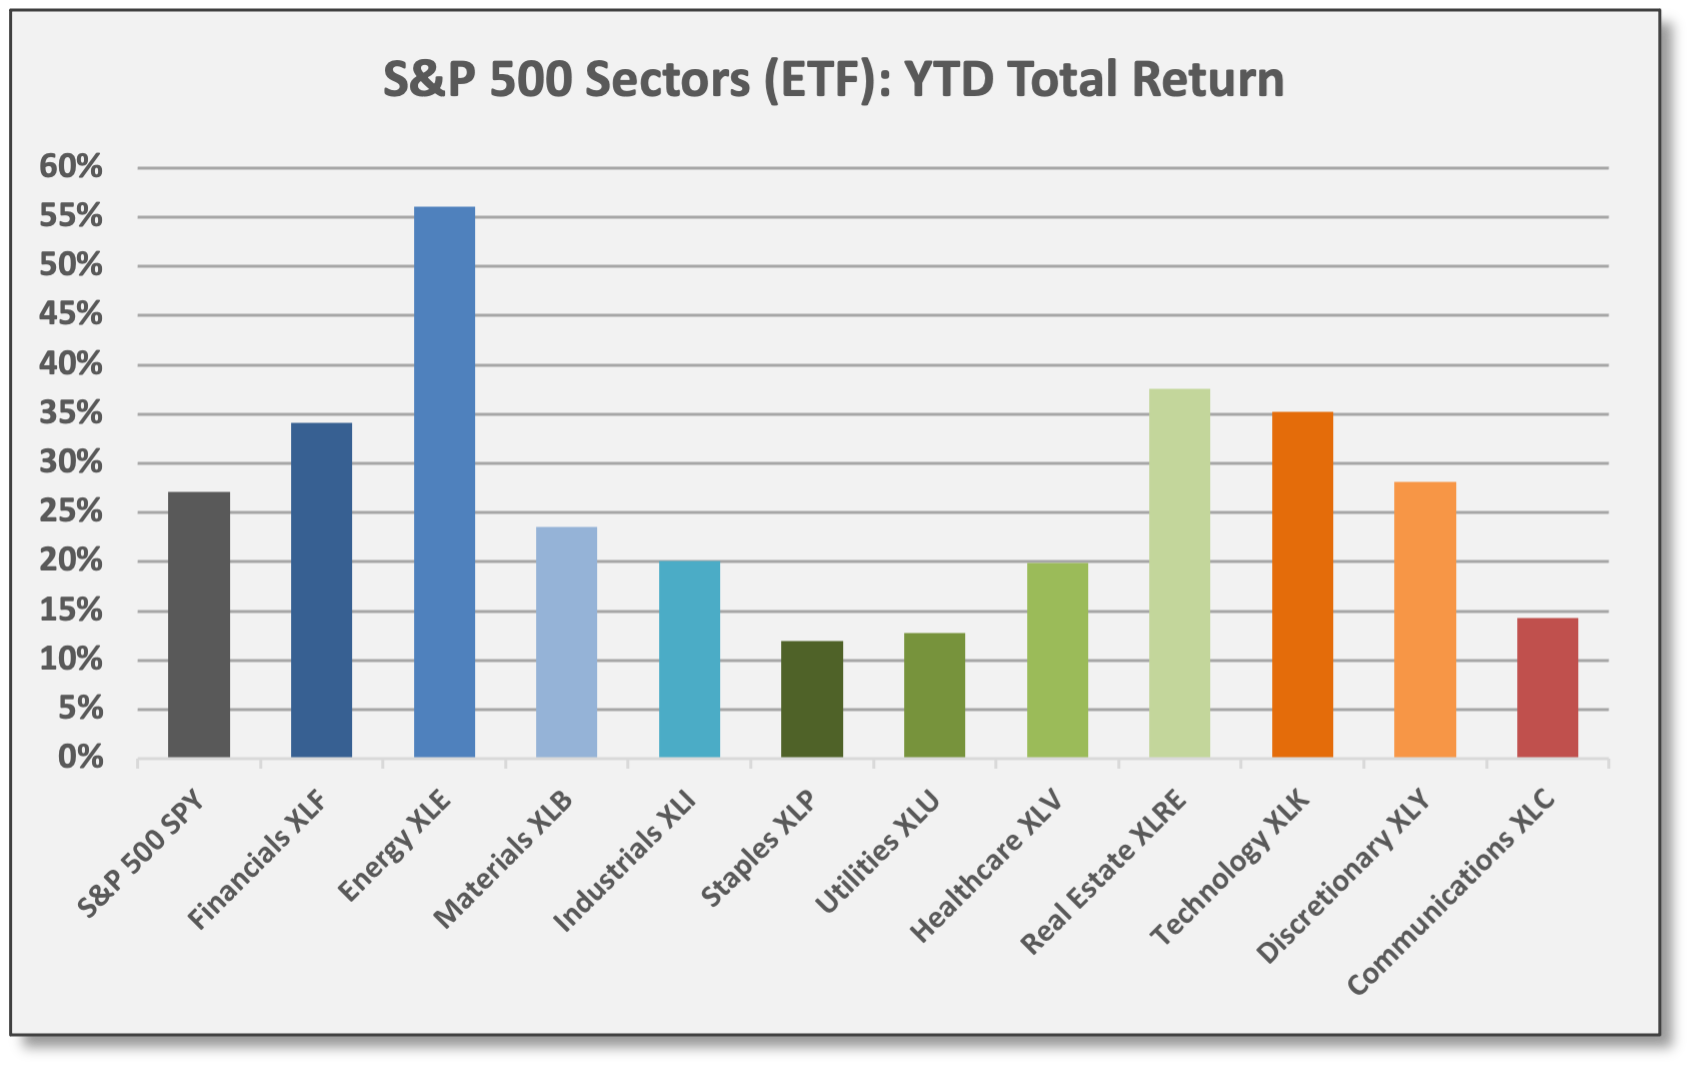
For 2021, US equities have outperformed with strong results from both cyclical/value and quality/secular/growth sectors.
Energy (XLE) and Financials (XLF) are the top performing cyclical/value sectors in the S&P 500 with gains of 56.1% and 34.2%, respectively. Energy has benefited from a rebounding economy, rising global demand and higher energy prices; top attribution sources for XLE are Exxon Mobil (XOM) and Chevron (CVX) with YTD gains of 62.3% and 47.5%, respectively. Financials (banks) have benefited from GDP growth, rising interest rates and a stable UST yield curve — the 2-10 spread is virtually unchanged — and improving credit quality; top contributors for XLF are Bank of America (BAC) and JPMorgan (JPM) with YTD gains of 49.7% and 28.9%, respectively.
Technology (XLK) is the best performing growth sector with a gain of 35.3%; top contributors for XLK are Microsoft (MSFT), Apple (AAPL), and NVIDIA (NVDA) with YTD gains of 55.3%, 36.1%, and 131.5%, respectively. Speaking of NVDA, the Semiconductor Index (SOXX) is up 43.0% YTD. Meanwhile, Communications Services (XLC) has lagged; Alphabet (GOOG/L) has gained 68.9%, but traditional communications providers (VZ, TMUS, T) have declined for the year along with certain gaming, media, and social media companies (ATVI, DIS, TWTR). In general, large-cap growth has delivered solid gains, but small-cap speculative and “unprofitable” growth has struggled due to valuation compression.
Defensive/yield-oriented sectors have naturally lagged this year.
Non-US markets show mixed results for 2021. Developed Markets show modestly positive returns as economic growth has been hindered by COVID and related policy actions. Emerging Markets show dramatic performance dispersion.

Sources: CCM, Koyfin 
Sources: CCM, Koyfin

For 2022, the average estimated total return for the S&P 500 is 5.5%. In a holiday season tradition, equity strategy teams have been issuing 2022 outlooks. Below is a summary of estimated values for the S&P 500 Index for 12/31/22. Index values are primarily based on earnings and valuation projections. We also provide the implied price return based on Friday’s closing value of 4712. Data was complied and reported by The Market Ear as of 12/8/21.

Across the 16 firms included above, the average estimate for year-end 2022 is 4909, which implies an estimated price gain of 4.2% from current levels. This implies an estimated total return of 5.5% when adding the current dividend yield of 1.3%.
Equity analysts are projecting S&P 500 EPS growth of 8% in 2022 according to consensus estimates compiled by Yardeni Research.


On this basis, the 2022 return projections above imply valuation compression. If EPS rise by 8%, but the price value of the index rises just 4-5%, then valuations must decline by definition. Lower P/E ratios seem plausible assuming interest rates move higher, especially for the long-duration secular growth equities that dominate the S&P 500. This expected dynamic — compressing valuations — is a consensus view.
As an aside, if corporate profits for the S&P 500 rise at 8% next year, it would lag the recent pre-COVID average, but would exceed the median EPS growth rate of 6.8%.
Commodities & Real Assets
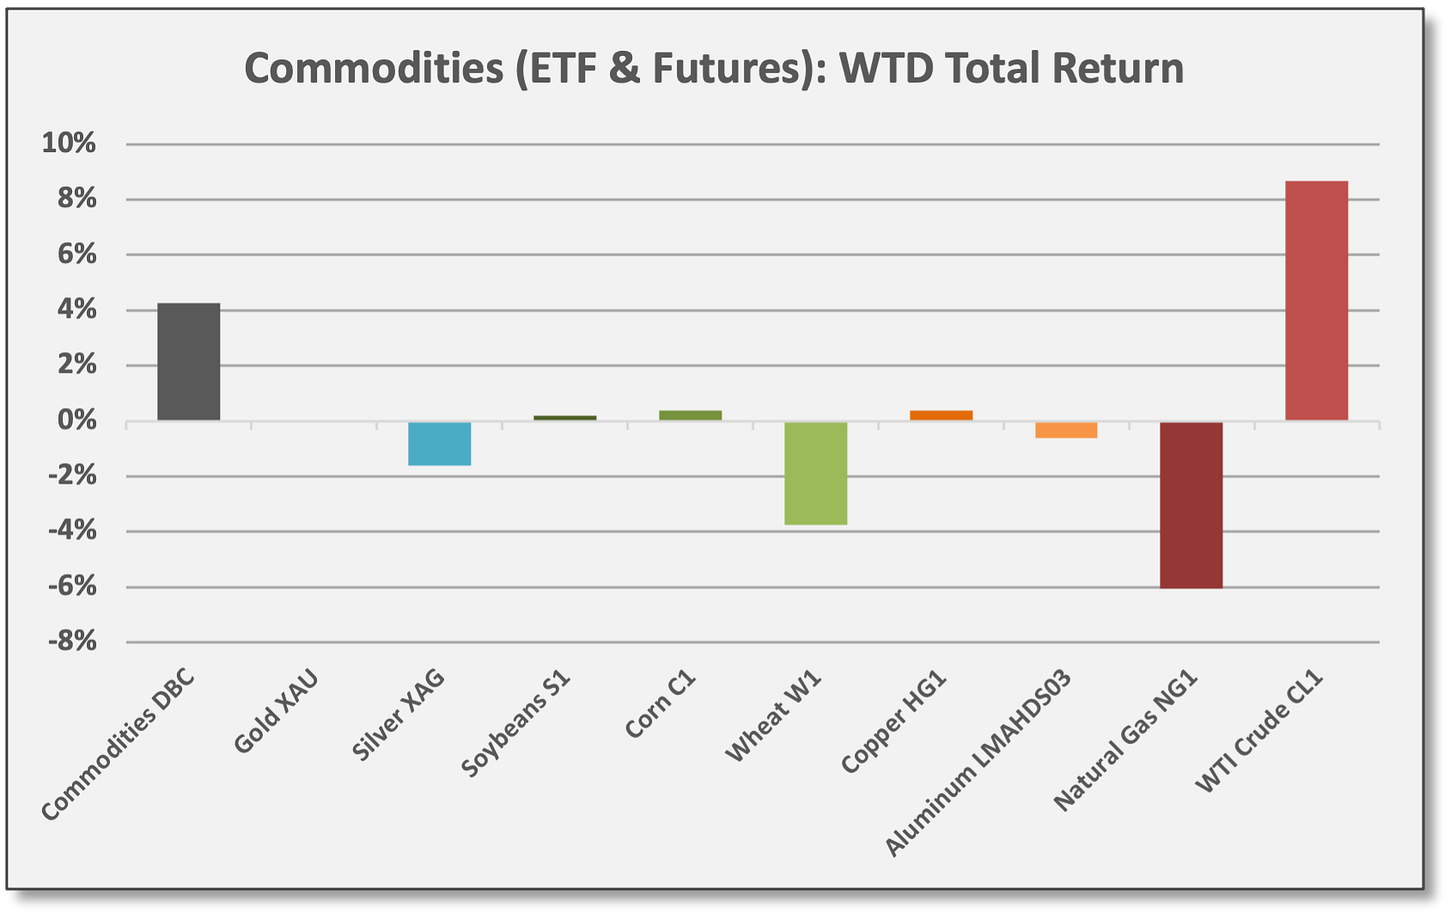
Commodities gained last week on the strength of energy prices. Previously, we have reported broad sector returns, but below we highlight the larger-weighted individual commodities. In part, to highlight specific return drivers but also to show the dispersion and volatility across and within sectors.
Specifically, WTI Crude futures gained 8.7% as reports suggest Omicron severity levels are mild. WTI closed the week at 72.02 per barrel; prices are down -6.1% since Biden released 50 million barrels from the SPR, but prices actually moved higher following that announcement and only moved lower when Omicron headlines emerged. WTI reclaimed its 200-day moving average last week, so it is fighting to reassert an uptrend.
Meanwhile, Natural Gas prices dropped -6.1% last week, so there was dispersion within Energy.
Across other sectors, commodities were mixed, but mostly lower.
Sources: CCM, Koyfin

For 2021, Energy and Base Metals have delivered solid gains.
Energy and Base Metals tend to show positive correlation to global economic growth (and equities) and both have benefited from the post-COVID reopening and spending rebound.
Precious Metals, perceived as safe-haven assets and/or inflation hedges, have underperformed, failing to deliver any protection this year against rising CPI levels.
Agricultural Commodities have delivered mostly positive returns this year.

Sources: CCM, Koyfin

Commodities as diversification tools. When assets with low correlations are blended together, diversification is achieved. By definition, this reduces portfolio volatility as different return streams provide offsetting moves. As we are inclined to say, finding diversifiers is not difficult to do; finding diversification strategies at a reasonable cost with a reasonable return profile is more of a challenge. We are not necessarily advocating for commodities, but we offer some correlation data below.
Over time, commodities prices are driven by supply/demand fundamentals. At any given point, either side of the equation — supply or demand — can dominate price movements. In the short-term, however, non-fundamental/technical factors can exert immense influence, including sentiment, fund flows, price momentum, etc.
Diversified commodity funds and indices include exposure to a broad set of commodities. These include:
Economic growth-sensitive commodities — Energy, Base Metals
Defensive/safe-haven commodities — Precious Metals
Non-correlated commodities — Agricultural Commodities
These narratives are helpful for understanding how certain sectors might perform, but they are oversimplified and imperfect. Actual correlations and performance behavior vary over time.
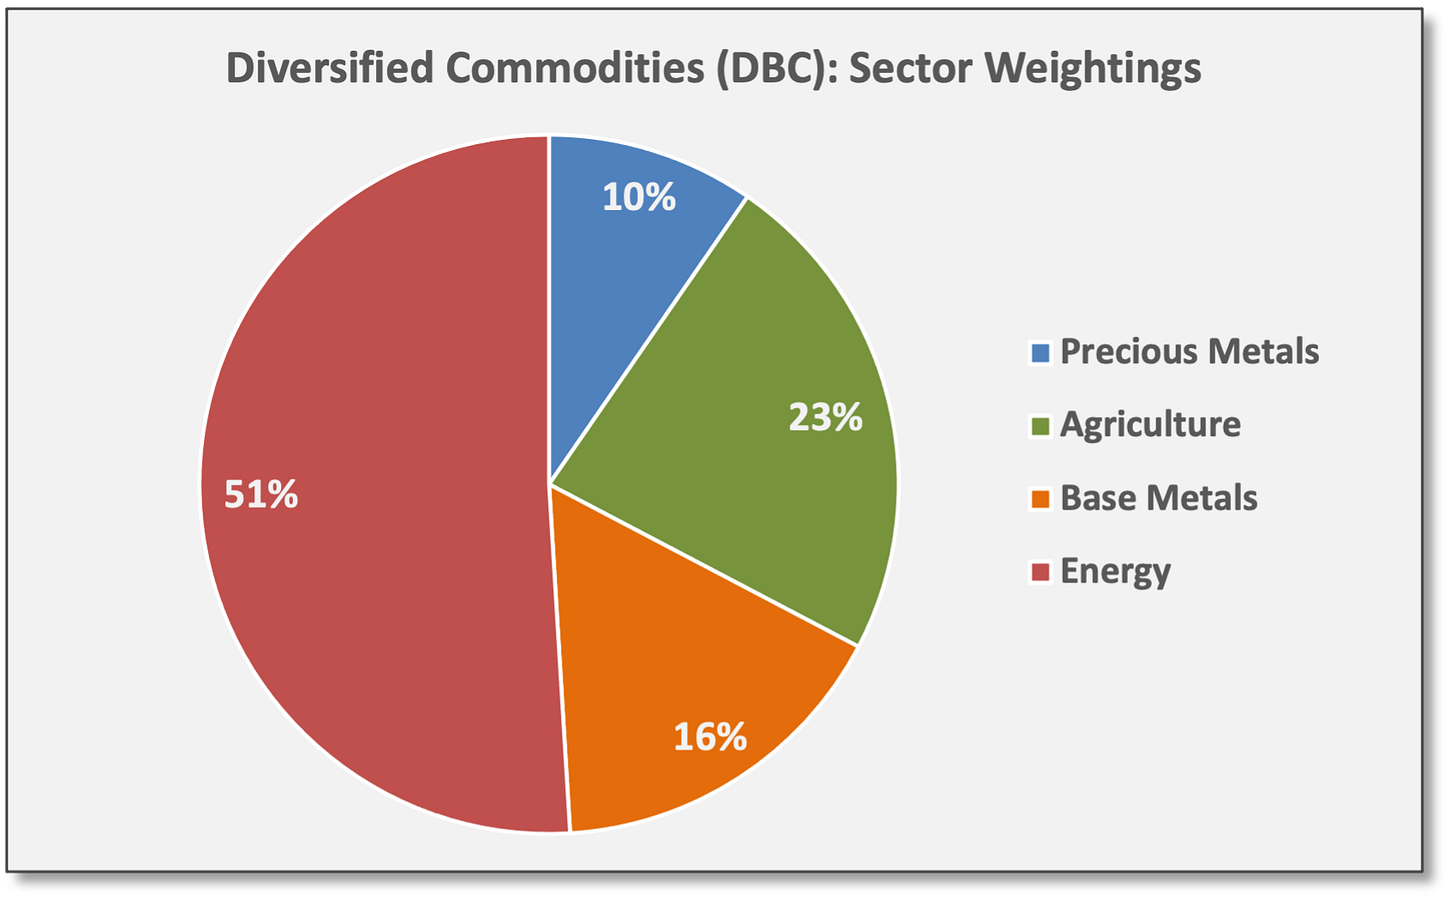
Several prominent commodity indices are investable via ETPs including the Bloomberg Commodity Total Return (DJP) and the Goldman Sachs Commodity Index (GSG). The Invesco DB Commodity Index (DBC) is an exchange-traded fund (ETF) that tracks the DBIQ Optimum Yield Diversified Commodity Index Excess Return, sponsored by Deutsche Bank. All the above invest in commodity futures contracts.
DBC invests in commodity futures (along with collateral invested in US T-Bills).
Allocations to various commodities approximately match global production weights.
DBC and the underlying index are rebalanced annually.
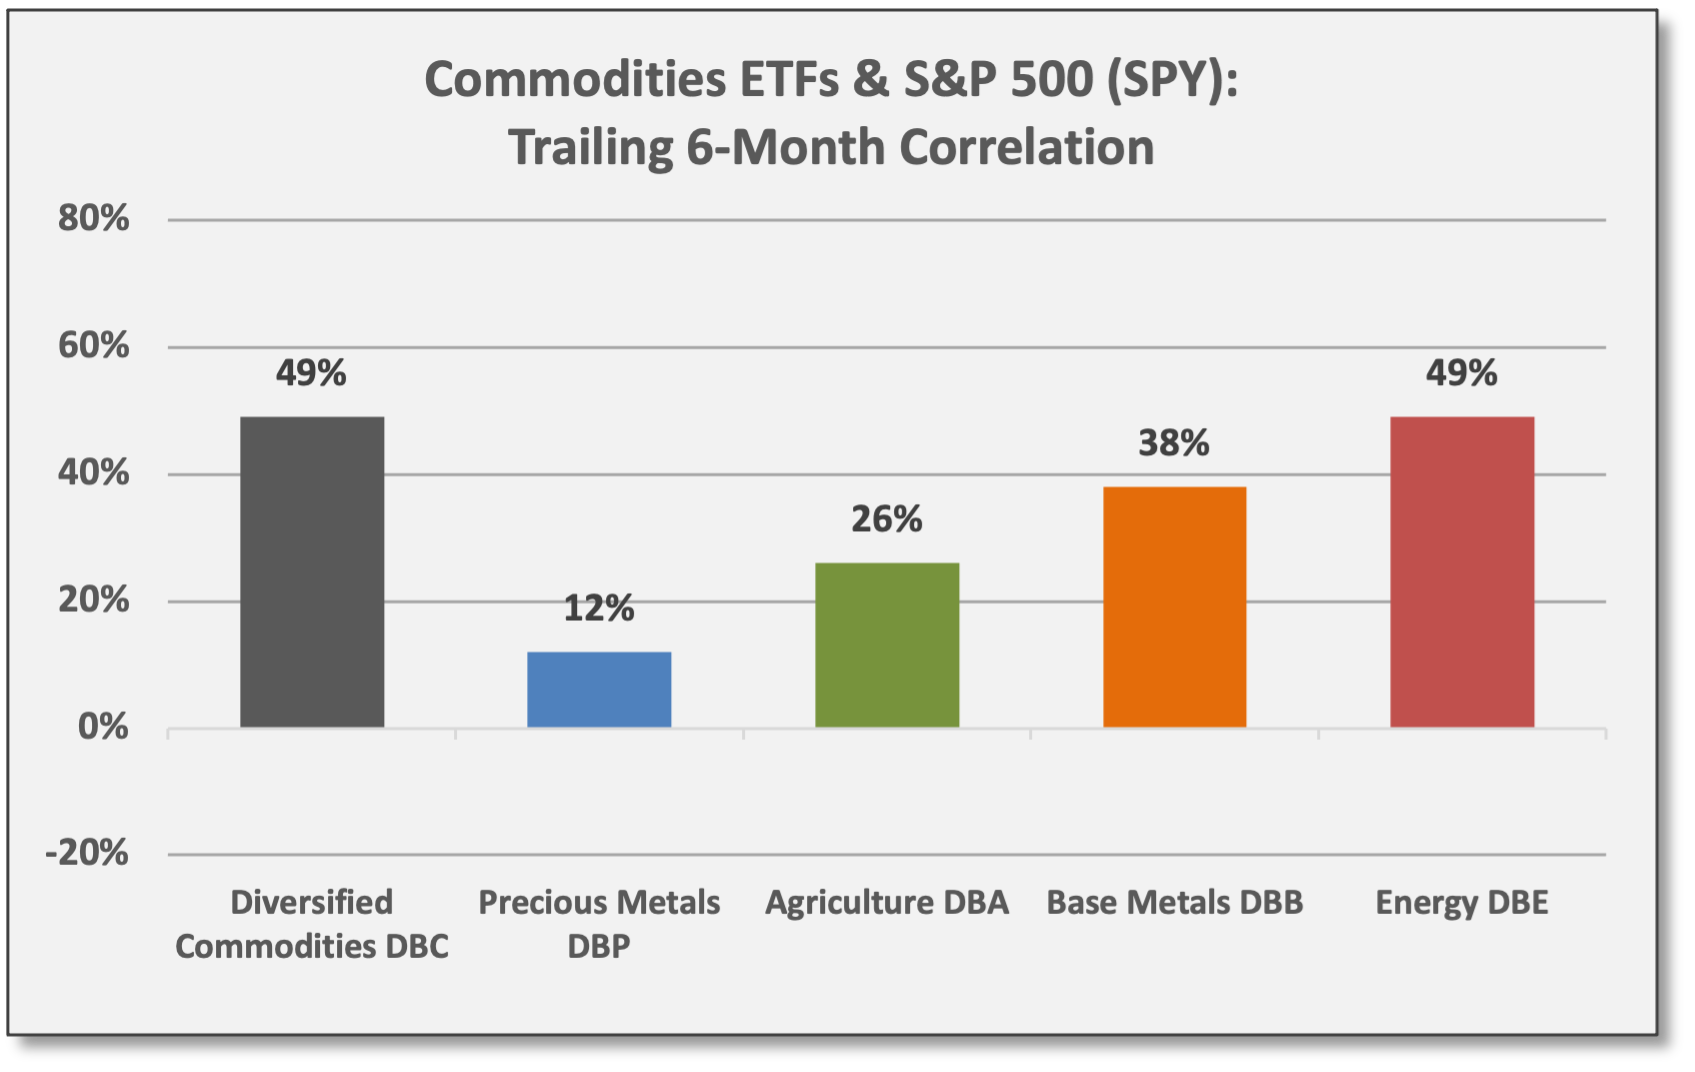
Based on daily returns, DBC shows a 49% correlation to the S&P 500 (SPY) over the last six months. Over the last 10 years, the average correlation is 37% with a correlation range of -3% to 74%.
Sources: CCM, Invesco 
Sources: CCM, Koyfin (Click to enlarge)


Invesco offers underlying commodity sector funds based on DB indices. These include Energy (DBE), Base Metals (DBB), Agriculture (DBA), and Precious Metals (DBP).
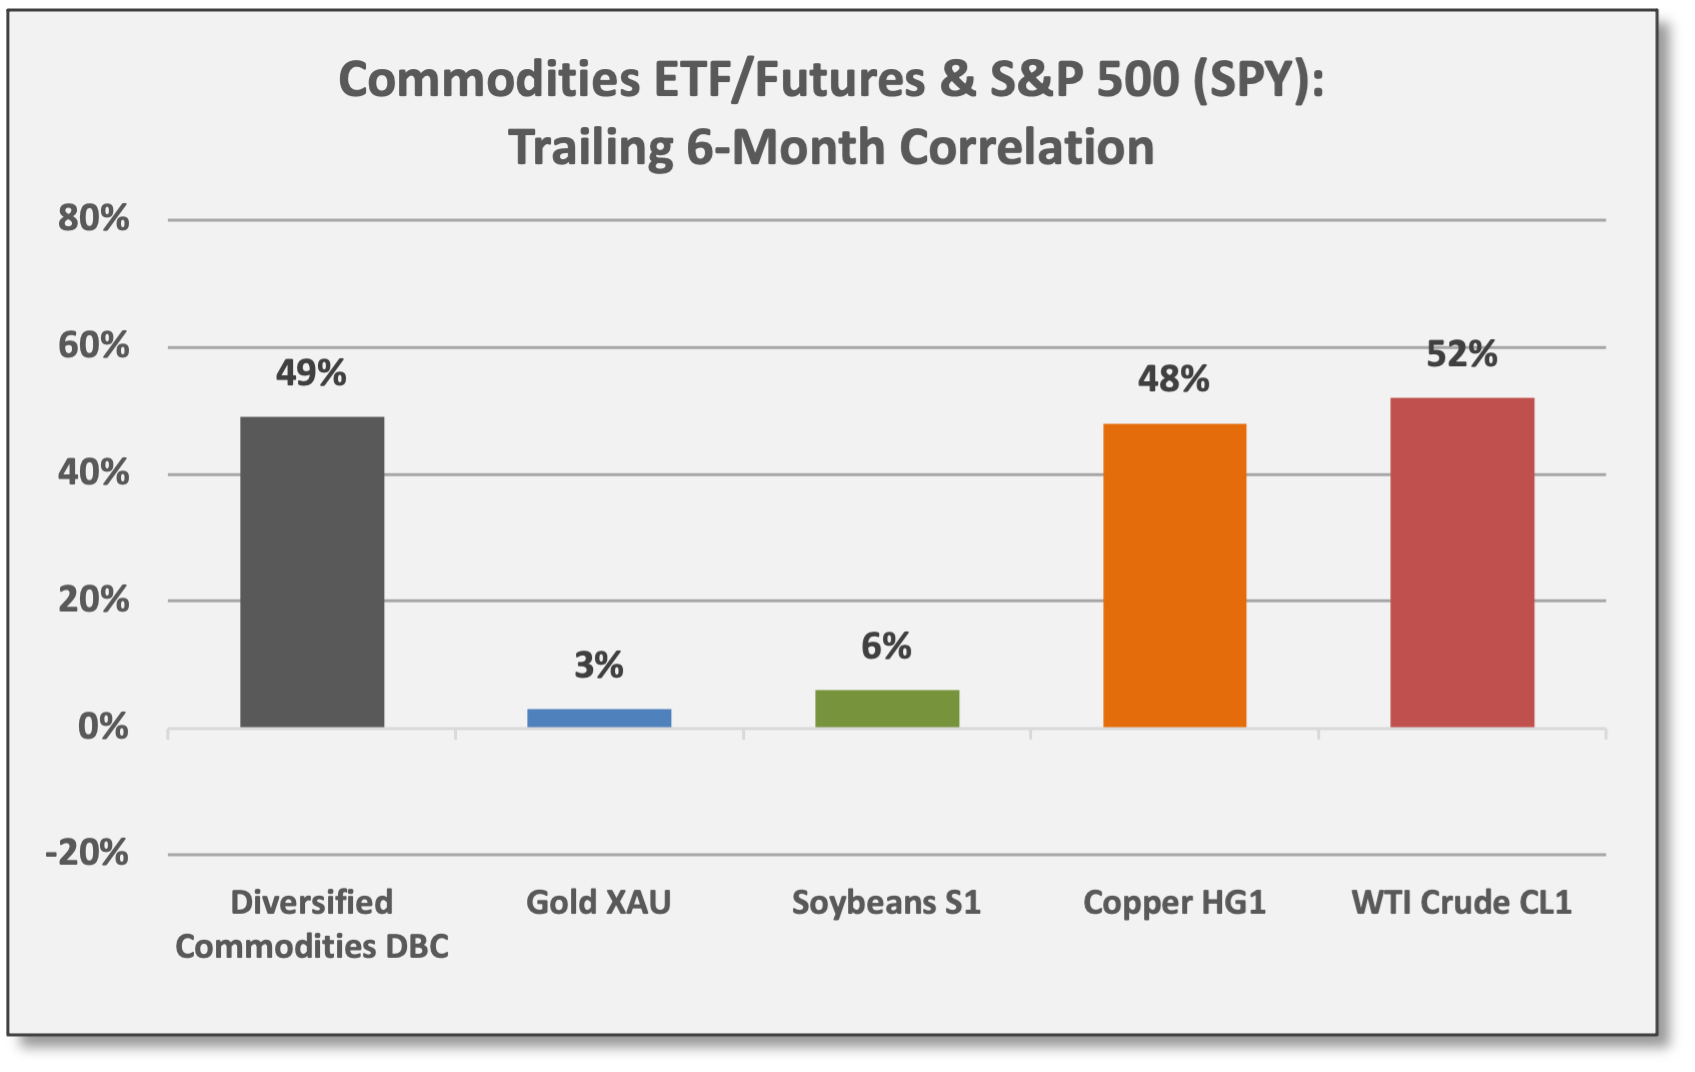
Energy (DBE) and Base Metals (DBB) tend to be sensitive to the global economic cycle. This implies prices increase as global growth/demand increases (and vice versa), but prices also depend on supply conditions. Although correlations fluctuate, Energy and Base Metals commodities tend to be positively correlated to global equities — just as Energy and Materials equities are viewed as cyclical sectors. Based on daily returns, DBE and DBB show correlations to the S&P 500 (SPY) of 49% and 38% over the trailing six months, respectively. Similarly, WTI Crude (CL1) and Copper (HG1) show positive correlations. CL1 shows a 52% correlation to SPY over the trailing six months, but the correlation has increased to 81% over the last month; the CL1 correlation to SPY is 32% over the trailing 12 months. Over the last 10 years, the six-month correlation of WTI Crude to SPY has averaged 31%.
Precious Metals (DBP), and Gold (XAU) specifically, often are perceived as defensive safe-haven assets. This implies Gold has a negative correlation to global equities, at least during periods of stressed equity markets. Gold is also viewed as an “inflation hedge”(protection against rising prices) and this market view is alternatively conveyed as a “deflation hedge” in terms of protection against a weakening US dollar (which would be inflationary for USD holders). However, correlations for Gold fluctuate over time, so its performance is not predictable. We view Gold as a speculative trading asset, often influenced by momentum factors. DBP — 80% allocated to gold and 20% to silver — shows a correlation of 12% to the SPY over the last six months. Gold (XAU) shows a correlation of 3% over the last six months compared to an average correlation of -3% over the last 10 years.
Agriculture Commodities (DBA) are mostly non-cyclicals with steady demand, similar to Consumer Staples equities. Thus, Agriculture tends to be non-correlated to equities and influenced by global/regional weather conditions. DBA shows a correlation of 26% to the SPY over the last six months. Agriculture is a broadly diversified sector composed of Soybeans Corn, Wheat, and other commodities. Soybeans (S1) show a lower correlation of 6% over the last six months with an average correlation of 12% over the last 10 years.

Sources: CCM, Koyfin 
Sources: CCM, Koyfin 
Sources: CCM, Koyfin

“Financialization” means more equity beta. Diversified commodity sector ETFs tend to show higher equity correlations compared to the underlying commodities futures contracts. There could be several contributing factors. However, we believe the sector ETFs “capture” common equity beta due to the fact they are traded on exchanges along with other equities. ETF structures (which invest in commodity futures contracts) are easily traded, but the added liquidity might bring additional equity correlation/beta — the “financialization” of commodity futures.
Volatility, Flows/Positioning & Sentiment
Equity volatility continues to trend lower as emerging data signals the severity of the Omicron variant is mild. Spot VIX and near-term VIX futures dropped dramatically last week. The VIX closed at 18.69. Meanwhile, equities gained for the week with the S&P 500 (SPY) up 3.8% to an all-time high.
According to The Market Ear, positioning for options dealers flipped last week from being “short gamma” to “long gamma” which relates to delta hedging. TME on 12/7: “Less short gamma means less ‘destabilizing’ features from dealers as they don't need to sell lows and chase highs.” In our briefing two weeks ago, as we assessed the market sell-off, we discussed delta hedging and the influence of other non-fundamental and technical factors in Performance & Other Observations. To summarize, options dealers need to sell equities in declining markets and buy equities in rising markets when short gamma conditions exist; this amplifies market volatility and price moves in either direction. The opposite is true when long gamma conditions exist.
“Less short gamma means less ‘destabilizing’ features from dealers as they don't need to sell lows and chase highs.” The Market Ear, 12/7/21
COVID headlines — or “tape bombs” — are a continual destabilizing threat, but otherwise, equity volatility probably grinds lower into year-end in accordance with holiday-related seasonal trends.
The Market Ear recommended selling the VIX short amid the recent Omicron volatility spike, but now they are closing that position (or have already done so) and are looking for new opportunities to go long volatility. As a reminder, volatility can be traded as an asset class and “long volatility” trades tend to be viewed as “protection trades” since rising volatility usually correlates with equity sell-offs. On the other hand, the VIX is a mean-reverting asset, so it generally makes sense to sell volatility after it spikes higher, capturing premium income and benefiting from an eventual decline in vol. Obviously, shorting vol carries risk in the event that volatility continues to go higher.
See Portfolio Construction & Trading Ideas below for observations and insights related to “short volatility” strategies.
Alternative Assets/Strategies
Institutional and retail investors approach crypto/digital assets differently. Two weeks ago, Alternative Assets/Strategies referenced a report from Jefferies that contrasted the market views and implementation strategies of the two investor segments. In short, institutional investors tend to favor digital infrastructure and the broad ecosystem, but retail/private investors are more inclined to invest directly in cryptocurrencies.
Essentially, UBS summarized the institutional market view in its Chief Investment Office report dated 12/7/21.
Recent volatility, prompted a blunt assessment from UBS: “Highly speculative crypto tokens and coins can fall just as fast as they rise. Crypto coins and tokens are often held up as a portfolio diversifier or inflation hedge. This latest price crash undercuts that narrative. It has also illustrated how highly correlated crypto coins are to one another, making diversification challenging. Without credible fair value estimates, it is difficult for participants to derive a fundamentally sound and defensible view on prices. We view direct exposure in crypto coins and tokens as suitable only for highly risk tolerant and speculative investors, and don’t think they belong within a traditional financial portfolio.”
“Highly speculative crypto tokens and coins can fall just as fast as they rise… We view direct exposure in crypto coins and tokens as suitable only for highly risk tolerant and speculative investors…” UBS, 12/7/21
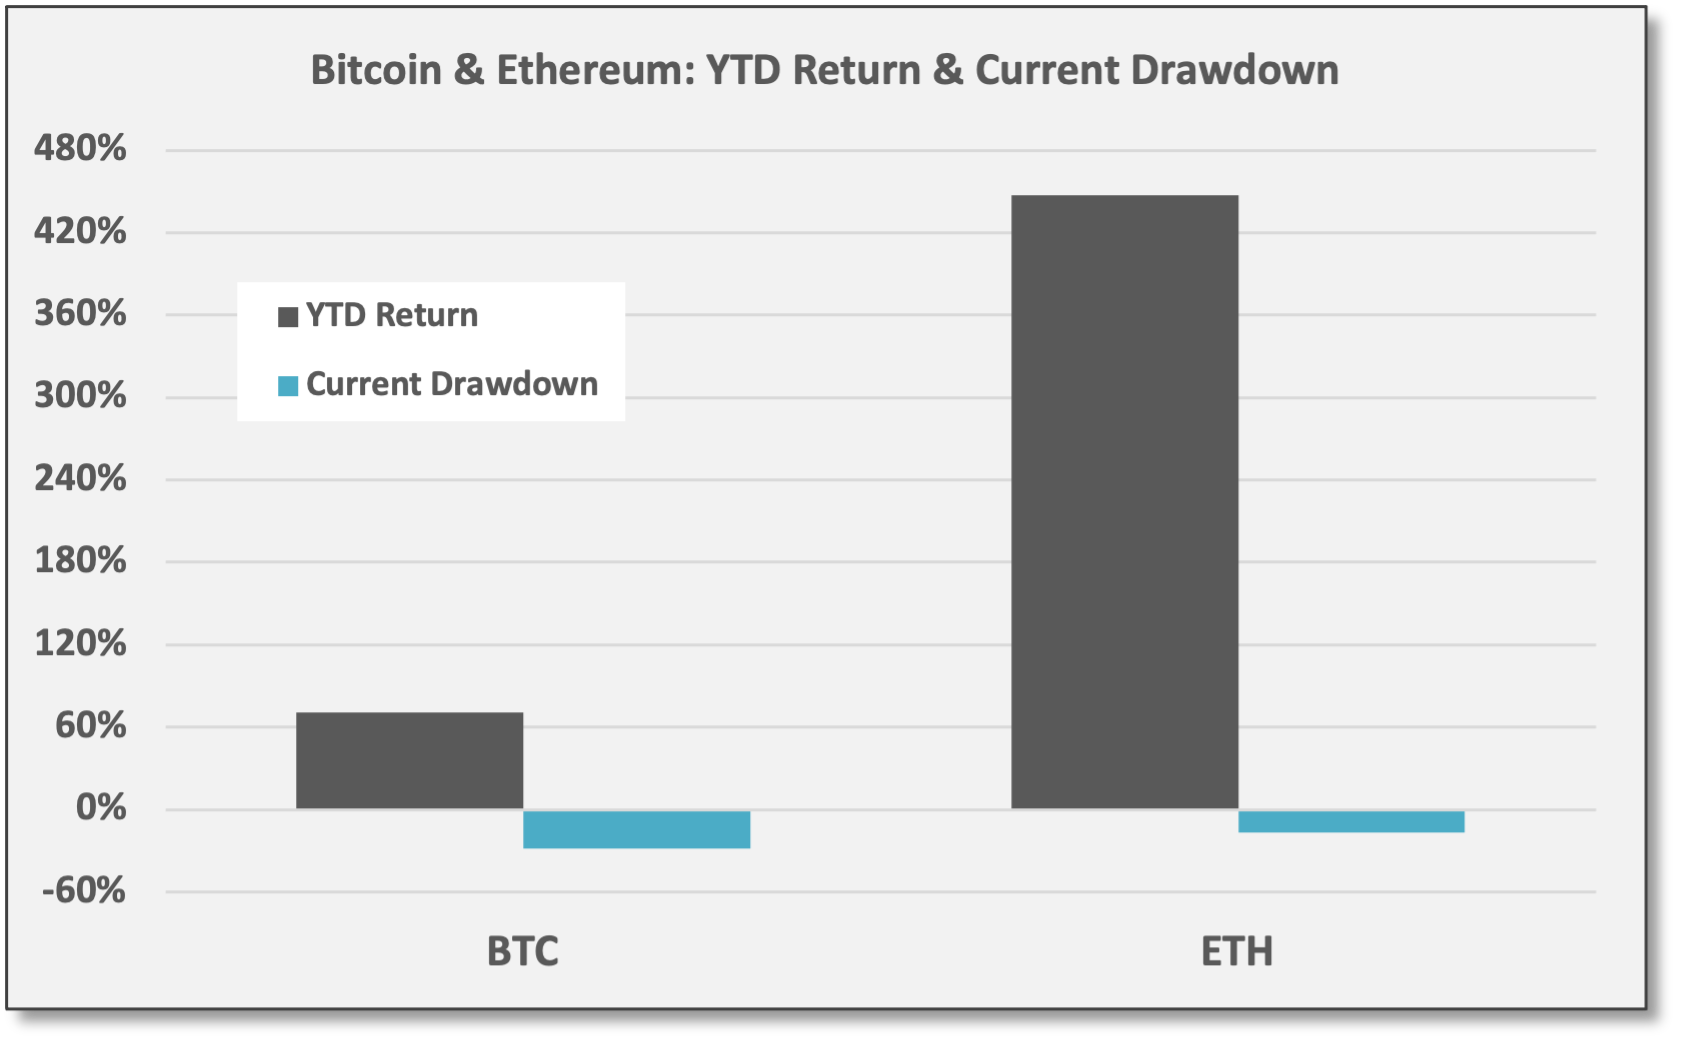
The two major cryptocurrencies — bitcoin (BTC) and ethereum (ETH) — are currently in drawdowns. BTC is down -28% and ETH is down -17%, but for context, the two cryptos still show substantial YTD gains. For 2021, BTC and ETH are up 70% and 447%, respectively.
Despite the harsh view towards direct crypto coin exposure, UBS sees opportunities across the broadly defined crypto/digital ecosystem. This captures the growing institutional consensus in our view. “We see opportunities in enablers and service providers who will build the infrastructure behind DLT [distributed ledger technology]. Our cautious stance on crypto speculation does not mean we are bearish on the adoption of digital assets or the underlying technology. We see an increasingly decentralized world, where more people and businesses rely on DLT-based applications. All else equal, this requires more hardware to validate these activities on the network. This includes application-specific integrated circuits (ASICs), applications processors, and graphics processing units (GPUs). Other enablers include software makers and data-center-related companies that will help build and maintain the overall infrastructure.”
“We see opportunities in enablers and service providers who will build the infrastructure behind DLT.” UBS, 12/7/21
UBS outlined the way various technology companies are expanding exposure to tap into opportunities across the digital ecosystem. “Platform companies who embrace DLT will unlock more growth. Payments platform Square [SQ] last week rebranded as Block, signaling its plan to expand its business via the blockchain. We think other established platform companies across industries like fintech, software, IT services, consumer services, supply-chain management, and insurance will seek to leverage DLT in the future. Financial services is an obvious area of application for DLT technology, with the potential to change how payments, trade finance and other transactions are managed. Many other industries can benefit from the cost-saving, efficiency gains, and service-level benefits of DLT, too.”
In other words, investors can access exposure to these potential growth segments through the common equities of companies developing the digital infrastructure. In theory, this should deliver a lower volatility and less concentrated approach with a higher probability for success, provided security selection is effective. However, the infrastructure approach probably offers less “to the moon” potential compared to investing in individual cryptocurrencies.

UBS concluded: “So, while we think investors should avoid highly speculative trade in digital coins and tokens like bitcoin, we see clear opportunities in the broader DLT opportunity set… Before turning to speculative activity in crypto, we think investors should first consider portfolio exposure to alternative investments which might be more investable or attractive on a risk-adjusted basis.”
Portfolio Construction & Trading Ideas
Short volatility strategies. For those looking to short the VIX, ProShares Short VIX Short-Term (SVXY) is an ETF that sells short VIX futures with an average of ~30 days to expiration. To clarify, the fund does not sell short the spot VIX as that is not feasible.

Keep in mind, the VIX is a volatile asset class. Effectively, SVXY is “non-leveraged” fund as it seeks to deliver 0.5x the return of its target VIX futures. Based on daily returns, SVXY shows an “average rolling-six-month correlation” of 80% to the S&P 500 (SPY) since inception. Over the trailing six months, the correlation is 86%, but the beta — sensitivity to changes in the S&P 500 — is substantially higher. SVXY shows an average rolling-six-month beta of 3.25 to the SPY with an equity beta of 2.54 over the trailing six months. For 2021, SVXY and SPY are up 41.2% and 27.1%, respectively.
Fund structures like SVXY are probably best utilized to express short-term trading views as opposed to being used as buy-and-hold assets.
What Others Are Saying
Dr. Harvey Risch, Yale School of Public Health, 12/6/21: “Overall, I’d say that we’ve had a pandemic of fear. And fear has affected almost everybody, whereas the infection has affected relatively few… By and large, it’s been a very selective pandemic, and predictable. It was very distinguished between young versus old, healthy versus chronic disease people. So we quickly learned who was at risk for the pandemic and who wasn’t. However, the fear was manufactured for everybody. And that’s what’s characterized the whole pandemic is that degree of fear and people’s response to the fear.” Note: Link to full article/video from The Epoch Times (paywall).
Bespoke, Morning Lineup, 12/6/21: “The optimistic (and plausible, but still far from confirmed) thesis is as follows: Omicron’s mutation makes it much more transmissible among both vaccinated and unvaccinated populations… But that higher transmission gets offset by lower lethality among both the vaccinated and unvaccinated as a function of viral evolution, helping push COVID towards a ‘steady-state’ low-lethality, highly-contagious endemic disease similar to the common cold.”
Aneta Markowska, Chief Economist, Jefferies, 12/10/21: “November CPI came in broadly in line with expectations, particularly given the whisper numbers which were skewed to the high side of consensus. Core inflation slowed from last [month] as did headline inflation. These numbers will still make for ugly weekend headlines, which is why President Biden tried to get ahead of the bad news yesterday. But, the report was not a surprise to Wall Street, which is breathing a sigh of relief that the numbers weren't worse… sticky housing inflation actually surprised on the downside, as did used car prices. This was partially offset by upside surprises in airfares, lodging, and apparel… sequential gains should to start to slow meaningfully in January and beyond. On y/y basis, we still expect core inflation to peak in February.”
Marko, Kolanovic, JPMorgan, 2022 Equity Derivatives Outlook, 12/8/21: “Our view is that 2022 will be the year of a full global recovery, an end of the pandemic, and a return to normal economic and market conditions we had prior to the COVID outbreak. In our view, this is warranted by achieving broad population immunity and with the help of human ingenuity, such as new therapeutics expected to be broadly available in 2022. This would result in a strong cyclical recovery, a return of global mobility, and a release of pent up demand from consumers (e.g., travel, services) and corporates (in particular inventory, CAPEX, and buyback recovery). We stress that this demand would happen in a backdrop of still-easy monetary policy (zero rates and incrementally smaller but positive quantitative easing). For these reasons, we remain positive on equities, commodities and emerging markets, and negative on bonds. We expect the outperformance of cyclical assets and value, recovery of riskier and more volatile assets, and headwinds for defensive bond proxies and market segments that benefited from the pandemic. Increases in bond yields, inflation and reopening should also set back parts of the market that benefited from extreme monetary accommodation and COVID, and whose valuations are at unsustainable speculative levels — such as bond proxies, low volatility strategies, electric vehicles, digital assets, lockdown beneficiaries, high-multiple growth stocks, and parts of ESG.”
Christopher Wood, Global Head of Equities, Jefferies, 12/9/21: “Meanwhile as the focus grows on how many rate hikes there will be in the US next year, never forget that the empirical evidence of the past many years is that the Fed follows the markets and not the other way round. A really hawkish Fed would clearly be extremely bearish for equities, particularly US equities given the valuations. But [we have] a very hard time viewing the current mob as being ‘hawkish’ in any way, shape or form… the Fed is unlikely to be as aggressive as in 2018 when Jerome Powell actually tried, to his then credit, to normalize US monetary policy before his infamous pivot...”
BlueBay Emerging Markets Credit Alpha Fund, 12/9/21: "As we look ahead to next week, the key event will be the Fed meeting where Chair Powell is expected to announce an increase in the pace of tapering. This would then give the Fed optionality over raising interest rates sometime in the second quarter of 2022 if inflation remains a major concern. This is perhaps the final risk event for markets to navigate in 2021 and, given it has now been well telegraphed, it may actually turn out to be a non-event. With equity markets back at the highs, we think investors will certainly be hoping that Powell strikes the right tone to avoid a spike in volatility in what will be an increasingly illiquid period in markets.” Note: BlueBay EM Credit Alpha is a long/short EM debt strategy. The fund was up 5.1% YTD as of 12/3/21 versus JPMorgan EM Bond (EMB) which was down -2.9%.
Corre Partners, 12/10/21: “Against a backdrop of a risk-on environment, the confluence of strong growth and complications from COVID are leading to a rapid change and resulting in numerous challenges for companies to address quickly and manage around — the semiconductor shortage that has temporarily dented global auto production is a good example. Companies are attempting to manage through these inflationary input pressures, temporary or not, by pushing price to hold margin with quite mixed success. This challenge is compounded by labor constraints, attrition, and reduced productivity that coupled with supply chain disruptions are stretching balance sheets. For most companies, these challenges have been manageable so far, but cracks are appearing with earnings disappointment and volatility. This backdrop is compounded for struggling businesses given lender patience and flexibility for underperforming companies is starting to wane and being replaced by a harder line that is restricting liquidity or pushing for an exit. When the economy came to a halt last year, banks confronted an unprecedented wave of credits in trouble, and for many companies, there was safety in numbers. This year, with fewer companies on the brink, banks are more apt to press companies for an outside solution as opposed to providing waivers, resulting in a greater number of companies seeking urgent financing solutions to get through a difficult period… This backdrop of rapid change, including an environment where monetary stimulus is slowly getting withdrawn and interest rates gradually rise, should continue to drive challenges and earnings volatility. This should also result in more stress, with an outsized impact on investment opportunities in the middle market for Corre.” Note: Corre operates an event-driven credit/equity strategy focused on middle-market opportunities. Frequently, Corre engineers restructurings for stressed credits. Corre Opportunities Fund was up 14.0% YTD as of 11/30/21 with beta-adjusted net exposure of ~50-60%.
We aim to deliver timely and relevant data/insights. To ensure continued full access to Coffee & Capital Markets, please consider joining our research-driven community as a paid subscriber.
This material is for informational and educational purposes only. All data has been compiled from sources believed to be reliable, but there is no guarantee of its complete accuracy.
US CPI rose 6.8% over the 12 months ending 11/30/21. Over the same period, the S&P 500 (SPY) gained 27.8%, the US Aggregate Bond (AGG) declined -1.3%, and a 60/40 balanced allocation would have increased 16.2%.
Based on breakeven yields as of 12/10/21 reported by Bloomberg.