


Weekly Briefing: 11/21/21


Performance & Other Observations
Equities struggled last week as is customary for options expiration (OpEx) week, but if the pattern holds, results should improve in the near term. Seasonal trends remain favorable into year-end and US equities tend to deliver gains during Thanksgiving week.
That said, the S&P 500 gained over 8% during the recent corporate earnings season and is already up over 9% for Q4, so a share of the positive seasonal performance has probably been pulled forward — along with retail sales in anticipation of year-end shipping delays.
“There’s not much we don’t like about this market… [but] the speculative fever also appears to be running hotter again.” Strategas Technical & Macro Strategy, 11/16/21
According to Chris Verrone at Strategas Research: “There’s not much we don’t like about this market — trends remain solid, momentum has broadened out again, and leadership still has a pro-cyclical tone to it — but with this, the speculative fever also appears to be running hotter again.” A few of Strategas’ sentiment signals are flashing “caution” including 10/20-day put/call ratios and the level of positive fund flows into US equities, while others — S&P futures positioning and investor surveys — are approaching caution levels. “We’ve never had much success making a sentiment call in November, December, January (the calendar is too potent), but this is a risk to put on the radar for 1H ‘22.”
At the least, all this probably suggests a selective approach for risk assets.
For the week: S&P 500 (SPY) squeezed out a modest gain of 0.4% last week, but there was wide dispersion across sectors and regions. Non-US markets declined: Developed Markets (EFA) and Emerging Markets (EEM) were down 1.3% and 2.1%, respectively. Commodities declined last week with WTI Crude (USO) down -3.9%; SPDR Gold (GLD) reversed its recent up-trend and was down -1.1%. In fixed income, interest rates stabilized after two weeks of vacillating up and down. High-quality bonds edged higher with the US Aggregate Bond (AGG) up 0.1%.
For Q4: US equities are so far dominating the global capital markets.
SPY is up 9.3%. Growth proxies are outpacing value: Nasdaq 100 (QQQ) is up 12.9% versus the Russell 2000 (IWM) with a gain of 6.4%.
Commodities have delivered positive returns and Gold (GLD) is up 5.1% based on perceptions as an inflation hedge.
Long-duration UST bonds (TLT) have outperformed with a 3.1% gain in Q3 with the yield curve flattening. Short/intermediate interest rates have moved higher (resulting in losses), but long-term rates are lower.

Sources: CCM, Koyfin

For 2021: Despite declines last week, Energy commodities and equities remain the top performers for 2021, benefiting from the post-COVID economic recovery.
WTI Crude (USO) is up 62.9% YTD.
S&P Energy (XLE) is up 49.1%.
MSCI Russia (ERUS), an energy-dominated market, is up 26.9%.
Despite a -16% drawdown since peaking on 11/9, bitcoin (BTC) is up 100.5% YTD, closing last Friday at 58,122. (Not included in chart below.)

Sources: CCM, Koyfin

Relative Value Spotlight
Bitcoin, TIPS, and gold are viewed as related assets based on perceptions as inflation hedges, but this narrative might be a matter of overfitting. In quantitative/statistical analysis, “overfitting” refers to a situation where data “explains” a relationship more than it should; a false explanation of sorts. Overfitting is a problem because it suggests a level of correlation that goes beyond reality. Multi-factor analytical models run the risk of overfitting, so they take steps accordingly to avoid or resolve this.
No doubt, some investors are allocating to bitcoin (BTC) on the premise that BTC will provide inflation protection. However, we suspect this is simply a “rationale” to justify an investment in a popular asset. Considering the massive divergence in price volatilities, grouping BTC as an “inflation hedge” with gold or TIPS seems disingenuous. We are not necessarily discouraging an investment in BTC, but we are challenging the “inflation hedge” view. We believe investment rationales should always be grounded in reality with a clear outline of the major risk/return drivers.
Instead of being classified as inflation hedges, BTC and other cryptocurrencies might be better viewed as speculative trading assets.
Attributing inflation-protection to BTC could be a gross exaggeration — a matter of overfitting so to speak — as momentum/flows seem to overwhelm any other factor betas such as inflation. Instead of being classified as inflation hedges, BTC and other cryptocurrencies might be better viewed simply as speculative trading assets. In this context, BTC prices should keep going up as long as there are more buyers than sellers.
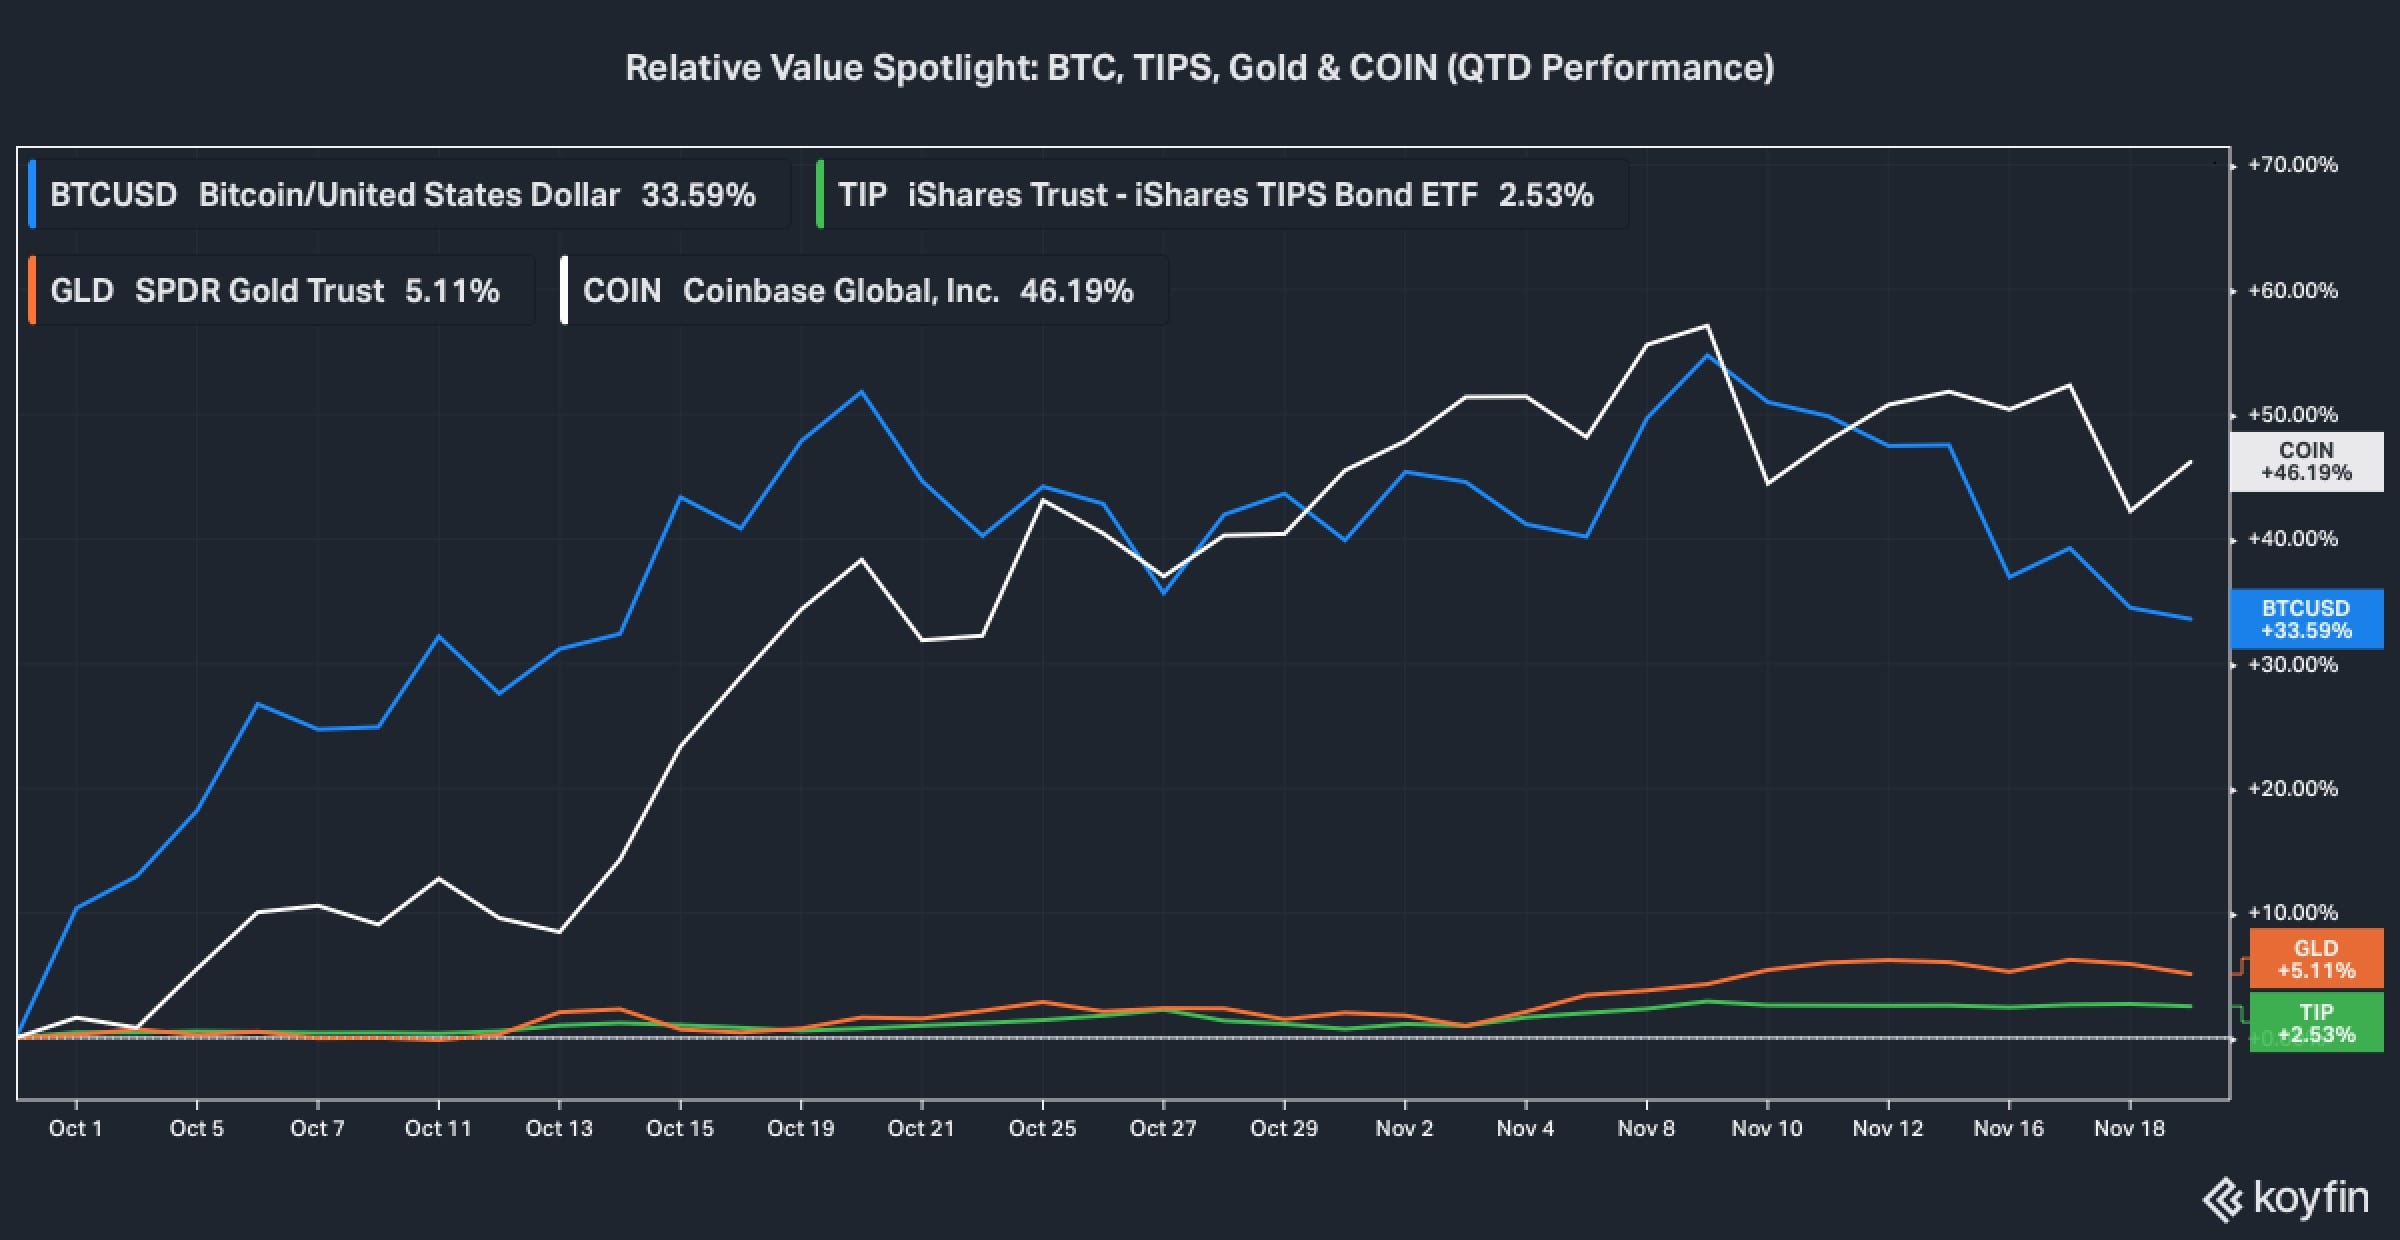
Moreover, Coinbase (COIN) might provide a more diversified approach to crypto exposure. Essentially, the Fintech company provides a trading/custodial platform for cryptocurrencies. Presumably, COIN should benefit over time as crypto gains acceptance and usage. Note: This is not a recommendation to invest in COIN, simply an observation. In full disclosure, we have exposure to COIN.
In closing, we share perspective from The Market Ear as of 11/17/21: “The crowd has piled into the long bitcoin trade as the inflation hedge, but what if BTC isn't the ‘optimal’ inflation hedge. Flows have been going into BTC and out of gold. Could this reverse?”
In the new year, the Weekly Briefing will be available ONLY to paid subscribers. To ensure continued full access to Coffee & Capital Markets, please consider joining our research-driven community as a paid subscriber.
Economic Data & Trends
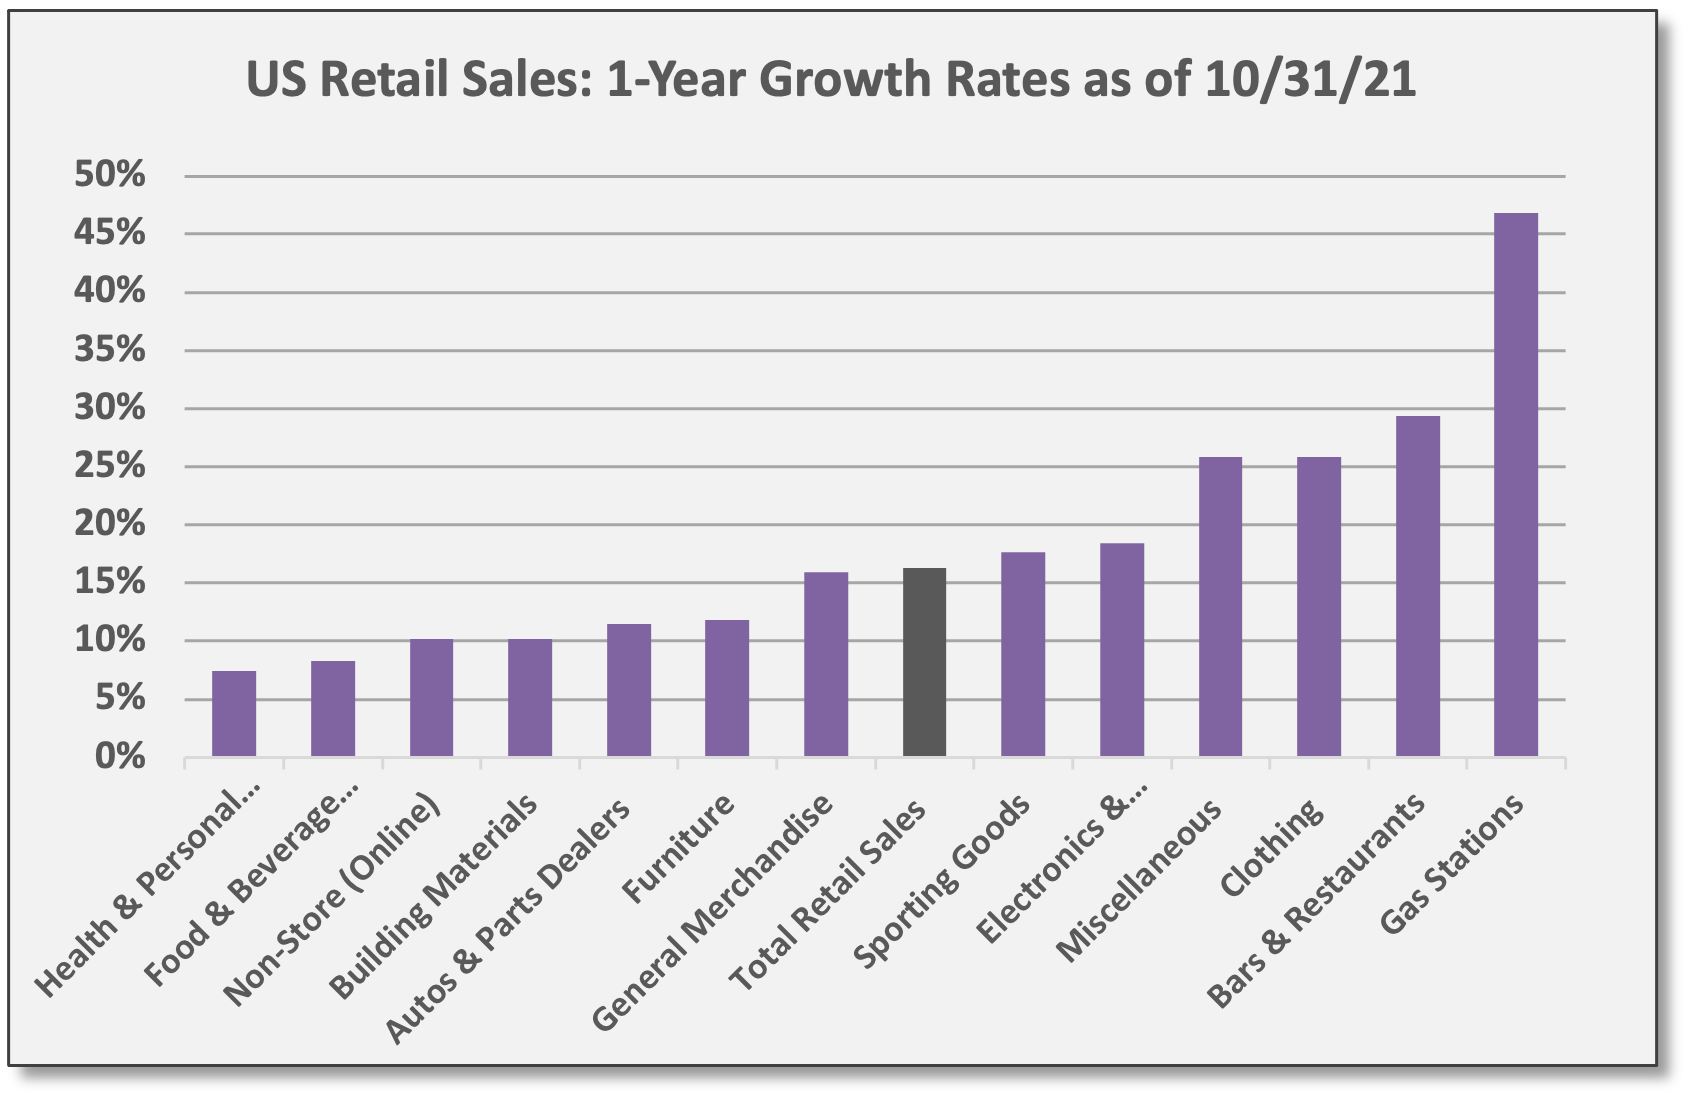
Retail sales gained 1.7% in October, beating estimates and posting the largest gain since March. CPI rose 0.9% in October, so rising prices explained part of the jump, but the sales gains were about more than just higher prices. Moreover, September/August sales were revised higher.1 Retail sales are up 19% for 2021 and 16% year/year. Retail sales are now 21% above pre-COVID levels.
Sales for bars/restaurants increased for the eighth consecutive month in October — the best run of monthly gains across 13 underlying categories. This is perhaps the best indicator of reopening and normalized spending. Behind gas stations (where sales are up 47% year/year), bars/restaurants show the next best year/year sales growth at 29%. Bespoke: “Clearly, there has been a ton of pent-up demand on the part of consumers for eating out, and even as the weather has turned colder, consumers don’t appear to have headed back into their homes.”

Behind the current jump in CPI, Jefferies sees demand-pull inflation which should drive a resurgence in Q4 GDP. “American exceptionalism was put into question over the summer months as Delta and supply chain issues depressed growth momentum. Fast-forward to today, and the US economy is making a strong comeback. In our estimate, real GDP growth is on track to re-accelerate to roughly 7% in Q4 (from 2% in Q3).”
“American exceptionalism was put into question over the summer months… Fast-forward to today, and the US economy is making a strong comeback... this should finally put to bed concerns about stagflation and supply bottlenecks capping growth.” Jefferies, 11/19/21
Currently, the Atlanta Fed GDPNow model estimates Q4 GDP at 8.2%. Jefferies continued: “If confirmed, this should finally put to bed concerns about stagflation and supply bottlenecks capping growth. It should also prompt a rethink of what's causing inflation in the first place. We've been arguing for some time that demand, rather than supply, is the dominant factor, and we believe evidence overwhelmingly supports that view. If supply chain disruptions were truly a culprit, demand should have already buckled under the weight of higher prices. Yet, there's been absolutely no pushback from the consumer. On the contrary, retail sales accelerated sharply in October, and there are reasons to expect further strength in November.”
Monetary/Fiscal Policy
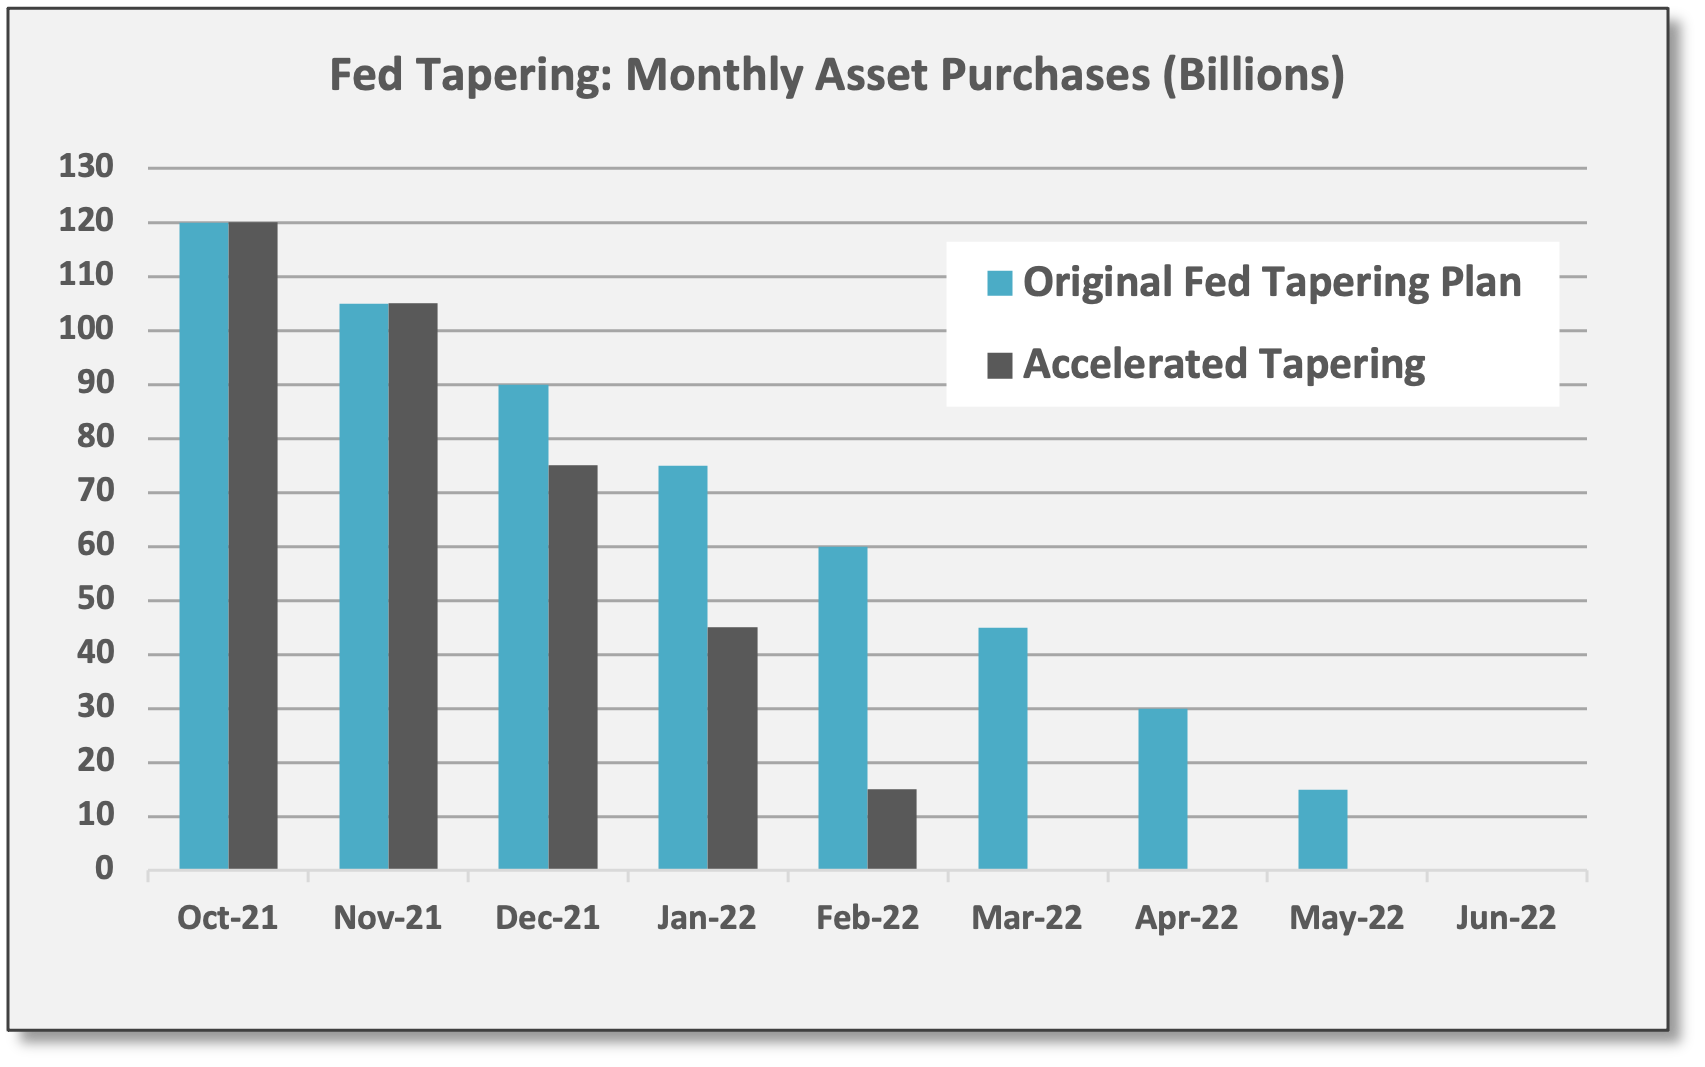
Expect a more aggressive tapering. At the FOMC meeting on 11/3, the Fed confirmed plans to commence “tapering” this month. Accordingly, asset purchases are being reduced by $15 billion per month — $10 billion in USTs and $5 billion in MBS. However, it looks increasingly probable the Fed will quicken its tapering pace after the October CPI surge.2 Indeed, Fed Chair Powell alluded to this possibility at the FOMC press conference earlier this month.
Assuming asset purchases are reduced by $30 billion per month beginning in December, the Fed’s quantitative easing program would be completed in March 2022 instead of June 2022.
When the FOMC meets again on 12/15, an accelerated tapering pace could be announced. Assuming asset purchases are reduced by $30 billion per month beginning in December, the Fed’s quantitative easing program would be completed in March 2022 instead of three months later in June. Jefferies expects this to be the case. It would then allow the Fed 3-6 months to manage market expectations before hiking rates — either in September or December 2022, or possibly at both FOMC meetings.
As of last Friday afternoon, Fed Funds futures showed an 83% probability of at least two rate hikes by December 2022. Expectations for rate hikes moved a lot before the November FOMC meeting and after the October CPI report, but were stable last week. We believe markets are now pricing the scenario outlined above.

Who will fill the void when the Fed stops buying bonds? As the Fed scales back its asset purchase program, pension funds could become larger buyers of USTs, particularly if rates move higher. This year, funding ratios for pensions have improved: The value of pension assets has expanded relative to the value of liabilities due to strong equity gains combined with rising interest rates.3 To “lock-in” favorable funding ratios, pension managers have been rotating away from overweighted equities and adding to underweighted bond allocations — immunizing pension liabilities in the process — according to a recent report from JPMorgan.
Additional UST/MBS purchases could flow from Japanese or European pensions as USTs offer yield advantages versus JGBs and Bunds, respectively. Currency hedging and related costs could be an issue for some foreign investors, limiting flows into USTs, but other foreign investors might choose to embrace US dollar exposure.

Similarly, risk parity and balanced mutual funds are potential sources of rebalancing flows, rotating from equities to bonds — based on equities outperforming bonds this year, although current equity betas for both strategies look to be in line with or slightly below average. In other words, portfolios do not appear to be too overweight/underweight to equities/bonds.
Regardless, there is potential for greater “price discovery” as the Fed — a non-economic buyer — exits the market. Through it all, rates are assumed to gravitate higher, but buying demand from the large asset pools referenced above could keep a lid on US interest rates.
Fiscal Policy: President Biden signed the $1.2 trillion infrastructure bill last week. Reportedly, the new bill targets roughly $550 billion for traditional infrastructure assets, including roads, bridges, railroads, ports, etc. The bill also supports funding for non-traditional infrastructure, including broadband communications. According to Jefferies, US government spending on “non-defense structures” is running at 1.6% of GDP, the lowest level since 1948, so infrastructure spending is justified if it targets the right areas and gets implemented efficiently.
Assessing the real cost and benefits of such legislation is difficult, especially since spending will be implemented over a period of years. Judging by the numbers, however, the legislation is expected to have a relatively limited impact on federal spending and deficits over the next decade based on CBO4 scoring. For additional analysis on the economic impact of the new program, please refer to Monetary/Fiscal Policy in our weekly briefing dated 11/7/21.
As an aside, Democrats in the House passed the next phase of the Biden agenda last week: A spending plan approaching $2 trillion, including green initiatives, tax changes, and other initiatives. However, progress for the partisan bill seems improbable in the Senate, including opposition from moderate Democrats.
Fixed Income, Rates & Credit
Last week, interest rates stabilized after two weeks of vacillating up and down surrounding the FOMC meeting and the October CPI report. High-quality bonds edged higher as interest rates inched lower: US Aggregate Bond (AGG) was up 0.1%. Long-duration bonds, the most sensitive to rate moves, gained the most with UST 20+ Year (TLT) up 0.7%. The UST 10-year closed at 1.54%, down four basis points for the week. Otherwise, the US dollar (USDU) was the top-performing with a gain of 0.9% — based on the premise that a Fed policy shift (tapering plus rate hikes) with lift real rates. Meanwhile, spread strategies declined last week as HY credit spreads moved a bit wider and Emerging Markets debt suffered losses.
For Q4: Safe-haven assets have outperformed across fixed income.
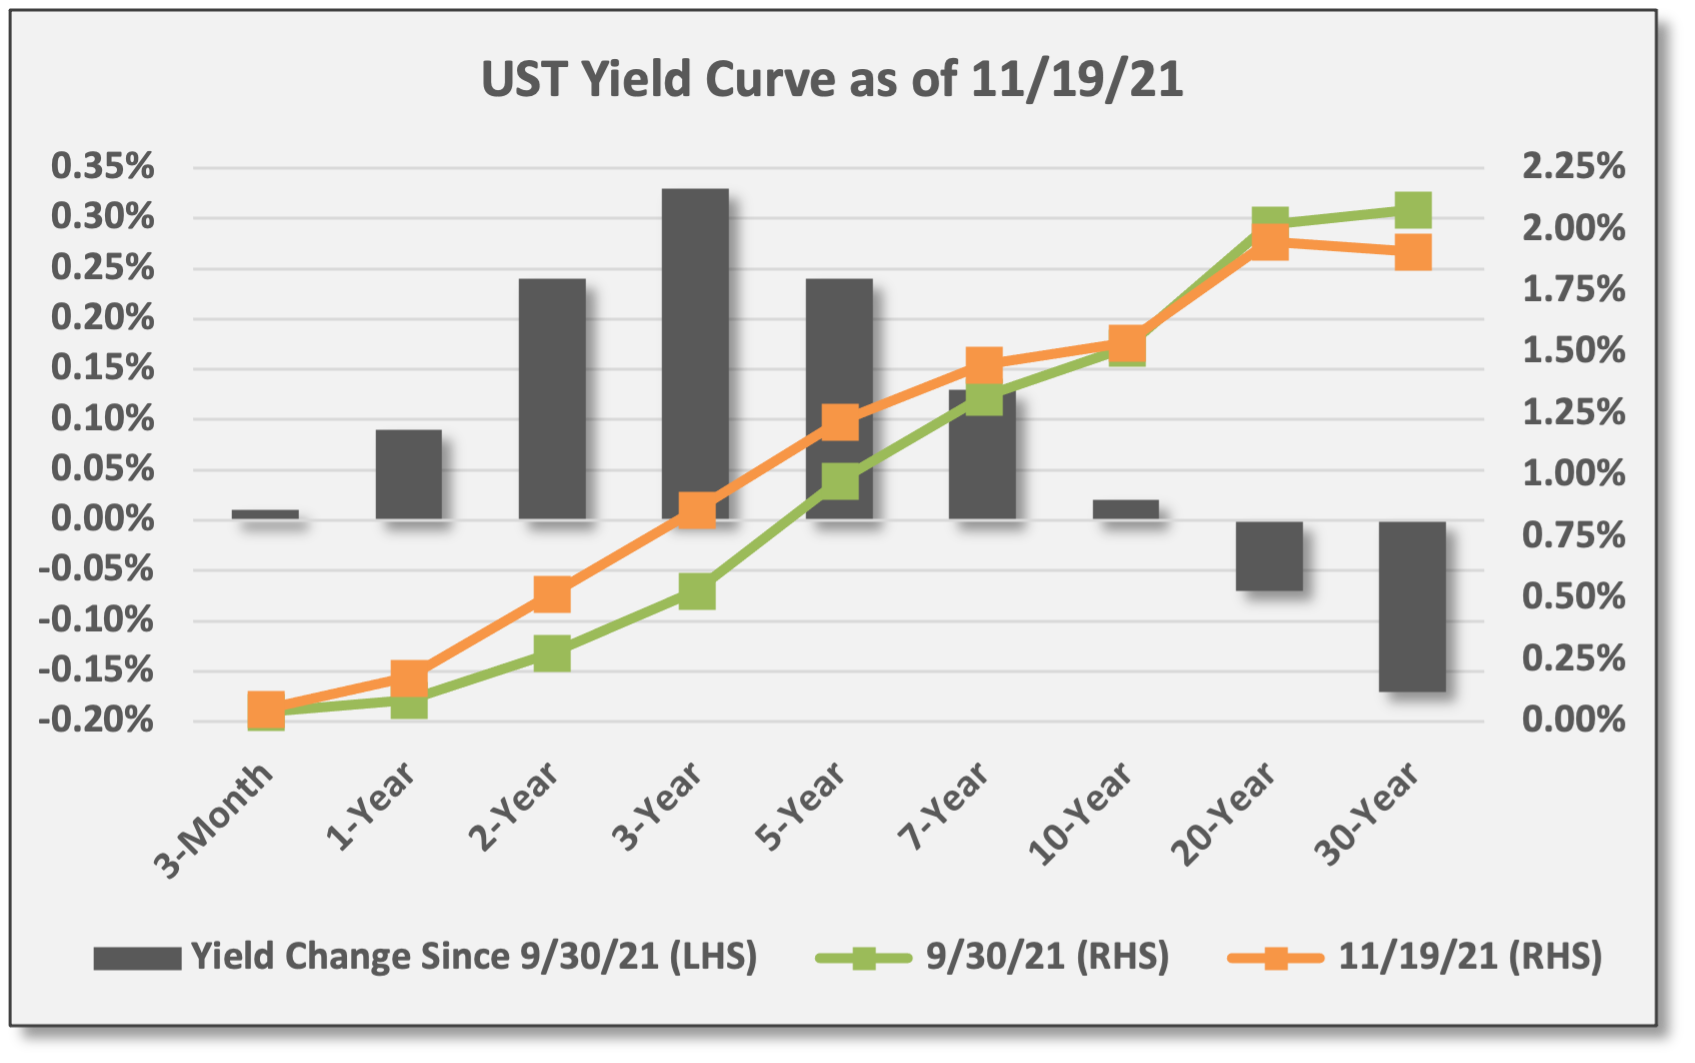
Long-duration UST 20+ Year (TLT) has gained 3.1%. Since 9/30, UST 30-year yields have dropped 17 basis points from 2.08% to 1.91%. TLT has a duration of ~19.0 years. By comparison, the AGG has a duration of 6.5.
Inflation-protected USTs have also delivered gains. TIP is up 2.5% in Q4.
But high-quality short/intermediate bonds have been flat-to-lower in Q4 as rates at that point along the yield curve have moved higher based on rising inflation and expected rate hikes. The US yield curve has flattened in Q4.

Sources: CCM, Koyfin 
Sources: CCM, treasury.gov

For 2021: With a few exceptions, high-quality bonds have mostly delivered negative returns, but growth-sensitive high-yield corporates have produced gains.
US Aggregate Bond (AGG) is down -1.7% YTD. UST and related agency securities comprise 53% of the AGG, investment-grade corporates are 25%, and mortgage-backed securities (MBS) are 22%. High-quality has underperformed with nominal interest rates moving higher this year.
UST Inflation-Protected Securities (TIP) are the top performer for 2021 with a gain of 5.8%. Despite interest rate duration of 8.4 years, TIP investors are compensated for increases in inflation as bond principal is adjusted for changes in CPI. Over the last year, US CPI is up 6.2%.
US dollar is up 4.8% YTD. Essentially, the USD is a relative value trade versus other currencies. We include the dollar in our fixed income summary because it brings safe-haven attributes similar to UST securities — including negative correlation during crisis periods for equities — although the USD (effectively) has zero rate duration. Thus, the USD tends to outperform during global “risk-off” periods, but the dollar is also influenced by other factors. In 2021, the USD has benefited from positive fund flows as US markets delivered superior economic growth, robust equity performance, and relative policy stability.

Sources: CCM, Koyfin

Breakeven yields inched lower last week. Comparing yields from nominal USTs and inflation-protected TIPS, the market-based forecast for inflation (CPI) is 3% over the next five years.

US/Global Equities
For the week, the S&P 500 (SPY) squeezed out a modest gain of 0.4%, but there was wide dispersion across sectors and regions. Market breadth weakened a bit with the S&P 500 Advanced/Decline moving lower, so there was narrow leadership and the average stock declined last week.
US large-cap quality/secular growth gained last week with Nasdaq 100 (QQQ) up 2.4% with big contributions from TSLA, NVDA, AAPL, AMZN. Inside the S&P 500, seven sectors declined and three gained: Energy (XLE) was down -5.0%, but Consumer Discretionary (XLY) gained 3.7%.
Non-US markets declined: Developed Markets (EFA) and Emerging Markets (EEM) were down -1.3% and -2.1%, respectively.
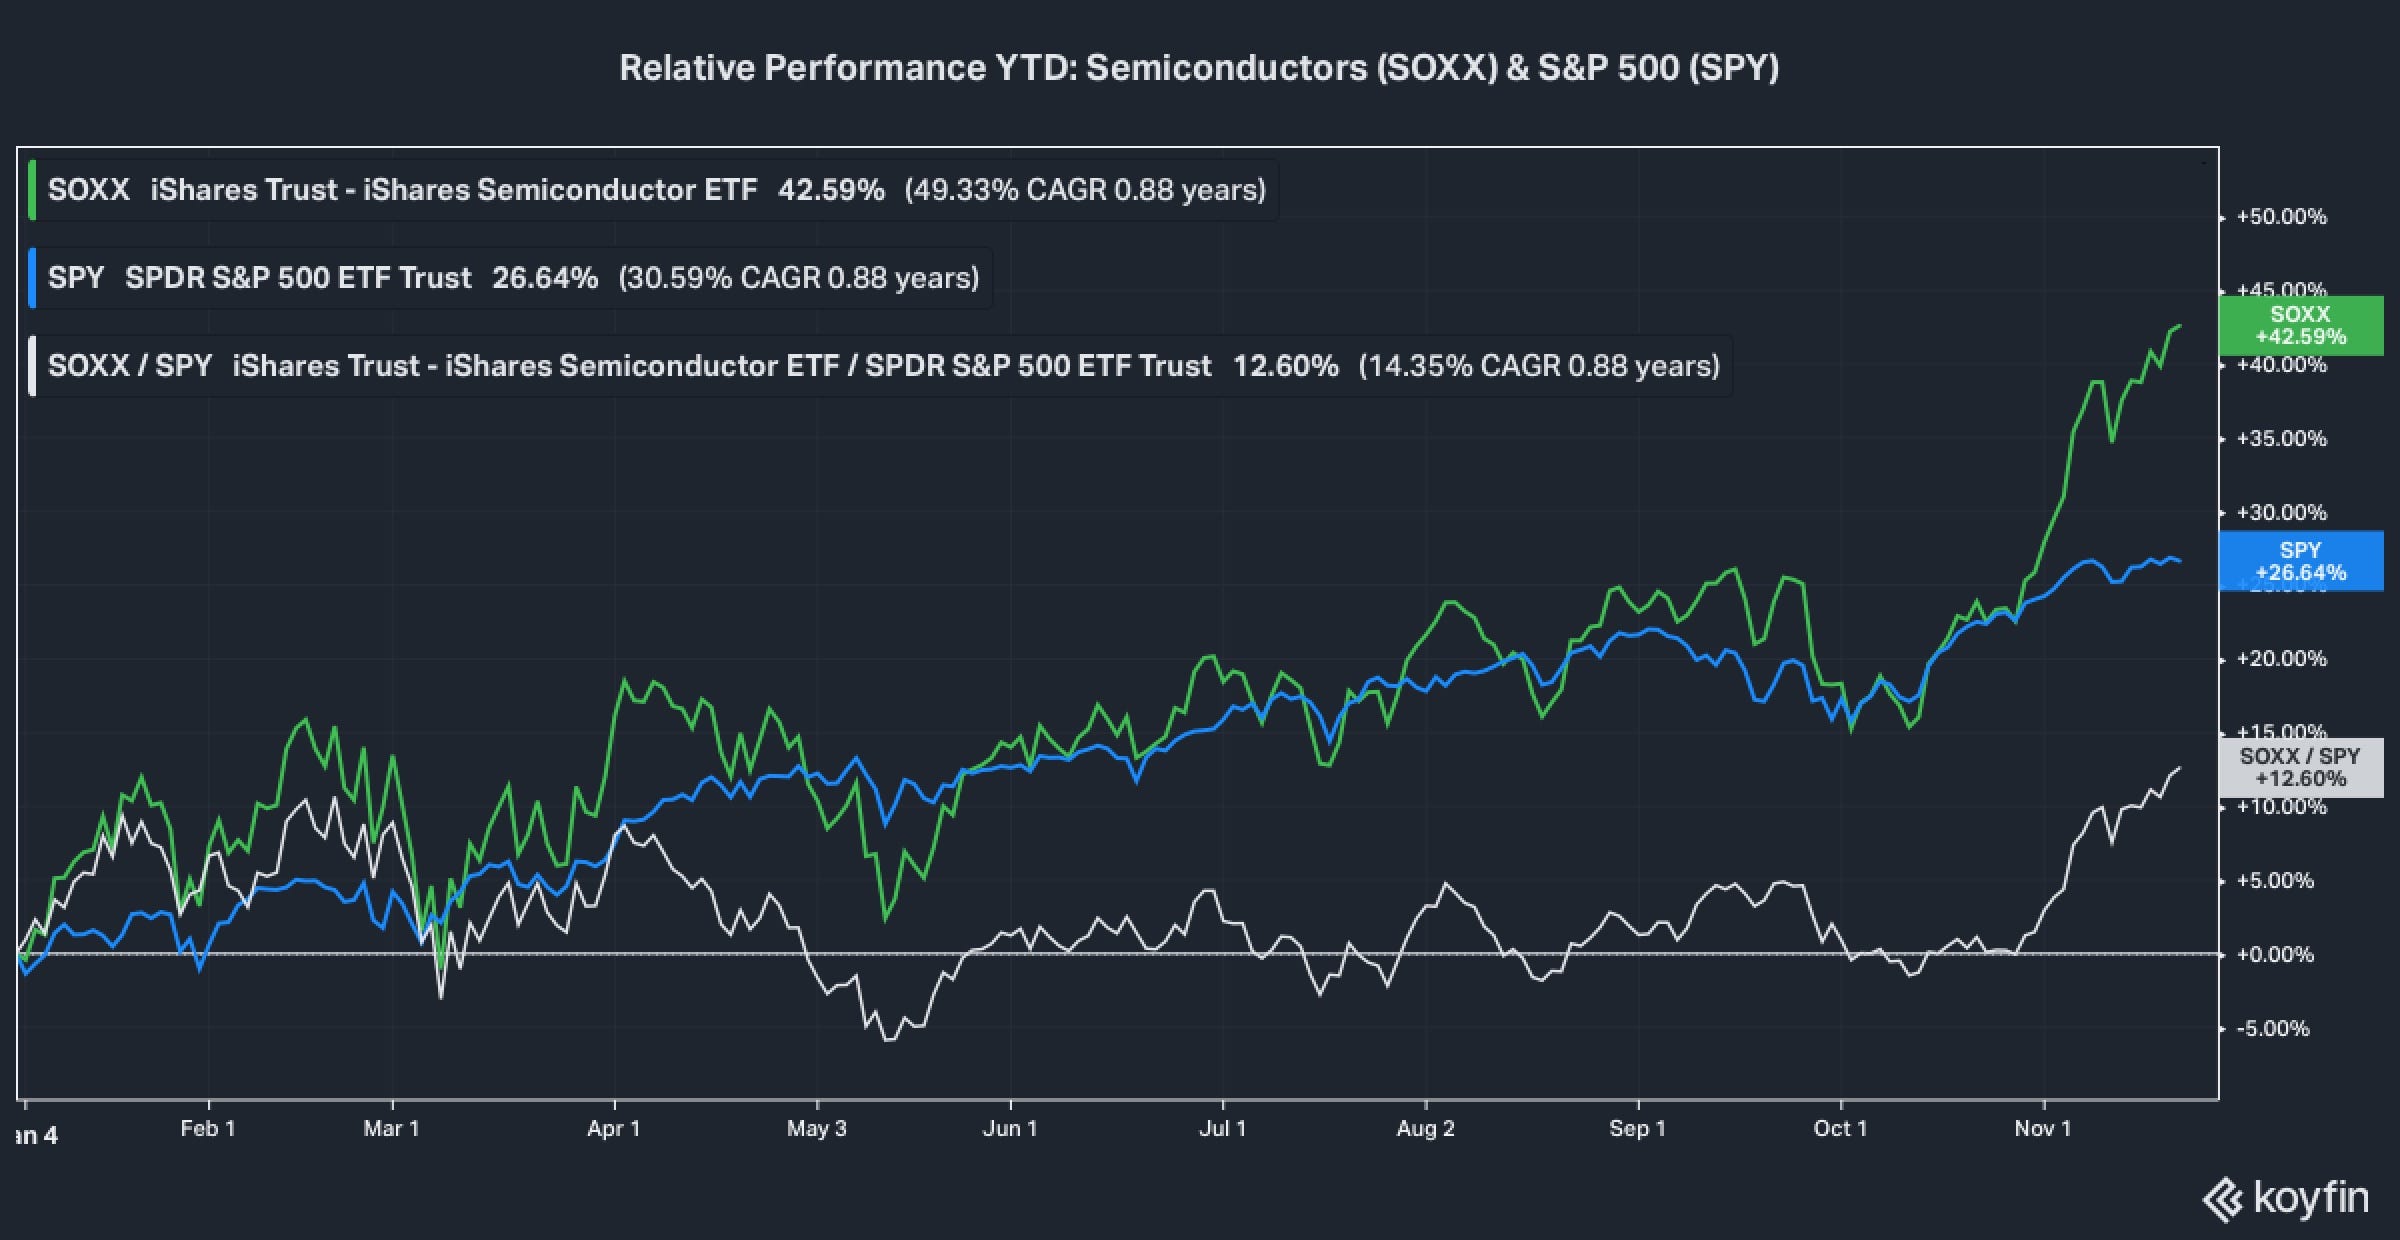
Among US industry groups, Semiconductors (SOXX) gained 2.7%. Bespoke views semiconductors as a leading indicator for the S&P 500. Semiconductors are ubiquitous as a component in so many products, including both secular/growth and cyclical/value industries. On this basis, SOXX can be viewed as a core holding, deserving of an overweighted allocation in most equity portfolios. Since late October, semiconductors have reasserted their leadership versus the S&P 500 (chart below).

Sources: CCM, Koyfin
For Q4: US equities are dominating non-US markets and quality/secular growth is beating cyclical/value.
SPY is up 9.3% in Q4. Developed Markets have delivered mostly low-single-digit returns. In Emerging Markets, energy/materials-oriented economies have declined. Taiwan (EWT) — with ~60% allocated to the IT sector and ~40% in semiconductors — is the best performing non-US market with a gain of 6.8%.
In the US, growth proxies are outpacing value with the Nasdaq 100 (QQQ) up 12.9% versus the Russell 2000 (IWM) up 6.4%. Also, Russell 1000 Growth (IWF) is outpacing Russell 1000 Value (IWD) with a gain of 12.8% versus 4.7%, respectively.
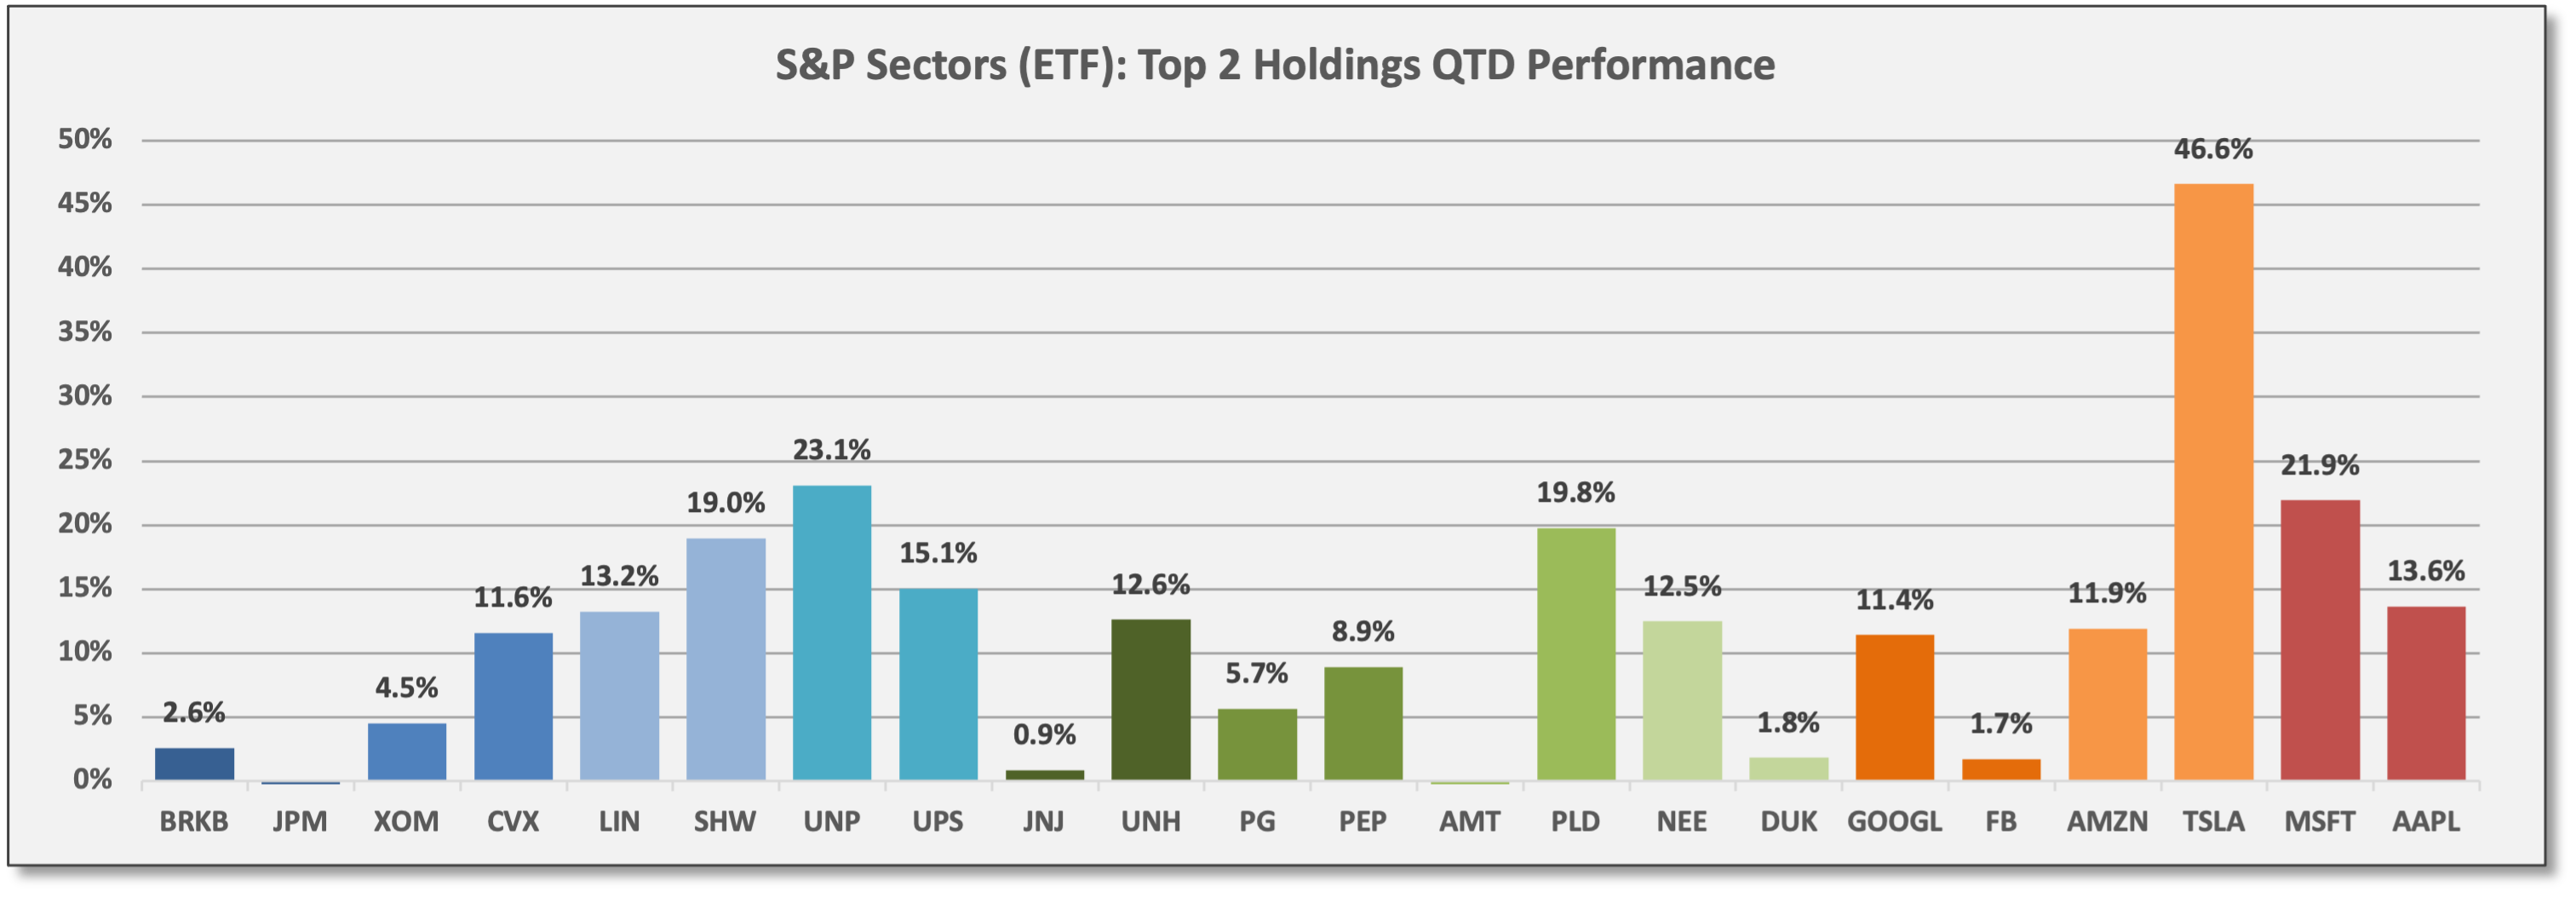
Similar growth > value themes are evident across S&P 500 sectors with Technology (XLK) and Consumer Discretionary (XLY) up 17.8% and 14.7%, respectively.

Sources: CCM, Koyfin 
Sources: CCM, Koyfin (Color-coded to match sectors above.) 
Sources: CCM, Koyfin


For 2021: US markets are leading and value-oriented sectors are still the top-performers, but growth sectors are closing the gap with strong Q4 performance.
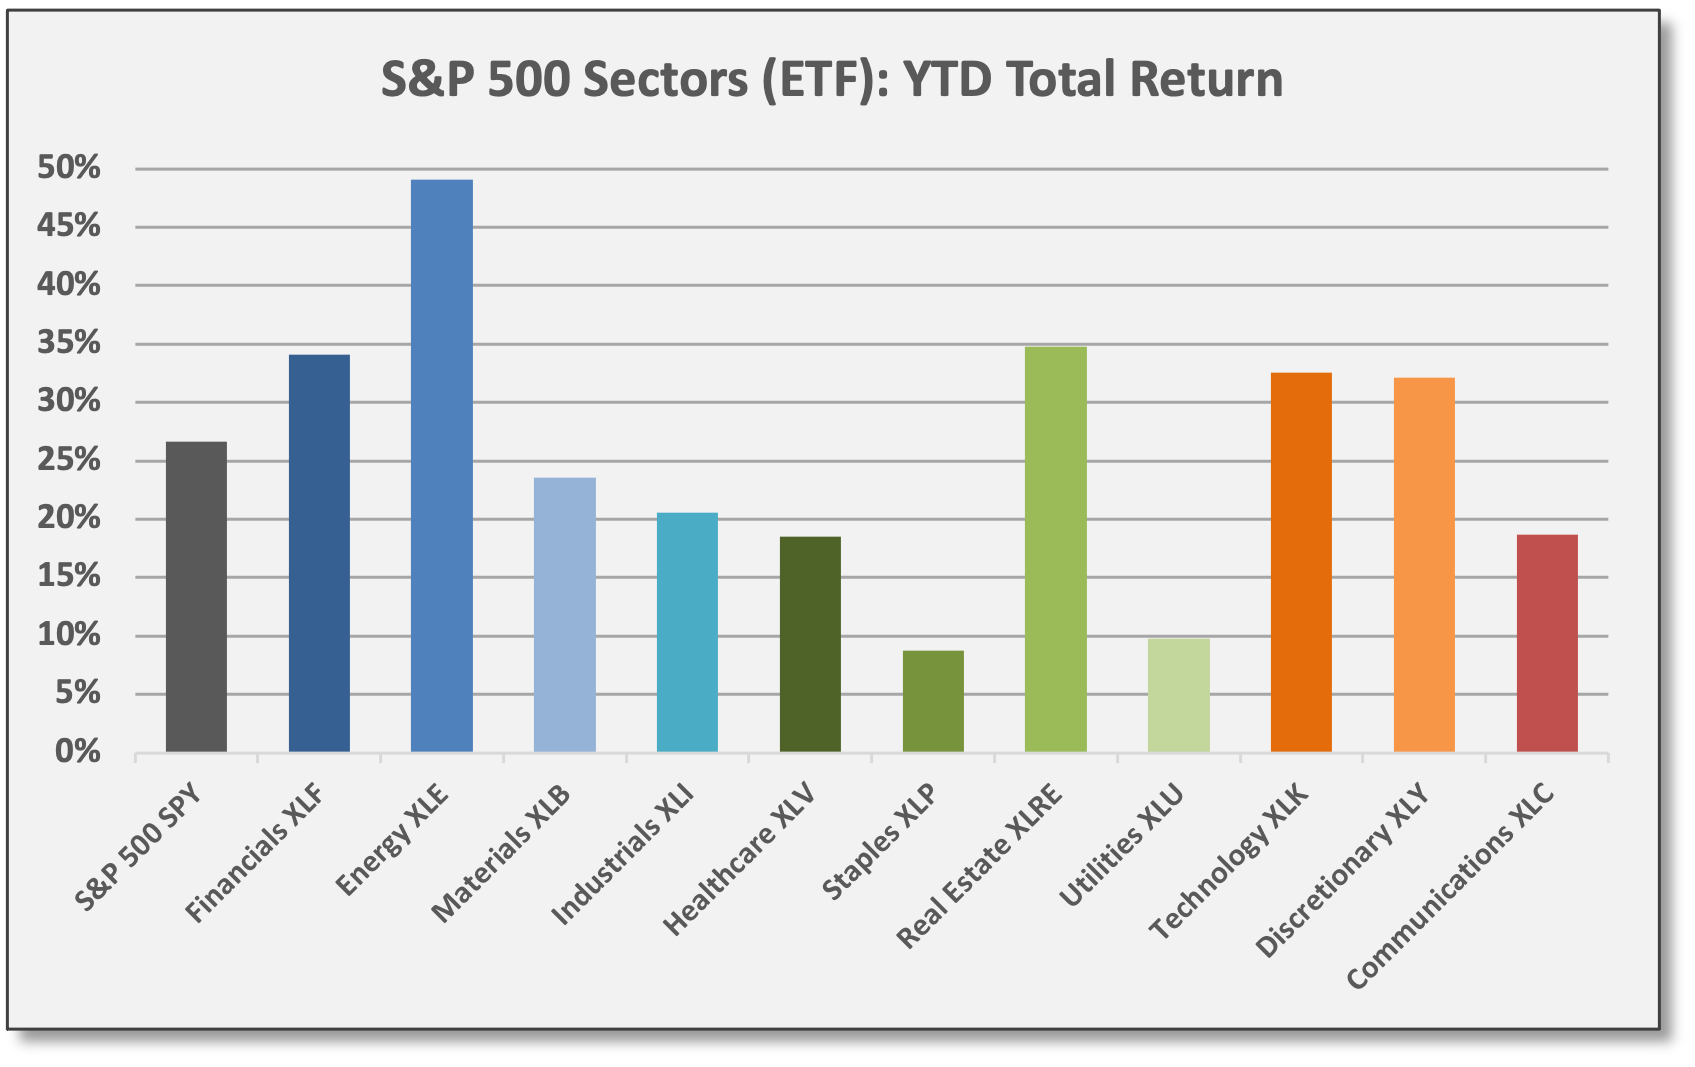
For the S&P 500, all sectors are positive YTD. Energy (XLE) and Financials (XLF) remain the leaders with gains of 49.1% and 34.1%, respectively. Defensive/yield-oriented sectors have lagged, but Real Estate (XLRE) is the exception with a gain of 34.8% — largely due to growth-oriented digital communications exposures. Time to rethink the narrative for XLRE?
From a US style perspective, small-cap cyclical/value has outperformed on the strength of Financials and Energy. Russell 2000 Value (IWN) is up 30.6% YTD; banks are up 44% YTD with a 15% weighting and oil/gas shares are up 102% with a 5% weighting. In large-caps, growth has outperformed: Russell 1000 Growth (IWF) is up 28.7%.
From a global vantage point, the USA/S&P 500 (SPY) leads with a gain of 26.6% in 2021. Developed Markets (EFA) are up 11.6%. Emerging Markets (EEM) are down -1.0%, but returns are dramatically dispersed: Brazil and China are down -15.0% and -20.1%, respectively. By contrast, Russia (ERUS), Taiwan (EWT), and India (INDA) are up 26.9%, 24.7%, and 23.3%, respectively.

Sources: CCM, Koyfin 
Sources: CCM, Koyfin 
Sources: CCM, Koyfin


During the Q3 earnings season, the S&P 500 (SPY) gained 8.2%. US earnings season “ended” last week when Walmart (WMT) reported results. From a colloquial standpoint, corporate earnings season covers the period between JPMorgan (JPM) and Walmart. For Q3, this stretched from 10/12 to 11/16. Obviously, corporate reports are ongoing, but the period referenced covers ~95% of S&P 500 companies.
Since 2010, only two other earnings seasons have delivered better performance according to Bespoke.
Assessing Q3 fundamentals, the S&P 500 showed EPS gains of ~40% year/year on revenue gains of ~18%. Europe and Japan showed EPS gains of ~44% and ~39%, respectively, yet foreign equities continue to lag the USA. That underperformance was the case during the Q3 earnings season (illustrated below) and it’s also been true for 2021.
US equities have delivered persistent outperformance in recent years, probably due to enduring structural factors — more innovation, more global industry leaders, greater ROE, management teams dealing with problems more swiftly/decisively, more monetary/fiscal support — but various research groups continue to highlight non-US markets. They seem to cling to the idea of mean-reversion, but we question the basis for mean-reversion where structural advantages exist.
By emphasizing US structural advantages, we are not suggesting non-US opportunities be ignored, but global industry leaders are mostly concentrated in the US, so a strategic bias to US equities seems rational.
Bespoke: “With the end of the year nearing, we’re approaching the season of year-ahead outlooks, and recently it seems as though every year is a similar theme — buy international stocks on expectations that they are due to outperform following years of underperformance.” By emphasizing US structural advantages, we are not suggesting non-US opportunities be ignored, but global industry leaders are mostly concentrated in the US, so a strategic bias to US equities seems rational.

Retailers were prominent last week with results reiterating a message of strong consumer demand. Company-specific highlights from last week:
Walmart (WMT): Net income declined 40% versus a year ago; EPS were lower by 38%, but beat analyst estimates by 4%. Input costs were higher in Q3, but instead of raising prices, WMT took a hit to profit margins. Revenues beat estimates with a gain of 4%; US transactions volume increased 6%. Bespoke: “Contrary to what we have generally heard this earnings season, WMT is fighting inflation to better the customer experience and gain market share. Whereas most companies seek to maintain gross margins, WMT management has decided to take the temporary hit…” In Q3, WMT paid $1.5 billion in dividends and repurchased shares valued at $2.2 billion. WMT is the #4 holding in S&P Consumer Staples (XLP). WMT declined 3.6% last week, but is up 2% QTD. For 2021, WMT is flat.
Target (TGT): Net income increased 47% year/year and EPS were up 51%, beating estimates by 8%. Revenues were up 13% year/year also beating estimates. Transaction volumes were up 13%. Margins were modestly lower due to merchandise-sourcing expenses, supply-chain issues, and higher freight costs, but TGT avoided raising prices. Bespoke: “Although this will certainly impact margins in the near-term, the general idea is that loyalty to the consumer will result in long-run benefits through market share gains.” TGT is the #8 holding in S&P Consumer Discretionary (XLY). TGT declined -3.3% last week, but is up 10% QTD and 44% YTD.
Home Depot (HD): Net income increased 20% year/year and EPS were up 23%, beating analyst estimates by 15%. Revenues were up 10% year/year also beating estimates; volumes were down, but price increases more than made up the difference. Bespoke: “HD decided to push costs onto consumers instead of taking the margin hit due to the elevated level of demand for their products.” HD is the #3 holding in S&P Consumer Discretionary (XLY) and the #11 holding in SPY. HD gained 9.7% last week and is up 25% QTD and 56% YTD.
Lowe’s (LOW): Net income increased 174% year/year and EPS were up 200%, beating estimates by 16%. Revenues were up 3% year/year also beating estimates. LOW raised sales and margin guidance into year-end. In Q3, LOW paid $563 million in dividends and repurchased shares valued at $2.9 billion. LOW is the #6 holding in S&P Consumer Discretionary (XLY). LOW gained 5.6% last week and is up 24% QTD and 58% YTD.
Nvidia (NVDA): Net income increased 84% year/year and EPS were up 83%, beating estimates by 6%. Revenues increased 50% and margins expanded. Bespoke: “An investment in NVDA is an investment in the future of technology. Not only does NVDA make chips that are essential to the gaming, computer, and smart phone industries, but the company is also building out and successfully innovating cutting-edge technology. In terms of metaverse development, NVDA seems to be at the forefront… All-in-all, NVDA has exposure to multiple growing and emerging branches of the economy, and will likely be a prominent player as widespread digitalization of the economy continues.” NVDA is the #3 holding in S&P Technology (XLK) and the #8 holding in SPY. NVDA gained 8.5% last week and is up 59% QTD and 153% YTD.
Commodities & Real Assets
For the week, diversified commodities declined.
Global growth-sensitive Energy (DBE) and Base Metals (DBB) declined -4.0% and -0.7%, respectively. WTI Crude (USO) declined -3.9%; WTI spot futures closed at $75.94 per barrel.
Even defensive Precious Metals (DBP) declined -1.5% with SPDR Gold (GLD), reversing its recent up-trend and dropping -1.1%. Gold spot futures closed at $1854.30 per ounce.
Agriculture (DBA) gained 1.6% last week. Coffee futures — the top weighting at 14% — gained 6.3%, accounting for ~90 basis points of positive attribution. First a drought, then an early frost in Brazil combined with global supply-chain issues have hindered coffee supplies this year, according to The Weather Channel.
For Q4: Leadership in commodities has run counter to YTD trends. Gold and precious metals have outperformed as an inflation hedge, gathering positive fund flows from momentum buyers.
Precious Metals (DBP) and SPDR Gold (GLD) are up 6.4% and 5.1% for Q3, respectively. Silver futures — a 20% weighting in DBP — are up 10.9% for Q3.
Global growth-sensitive Energy and Base Metals have lagged in Q3, but are still posting positive returns.

Sources: CCM, Koyfin

For 2021: Energy commodities remain the top performer.
Energy (DBE) is up 58.5% YTD. WTI Crude (USO) is up 62.9%.
Base Metals (DBB) and Agriculture (DBA) have both delivered gains of ~24%.
Precious Metals (DBP) have declined -5.2% in 2021. Presumably, fund flows have been diverted into cryptocurrencies. Despite a -16% drawdown since peaking on 11/9, bitcoin (BTC) is up 100.5% YTD, closing last Friday at 58,122.

Sources: CCM, Koyfin

Perhaps the supply/demand imbalance in energy markets is dissipating. Falling energy prices could be an indication. Since peaking on 10/26, WTI crude prices are down -10%.
“While supply hasn’t kept up with demand since the COVID recovery got underway last year, output is definitely rising and may be enough to prevent further significant price gains for crude.” Bespoke, 11/16/21
At least for the near-term, production seems to be ramping up. According to Bespoke, “Within the global supply of crude and liquid fuels, all three major segments (US tight oil, OPEC, and the rest of the world) have been expanding production rapidly… while supply hasn’t kept up with demand since the COVID recovery got underway last year, output is definitely rising and may be enough to prevent further significant price gains for crude.”
Meanwhile, policymakers are discussing a possible supply injection from the SPR (strategic petroleum reserve). This might be reflected in current prices. Moreover, The Market Ear cited numerous sources pointing to poor liquidity conditions in oil markets, which amplifies both price gains and declines.
At this point, various commodities are trading measurably lower compared to their 2021 peaks. Crude oil, natural gas, and copper are trading at prices ~10-20% below their recent peaks and lumber prices are down ~60% from early this year. Moreover, the Baltic Dry Index shows shipping prices are ~55% lower versus peak levels in early October based on data provided by Bespoke. In other words, the big YTD gains in commodities are mostly behind us.
Volatility, Flows/Positioning & Sentiment
Fund Managers still overweight inflationary growth assets, according to the BofA Fund Manager Survey (FMS) for November. BofA surveyed 388 funds with $1.1 trillion in AUM. FMS responses were collected from 11/5 to 11/11, mostly before the surprise CPI surge was reported.
FMS expects corporate profits to turn higher in 2022. What to do with the additional cash flow? “Increase capital spending” is the top choice favored by 54% of fund managers. Separately, Jefferies expects a surge in capital spending — the most “sustained CAPEX cycle since the 1990s” — as corporations boost capacity and productivity potential in response to rising wages from labor shortages and to meet above-trend demand conditions.
BofA Fund Manager Survey:
Cash levels were reduced to 4.4% from 4.7%, so capital was deployed during the month, but as an indicator cash remains “neutral.” From a sentiment standpoint, cash > 5% is viewed as a “fear” indicator and a buy signal; cash < 4% is viewed as a “greed” indicator and a sell signal.
Relative to 10-year positioning averages, FMS is overweight inflationary/growth assets (Commodities, Financials/Banks, Technology, US equities) and underweight rate-sensitive assets (bonds, Utilities, Staples, EM equities/debt). However, fund managers reduced exposure to inflationary/growth assets in November (Energy, Industrials, Financials/Banks, Commodities).
Most Crowded Trades: (1) long US Technology equities, (2) long bitcoin, (3) long ESG-related assets, (4) short USTs.

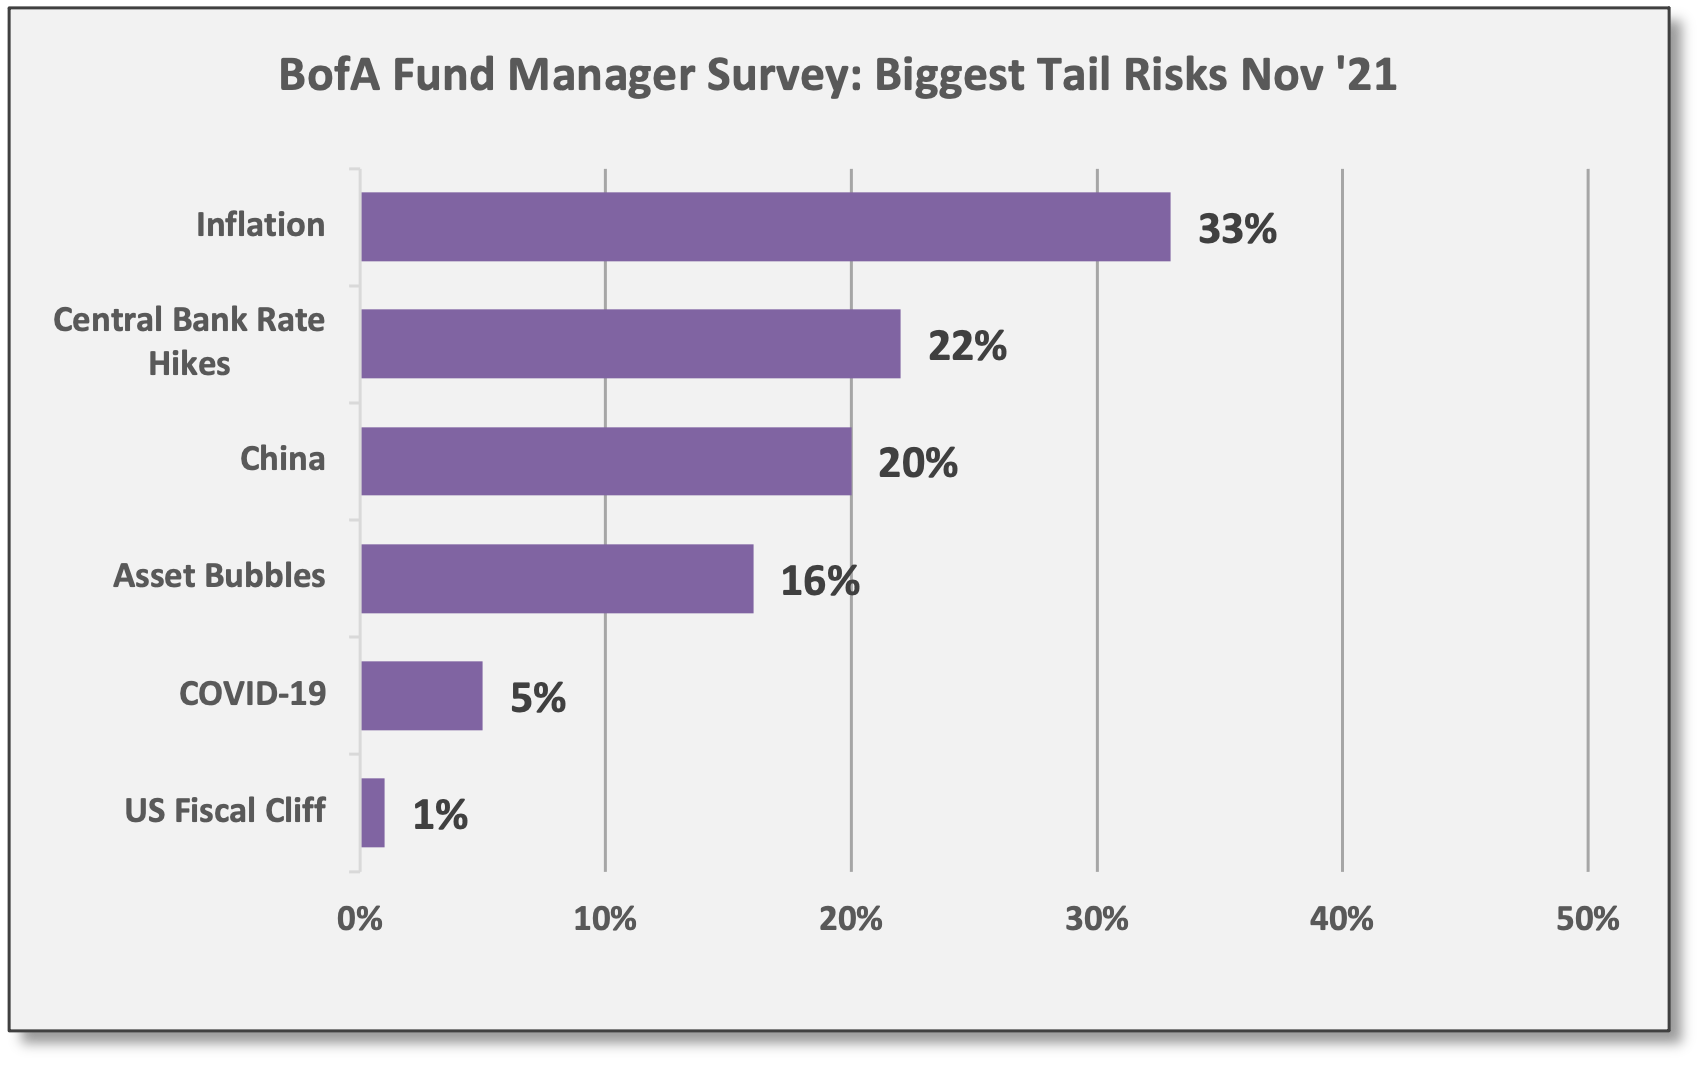
Sources: CCM, BofA Securities Biggest Tail Risks: (1) Rising US inflation, (2) Fed rate hikes, (3) China deleveraging and growth slowdown.

Sources: CCM, BofA Securities Contrarian Trades: Potential trades taking the opposite view versus the most prevalent/extreme positioning from the survey results: (1) Long bonds and short equities; (2) Long cash and short commodities; (3) Long EM and short US; (4) Long utilities and short banks. Essentially, all of these reflect scenarios where growth, inflation, and interest rates are falling (at least on a relative basis).

What Others Are Saying
Aneta Markowska, Chief Economist, Jefferies, 11/6/21: “There's been a lot of bearishness on the consumer given the stimulus cliff, soaring prices, and deteriorating sentiment. But, actions speak louder than words, and based on actual spending patterns, consumers seem to be feeling much better than they would have you believe.”
Bridgewater Associates, 10/19/21: “Even as supply disruptions and higher inflation persist, markets are discounting that they will soon subside... We disagree. While the headlines tend to focus on the micro elements of the supply shock (the LA port, coal in China, natural gas in Europe, semiconductors globally, truckers in the UK, etc.), this perspective largely misses the macro cause that is likely to persist and for which there is no idiosyncratic solution. This is not, by and large, a pandemic-related supply problem [because] supply of almost everything is at all-time highs. Rather, this is mostly an MP3-driven upward demand shock… The mechanics of combined monetary and fiscal stimulus are inherently inflationary: [Monetary Policy 3] creates demand without creating any supply. The MP3 response we saw in response to the pandemic more than made up for the incomes lost to widespread shutdowns without making up for the supply that those incomes had been producing… There are still large stockpiles of latent spending due to the transformative effects that MP3 has had on balance sheets and the ongoing incentive provided by extremely low real yields, and more fiscal stimulus is on the way… The gap between demand and supply is now large enough that high inflation is likely to be reasonably sustained, particularly because extremely easy policy is encouraging further demand rather than constricting it... There are not enough raw materials, energy, productive capacity, inventories, housing, or workers... Supply has recovered remarkably quickly [and] real goods production is now higher than it was pre-COVID. The issue is that demand has exploded, creating an imbalance of a magnitude that we haven’t seen since the 1970s.”
JPMorgan, Global Markets Strategy, 11/17/21: “How crowded is the inflation trade? At an asset class level, underweighting bonds and overweighting commodities are in our mind the main manifestations of the inflation trade. We believe that both of these trades are still attractive not only from a valuation but also positioning point of view.”
Raymond James, Portfolio Strategy, 11/18/21: “S&P 500 companies are wrapping up what has been a very strong Q3 earnings season. The key takeaways, echoed by major retailers this week, are persistent supply and labor challenges but not outweighed by the very strong demand backdrop — effectively elongating the recovery with delayed sales (rather than lost)... Valuation remains elevated but is acceptable as long as rates stay low and inflation moderates back to a ~2-3% level. The biggest risk over the next year (as we see it now) is if inflation proves sticky and investor sentiment shifts to a stance of belief that the Fed is behind the curve. We believe multiples will normalize over time, but not outweigh the earnings recovery — providing upside to equities... We maintain our balanced, but pro-cyclical stance (between technology-oriented and more recovery-oriented areas) to portfolio positioning and recommend using consolidation in favored stocks as opportunity.”
BofA Securities, The Flow Show, 11/18/21: “10-year US real rates now -4.6%, a level in the past 200 years that has been associated with panics, inflations, wars and depression, and a level today increasingly responsible for froth in crypto, commodities, and US stocks… financial conditions set to tighten via Wall Street and/or policy action; asset prices always driven by two simple things: rates and profits; in ’22 short rates to rise (QE to end, inverted yield curve a threat) and EPS to slow sharply…”
Morgan Stanley, 2022 Global Strategy Outlook, 11/14/21: “For 2022, we think that this 'hotter and faster' recovery continues, powered by strength in consumer spending and capital investment… Good growth and moderating inflation would seem like another version of 'Goldilocks,’ and for some assets we think that the backdrop does look benign. But we think that 2022 is really about 'mid-to-late-cycle' challenges: Better growth squaring off against high valuations, tightening policy, rambunctious investor activity, and inflation being higher than most investors are used to. Navigating these will be about finding an alignment of risk premiums and fundamentals. We think that this exists in Europe and Japan equities, [HY corporate bank] loans and junior securitized [credit] tranches, oil and US equity volatility, and the US and Canadian dollars. At the same time, we see plenty of challenges, including downside to the S&P 500 and US 10-year yields being well above forwards, and think that it is too early to turn bullish on EM assets.”
Christopher Wood, Jefferies, GREED & fear, 11/18/21: “[The] Delta wave has now clearly peaked in Japan and restrictions on activity have begun to be relaxed... Meanwhile, household savings have risen less because households have received big handouts, as in the case of, say, America, Britain, or Australia, but rather because consumers have reverted to saving amidst the prevailing uncertainty. The annualised household savings ratio increased from 2.2% of disposable income in 2019 to 12.1% in the four quarters to 1Q21 and was 8.4% in the four quarters to 2Q21... Household consumption is still 7.2% below the pre-COVID high reached in 3Q19... As a result, there is significant potential for Japanese consumers to increase spending should they so wish... Meanwhile, the new Japanese Government of Fumio Kishida, who replaced Yoshihide Suga as prime minister on 4 October, has reverted to type since it is expected to unveil yet another fiscal stimulus package… This is expected to exceed Y40tn in fiscal spending, reaching a near record level comparable to the COVID- triggered Y48.4tn emergency stimulus announced in April 2020 at the start of the pandemic. The pending stimulus package will also be much bigger than the Y15.4tn stimulus package in April 2009 following the global financial crisis... GREED & fear remains of the hope, but certainly not the conviction, that the growing evidence of the waning deflationary pressures will at some point prompt Japanese domestic institutions to allocate out of JGBs into Japanese equities... It is clearly going to take conviction that inflation has returned, or rather that deflation has ended, to trigger a change in mass psychology. But when that realization happens, this being Nippon, all of institutional Japan will re-allocate out of bonds to equities at the same time. In this respect, the Japanese stock market has the potential to be one of the biggest long-term beneficiaries if the transitory view of inflation proves to be wrong...”
UBS, 2022: A Year of Discovery, 11/18/21: “With economic growth likely to remain strong in the first half of 2022, we see Eurozone and Japanese equities, US mid-caps, global financials, commodities, and energy equities as beneficiaries… Although we expect growth to be strong as we enter 2022, favoring cyclical sectors, slower growth over the course of the year should start to favor more defensive parts of the market. Healthcare is attractively priced in our view and provides both defensive and structural growth characteristics... We think central banks are likely to scale back emergency accommodation, but interest rates will remain low by historical standards. Investors seeking income will therefore need to look for ‘unconventional’ yield sources, including US senior loans, Asia high yield, active fixed income strategies, synthetic and private credit, and dividend-paying stocks.”
BlueBay Asset Management, 11/19/21: “A move to EVs shifts dependence away from the oil industry, but this fossil-fuel hole has to be filled by another power source… Once an EV is manufactured, there’s the environmental impact of powering it to consider. Currently, only one-third of the EU’s electricity consumption is from renewable sources and the auto industry is reliant on governments to boost investment in green energy suppliers. If they fail to do this, the extra demand will fall on hydrocarbon-burning power stations, which would mean the environmental problem is shifted rather than resolved.”
Nordea Bank, Week Ahead, 11/19/21: “If enough coincidences occur in a row, the odds of it being a true coincidence eventually drop very close to zero. Serial killers and war criminals have been convicted based on a long string of coincidences, even if no single observation was enough to convict. We get the same vibes when watching the developments in energy markets these months. Too many coincidental transitory explanatory factors are present for this to be a true coincidence and maybe the market is missing the true root cause of the energy inflation as a consequence. The wind hasn’t been blowing as much as usual, Norwegian water reservoirs have been running lower than normal and the list goes on, but could the true root cause just be the green transition policy? There is a strong correlation between the price of carbon emissions and electricity and if politicians intend to pursue a path of keeping the temperature increase below 1.5 degrees before 2050, then households better buckle up according to climate scenarios presented by the NGFS.”
Note: NGFS is the Network for Greening the Financial System, a group of central banks and financial supervisors working to “meet the goals of the Paris Agreement and to enhance the role of the financial system to manage risks and to mobilize capital for green and low-carbon investments in the broader context of environmentally sustainable development.”
As always, reach out to us with questions or feedback. For additional research on any of the topics referenced throughout this briefing, please contact us.
In the new year, the Weekly Briefing will be available ONLY to paid subscribers. To ensure continued full access to Coffee & Capital Markets, please consider joining our research-driven community as a paid subscriber.
This material is for informational and educational purposes only. All data has been compiled from sources believed to be reliable, but there is no guarantee of its complete accuracy.
US real GDP rose 2.0% in Q3 based on the advanced estimate of activity, but look for a positive revision when the BEA provides an update on 11/24/21.
October CPI — reported on 11/10 — increased 0.9% month/month. Over the last 12 months, CPI is up 6.2% and Core CPI is up 4.6%.
Rising interest rates reduce the value of liabilities as those future obligations are discounted at a higher rate.
Congressional Budget Office.