


Weekly Briefing: 11/7/21
Job gains, a dovish Fed, and perhaps new political realities...


Performance Observations
Profound and pivotal aptly describes the first week of November. Three things stood out. (1) Besides a continued stream of mostly positive corporate earnings reports, US employment showed solid fundamental improvement. Simply put, more jobs means more income and more consumption. (2) The Fed offered a relatively dovish tone, so financial conditions should remain fairly supportive despite a policy shift to reduced asset purchases (tapering) and eventually rate hikes. (3) Meanwhile, a surprising Republican win in Virginia prompted the passing of a less ambitious “infrastructure” spending bill by Democrats. It also reveals the emergence of new political realities as we approach 2022 mid-terms.
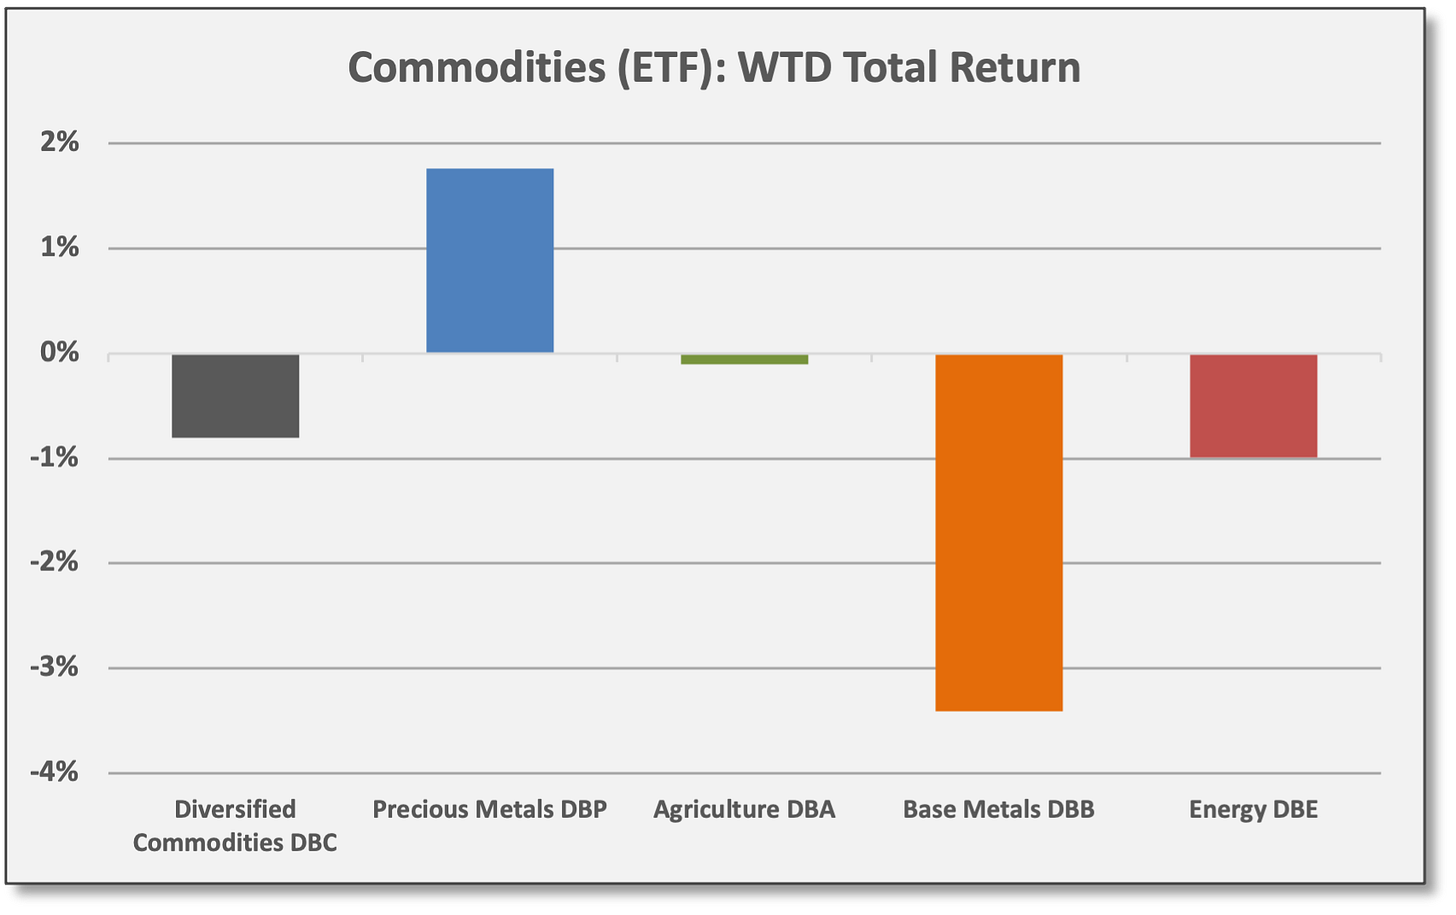
During the first week of November, most equities and bond sectors delivered gains, but commodities were mixed.
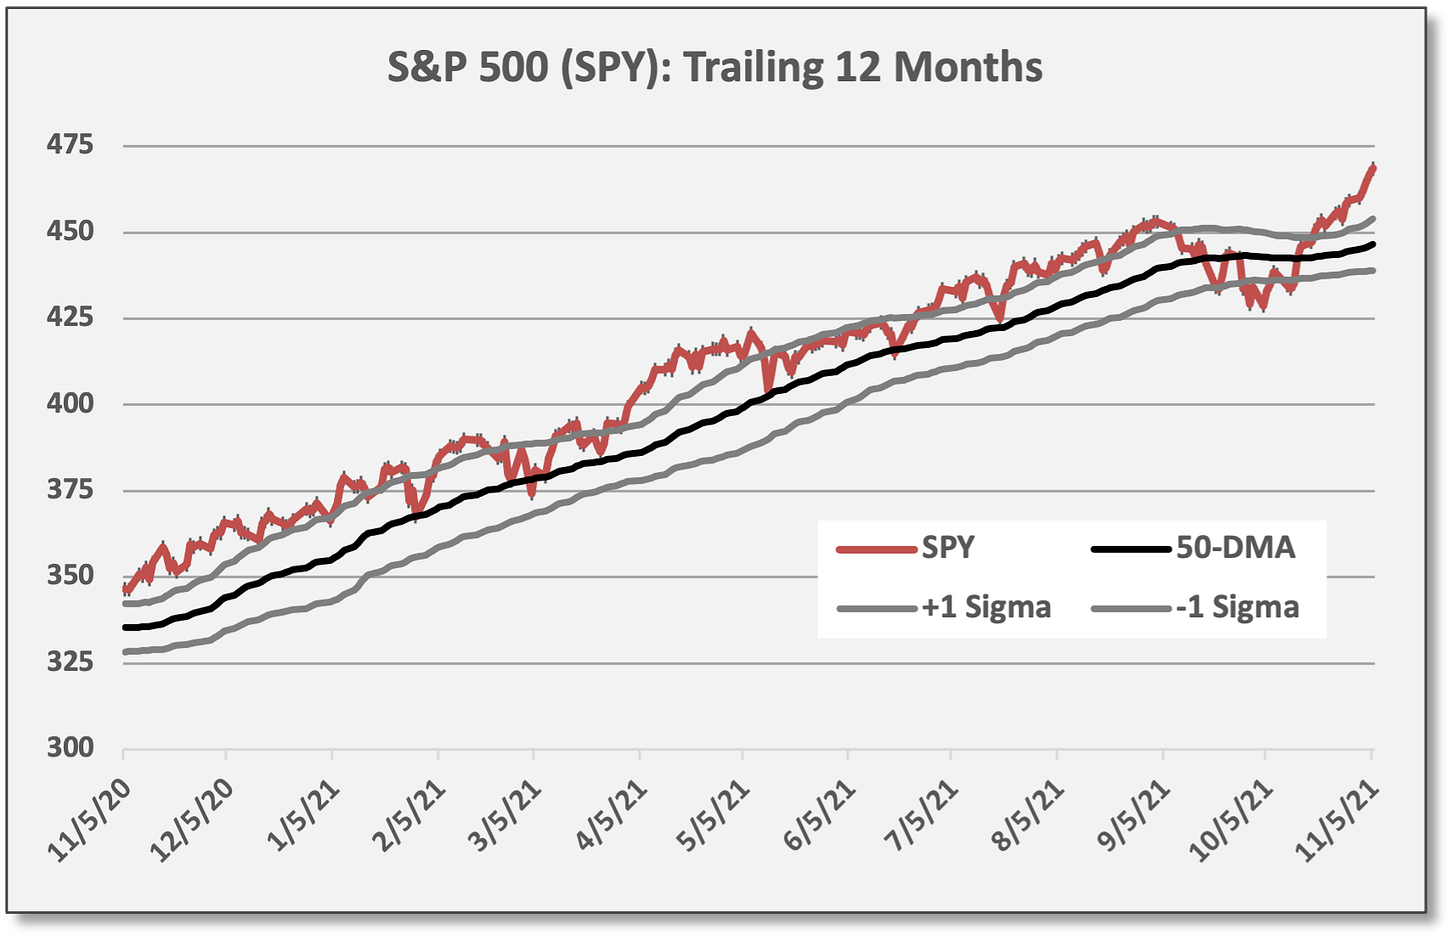
S&P 500 (SPY) gained 2.0% last week and is up 26.5% for 2021. For the week, top-performing groups were Technology, Communications Services, and Consumer Discretionary, but Financials lagged with large banks posting losses.
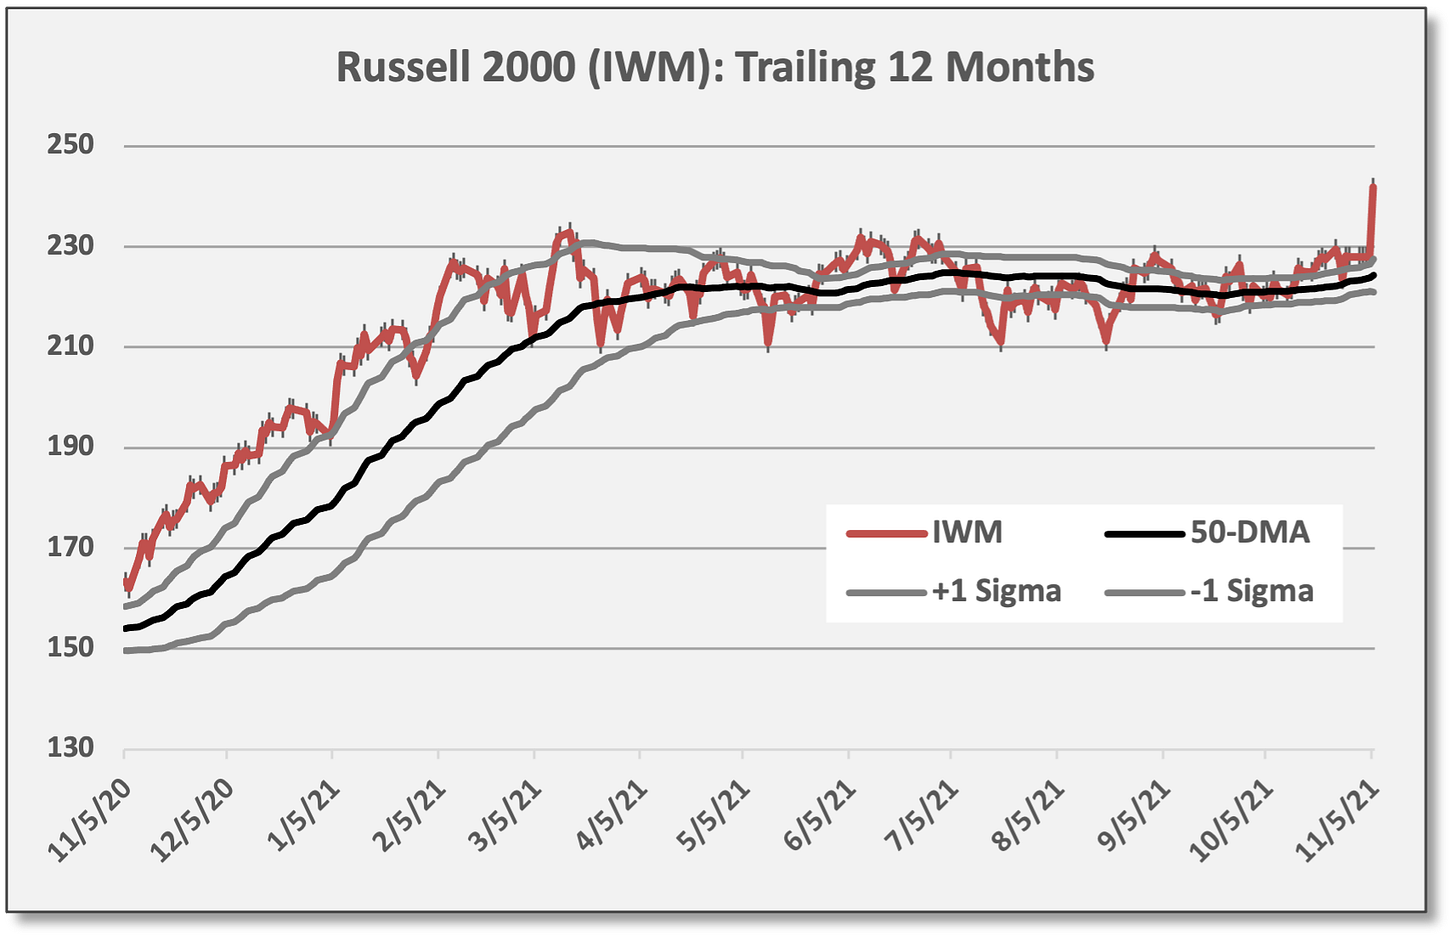
Russell 2000 (IWM) small-cap equities burst higher last week with a gain of 6.0%. After meandering sideways since Q1, IWM made a break-out to the upside and now trades at extremely overbought levels.
Nasdaq 100 (QQQ) quality/secular growth gained 3.2%. Top performers included Nvidia (NVDA), Tesla (TSLA), Meta Platforms (FB), and Amazon (AMZN) with gains of 16.4%, 9.7%, 5.4%, and 4.4%, respectively.
High-quality duration-sensitive bonds gained with rates moving lower in response to a less aggressive and relatively dovish tone from the Fed Chair Powell. US Aggregate Bond (AGG) gained 0.7%. HY bonds gained due to the move lower in rates and discreet equity betas, despite wider credit spreads.
In commodities, precious metals continued a recent run of success. SPDR Gold (GLD) gained 1.9%, presumably on perceptions as an inflation hedge and/or technical factors. Growth-sensitive energy and base metals were lower.

Sources: CCM, Koyfin 
Sources: CCM, Koyfin

Relative Value Spotlight: Russell 2000 & S&P 500. US small-cap equities shined last week: Russell 2000 (IWM) outperformed S&P 500 (SPY) by ~400 basis points. With small-caps closing the gap, returns for the two size groups are now fairly comparable for 2021, but the pathway has been divergent.
In the chart below from Koyfin, we show relative YTD performance. An up-trending line reflects small-cap outperformance; a down-trending line reflects small-cap underperformance. Last week, of course, relative performance for the Russell 2000 inflected higher.

In terms of factor/theme-based behavior, SPY has a quality/secular growth bias, while IWM has a cyclical/value tilt. As such, the two ETFs serve as leadership proxies for the two broad-based themes.
In the new year, the Weekly Briefing will be available ONLY to paid subscribers. To ensure continued full access to Coffee & Capital Markets, please consider joining our community as a paid subscriber.
Economic Data & Trends
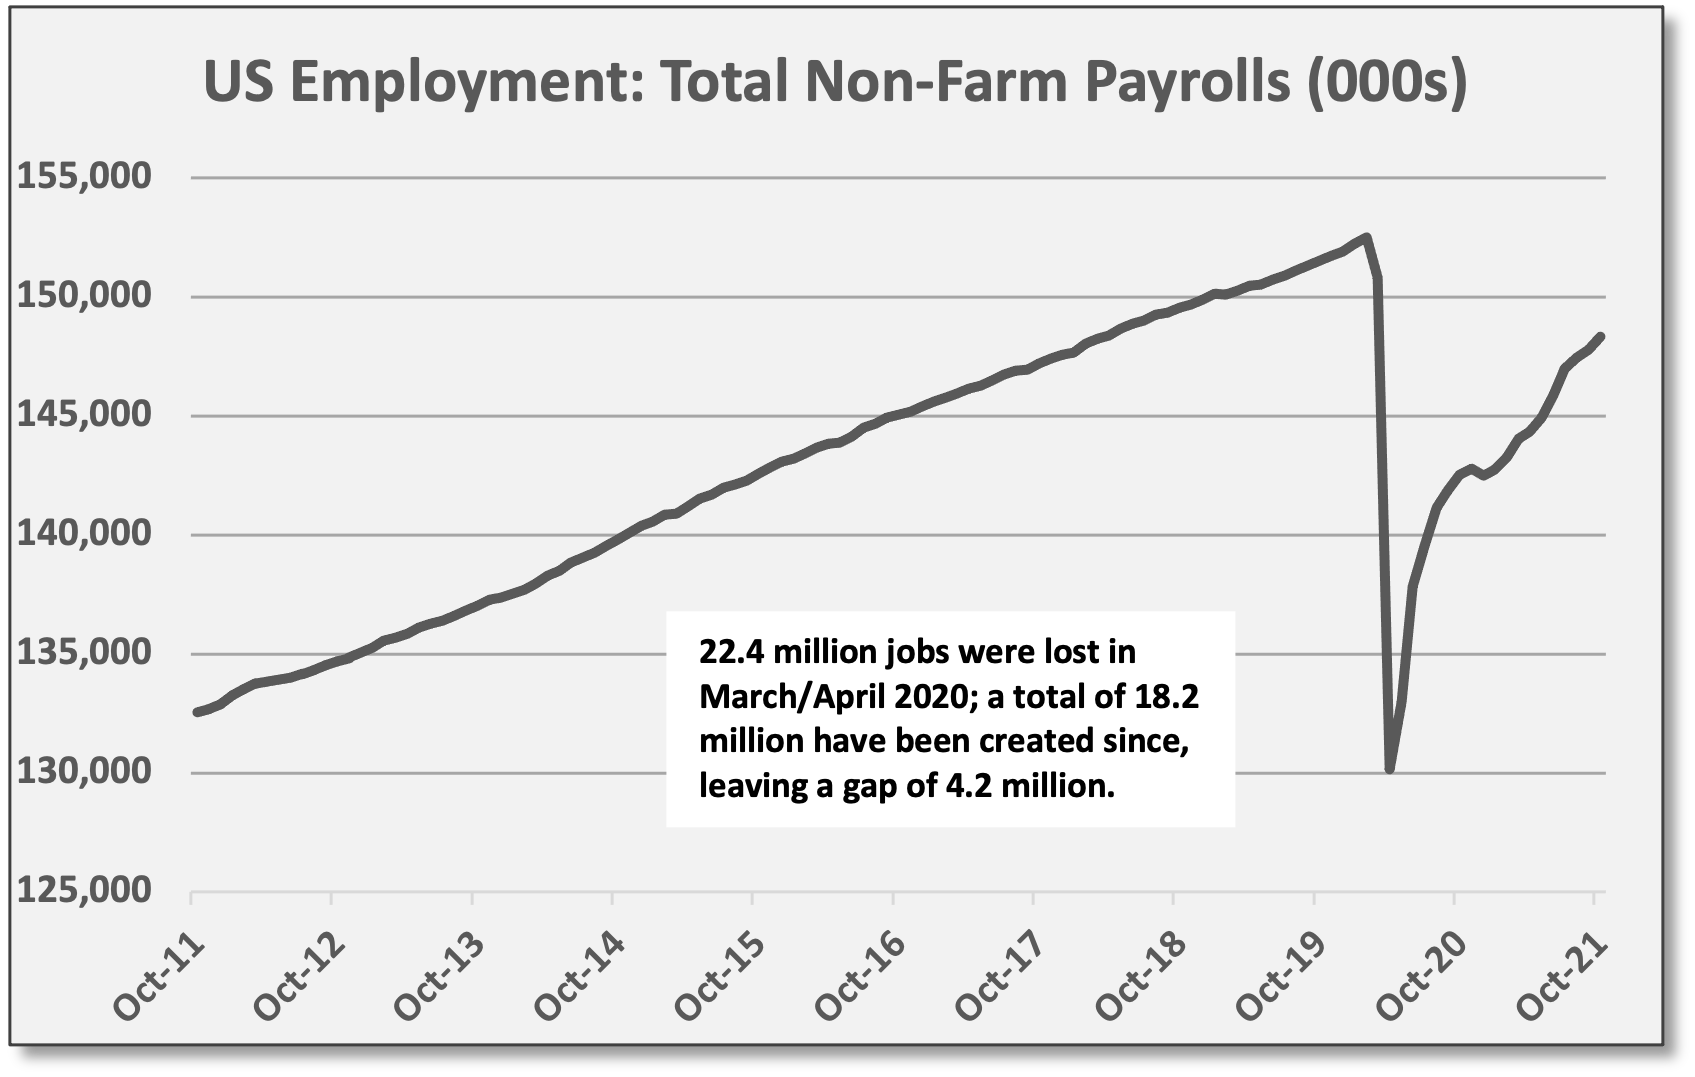
US employment showed solid improvement in October. Non-farm payrolls added 766,000 jobs — 531,000 in October plus 235,000 in positive revisions for Aug/Sep — beating estimates of 450,000. The latest reminder that monthly jobs data is volatile and subject to revision.
Employment trends are favorable, but the US is still playing catch-up. US economy is operating with 4.2 million fewer payroll jobs compared to pre-COVID levels. Over the last 12 months, monthly NFP job gains have averaged 481,000 versus 202,000 for the 12 months (as of Feb 2020) leading up to COVID. Now that temporary/expanded unemployment benefits are behind us, job growth should continue to show improvement into 2022.
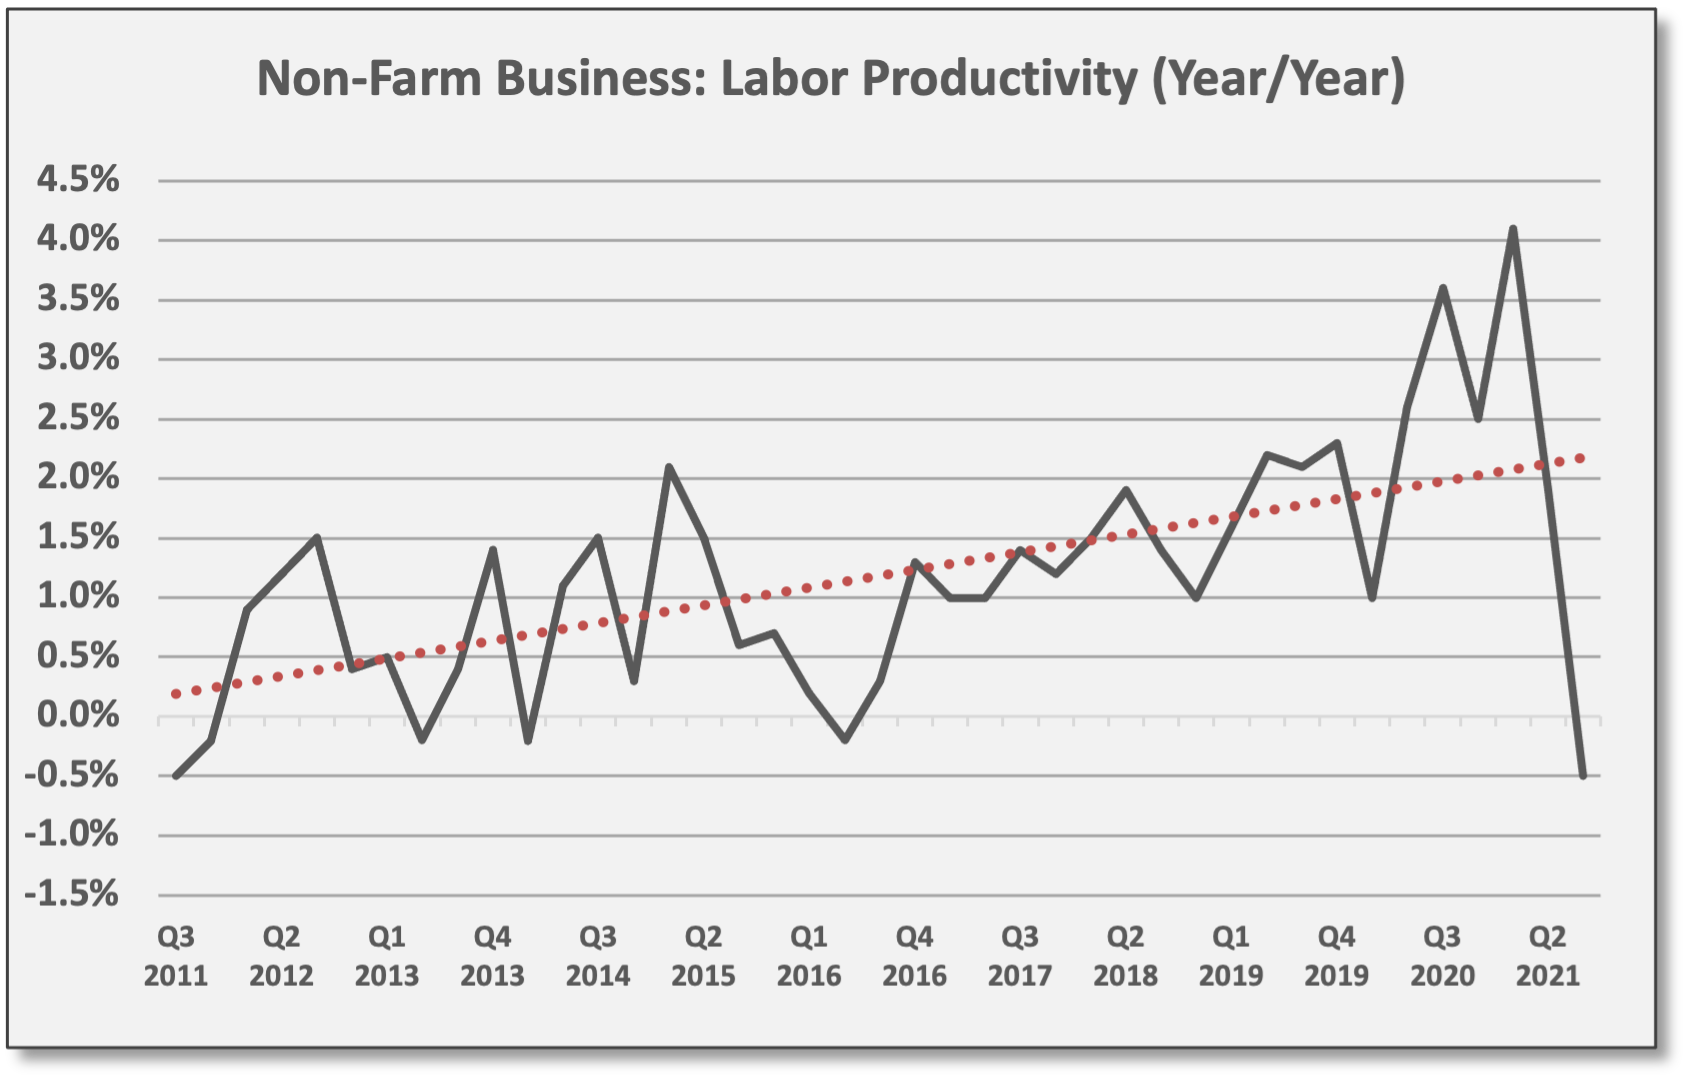
Labor productivity declined in Q3 as GDP stumbled, but remains up-trending. Labor productivity (output per hour) declined -5.0% sequentially in Q3 versus Q2, but the productivity decline was more muted on a year-over-year basis at -0.5%. In short, less output (2.0% GDP for Q3) divided by a rising level of labor inputs (aggregate weekly hours worked increased by 6.1% in Q3) equals lower productivity, but this is a single data point for Q3.
Productivity trends remain favorable. Short-term GDP volatility resulting from supply-chain disruptions obscures the longer-term gains in output per unit of labor. Productivity trends remain favorable and should inflect higher in 2022, assuming supply issues fade and consumption demand persists. Moreover, rising labor productivity helps control wage inflation and improves wealth creation via corporate profitability and/or wage gains. If anything, the WFH response to COVID seems to have accelerated productivity trends with businesses deploying even more technology to enhance labor productivity.
Lagging payrolls translate into a strong profits recovery. Against a backdrop of lower total payrolls, the rapid growth recovery has fueled a profits recovery. US GDP has averaged 4.9% over the last four quarters, well above the 2.2% trend pre-COVID.1 Payrolls remain below pre-COVID levels by 4.2 million jobs. For 2021, S&P 500 profits are on pace to grow 45-50%.
Monetary/Fiscal Policy
Fed moving forward with tapering, but relatively dovish on rate hikes… As outlined in late September and reiterated this week, the Fed will reduce its asset purchases by $15 billion per month starting later this month. Thus, the Fed’s quantitative easing program will end by June 2022.
Fed Chair Powell struck a relatively dovish tone regarding future rate hikes and Fed Policy. Bond prices rallied and rates moved lower.
Tapering was a forgone conclusion heading into the FOMC meeting last week, but more importantly, Fed Chair Powell struck a relatively dovish tone regarding future rate hikes and Fed Policy in general. Bond prices rallied and rates moved lower in response. The UST yield curve steepened (see Fixed Income, Rates & Credit below). Specifically, Powell emphasized flexibility going forward. For instance, if inflation levels persist in the months ahead, Powell suggested the Fed could accelerate its tapering process. Since tapering was already expected, this seemed to be a non-event — and if it delays the start of rate hikes, then in that context, Powell’s comments were interpreted as dovish. In short, markets were getting ahead of themselves in terms of rate hikes, so prices recalibrated.
Elsewhere, the Bank of England met last week and decided to leave policy rates unchanged at 0.1%. And ECB President Lagarde reiterated her view that it is improbable that Eurozone growth and inflation conditions will require rate hikes next year.
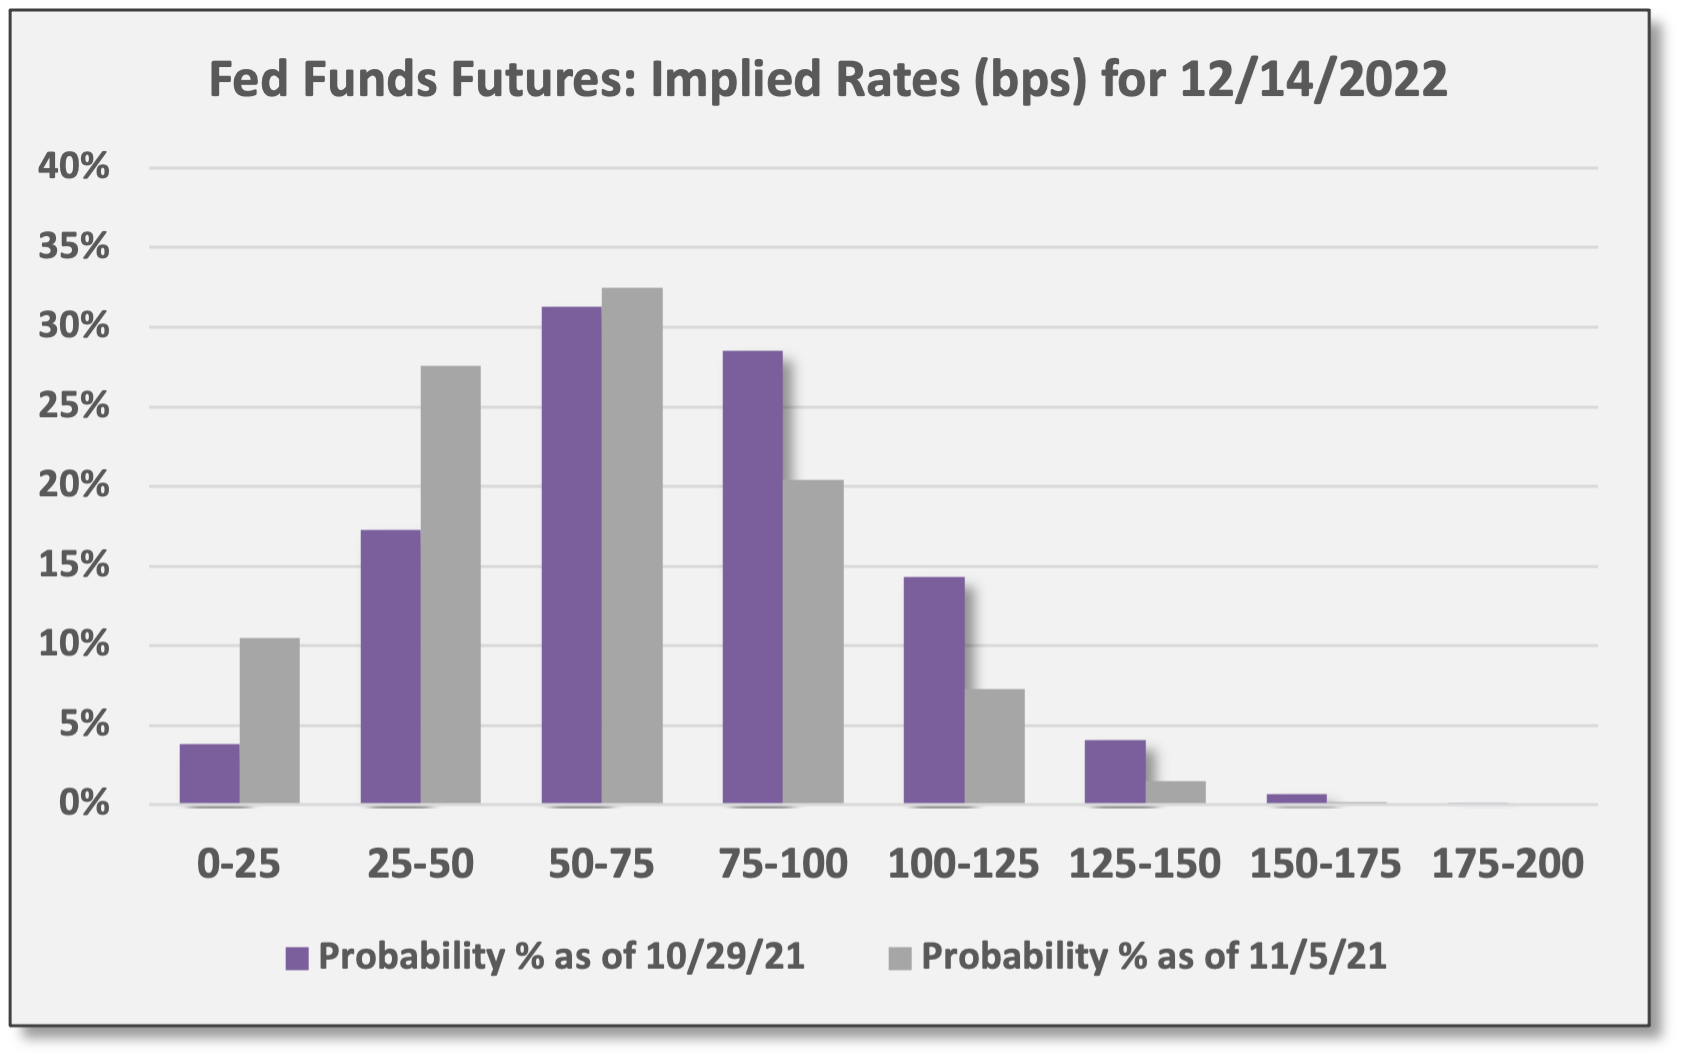
Assuming 25 basis point increments, markets are currently pricing 2-3 rate hikes in 2022. Leading up to the FOMC meeting, bond markets were aggressively pulling forward the launch date for rate hikes, but Powell’s press conference helped to curb that enthusiasm. As of a Friday’s close, Fed Funds futures placed a 54% probability of a rate hike in June 2022, down from a 66% probability at the end of October.
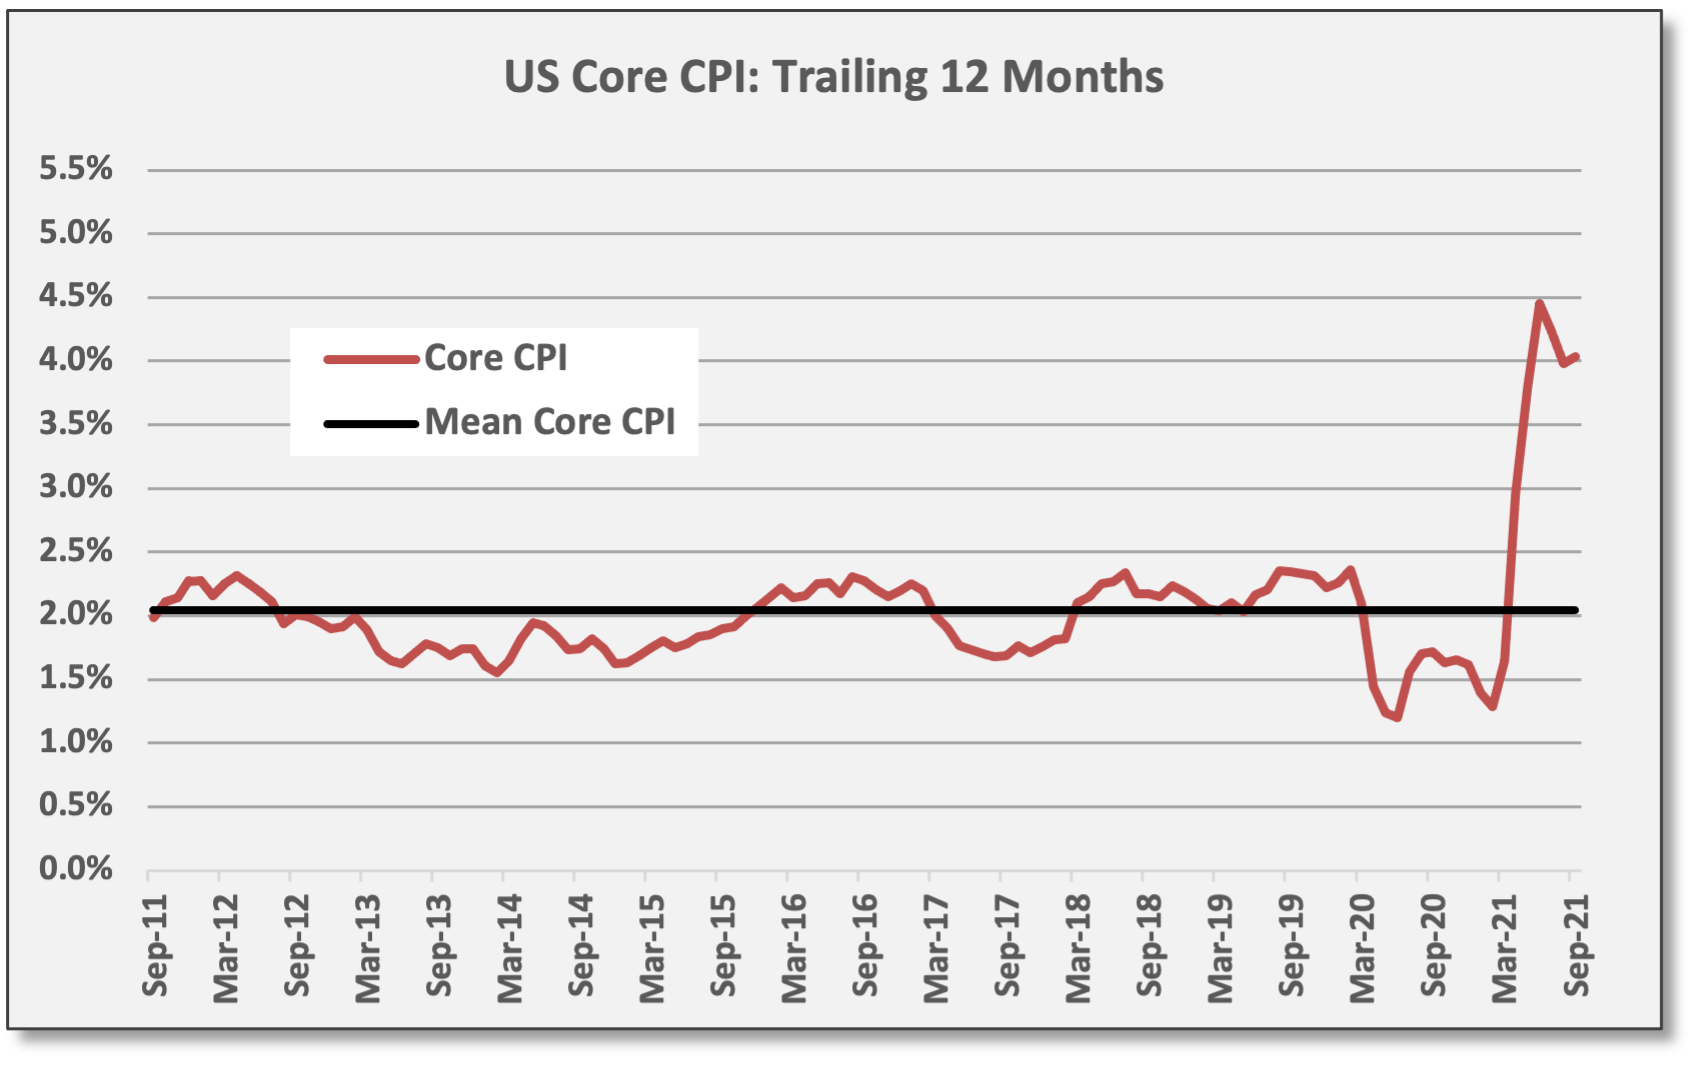
What about inflation? As of September, CPI and Core CPI were up 5.4% and 4.0% over the last 12 months, respectively. October CPI is released on 11/10. Meanwhile, unit labor costs jumped 8.3% in Q3 and were up 4.8% year/year as of 9/30/21. Subsequently, in the October jobs report, average hourly earnings showed a gain of 4.9% on a year/year basis.2
“Tightness in the labor market is contributing nearly 1 ppt [to Core CPI] and that is unlikely to change… even after supply chain bottlenecks are resolved… inflation is unlikely to return to 2%, but rather it's likely to settle in the 2.5%-3% [range].” Jefferies, 11/5/21
Aneta Markowska, Chief Economist, Jefferies: “The FOMC conceded this week that inflation has been more persistent than expected, but it maintained that the pressures are likely transitory and will fade once supply chain issues are resolved. Is the Fed right? We agree that there is transitory component to inflation, which probably accounts for roughly 1-1.5 [percentage points]ppts on the core CPI. But, by our estimates, the tightness in the labor market is contributing nearly 1 ppt and that is unlikely to change. This means that even after supply chain bottlenecks are resolved, presumably around the middle of 2022, inflation is unlikely to return to 2%, but rather it's likely to settle in the 2.5%-3% [range]. That's what unit labor costs are telling us at the moment.”
“There is no reason why QE should still be in effect today… the Fed’s forecast on inflation is clearly too low. And with the Fed not raising interest rates anytime soon, inflation is likely to turn out much more persistent than the Fed hopes.” First Trust, 11/3/21
Brian Wesbury, Chief Economist, First Trust: “At the end of the day, the Fed wanted to get the process towards normalization started, but the path this will follow in the year ahead remains uncertain. There is no reason why QE should still be in effect today; tapering should have started, and ended, a long time ago. In addition, the Fed’s forecast on inflation is clearly too low. And with the Fed not raising interest rates anytime soon, inflation is likely to turn out much more persistent than the Fed hopes.”
Fiscal Policy: US House of Representatives passed a bipartisan $1.2 billion “infrastructure” spending bill late Friday night. Presumably, the bill follows the $1.2 trillion bill passed by the Senate in August. The House says it will take up a more ambitious $1.7 trillion bill on the Biden agenda in the weeks ahead, but the political reality is that the probability of success is lower today following the Virginia election outcome last week.
Originally, the Democrat plan was to pass the entire Biden agenda in one fell swoop. House leadership had been pushing hard for that with speculation that spending initiatives would run as high as $2-4 trillion, but the green/social and redistribution policies lacked support from moderate Democrats.
Two weeks ago, Strategas Research highlighted growing pressure on Democrats to pass a $2 trillion program before the 11/2 elections. Specifically, Strategas said there was growing concern within the Democrat leadership that a loss in the Virginia governor’s race would make moderate Dems even less inclined to support the Biden agenda.
Sure enough, Republican Glenn Youngkin — a former private equity manager at The Carlyle Group — won the Virginia election in a surprising move that signaled voter dissatisfaction with the Democrat agenda (particularly related to education).
In response to Virginia, the House seemed to pivot immediately, passing the less ambitious spending bill already passed by the Senate.
Previously, the CBO estimated the net-new spending from the Senate would have a marginal impact on federal outlays and the deficit. We assume this still applies, although details between the House and Senate versions will need to be reconciled. Specifically, the CBO concluded the Senate’s $1.2 trillion plan would add less than 0.24% to federal outlays as a percentage of US GDP (on an annual basis). It would add less than 0.22% to federal deficits as a percentage of US GDP.

Ironically, after injecting $2.3 trillion in direct stimulus to consumers and businesses, the US economy is expanding at an above-trend rate and recent corporate earnings reports highlight strong spending demand.
In the days ahead, we expect more details to emerge, but discerning federal spending programs is notoriously complicated. The true cost is hard to measure as are related benefits. Besides meeting essential needs, we believe spending programs should be evaluated based on (1) impact on productivity, and (2) impact on incentives related to work, consumption, savings, and investment. Ironically, after injecting some $2.3 trillion in direct stimulus to consumers and businesses, the US economy is expanding at an above-trend rate and recent corporate earnings reports highlight strong spending demand.
Fixed Income, Rates & Credit
The Fed will begin scaling down asset purchases later this month (tapering), but rate hikes are not necessarily imminent once the tapering is done. This was the balanced message delivered by Fed Chair Powell after last week’s FOMC meeting. Bespoke summarized the market response: “Short-term interest rates are down sharply across global markets in a big walk-back of extreme price moves over the last several weeks.”
To summarize: (1) Tapering was fully “expected” so markets were unfazed by Powell’s hinting that the pace of tapering could be accelerated if needed. (2) However, Powell’s indication that rate hikes will be “data dependent” was a positive surprise and this formed the basis for the bond rally. In all probability, rate hikes will happen next year — indeed, Fed futures are still pricing 2-3 hikes — but Powell’s comments took the edge off that policy maneuver.
High-quality duration-sensitive bonds gained with rates moving lower in response to a less aggressive and relatively dovish tone from the Fed. US Aggregate Bond (AGG) gained 0.7%, but the top performer was UST 20+ Year (TLT) with a gain of 1.2%. Investment Grade Corporates (LQD) also gained 1.2%. Inflation-protected USTs (TIP) added 90 basis points of return remain the best-performing bond segment for 2021.
Spread strategies also gained, partly due to the rates move, but also due to discreet equity betas. HY corporates (JNK) gained 1.0% last week, despite wider credit spreads. EM sovereign debt (EMB) gained 1.2%, benefiting from the idea that the Fed will (for now) avoid an aggressive strategy to hike rates, which would tend to weaken EM currencies.

Sources: CCM, Koyfin 
Sources: CCM, Koyfin


Interest rates dropped after the FOMC meeting. For the UST 5-year and 7-year maturities, rates dropped 14 basis points last week. UST 10-year closed at 1.45%, down 10 basis points for the week. The US yield curve steepened.

The rally in bonds last week was a sharp reversal from the sell-off that closed October. To reiterate, US and global bond markets were offsides in pricing aggressive policy action (rate hikes) from the Fed and other central banks; last week was a matter of recalibrating rate expectations.
Technical factors added to bond market moves in October. And those effects were probably temporary, according to JPMorgan. Last month, even while short/intermediate rates were backing up, long bonds rallied. This was mostly due to rebalancing flows from risk parity and balanced mutual funds as strong equity performance resulted in overweighted equity positions (and underweighted bond allocations). In addition, JPM believes US pension funds were buyers of long-duration bonds in late October, immunizing long-duration pension liabilities based on improved funding ratios resulting from strong equity performance.
“We think this [October] move was a technical overshoot that will revert and there should be a bounce in equities, yields, and commodities.” JPMorgan, Flows & Liquidity, 11/3/21
In addition, JPM believes discretionary hedge fund managers were unwinding “yield curve steepeners.” A fund manager betting on the 2/10 curve to steepen would be long the UST 2-year and short the UST 10-year; closing such a position would require selling the 2-year and covering the short of the 10-year (buying), which apparently occurred in late October. In fact, some of the unwind seems to have come from low-beta funds that cut exposures in a risk management move. The same positioning and trading logic would apply to 10/30 steepeners. JPMorgan: “We think this [October] move was a technical overshoot that will revert and there should be a bounce in equities, yields, and commodities.”
US/Global Equities
The combination of (1) positive corporate earnings, (2) better-than-expected job gains, and (3) an effectively “dovish” Fed helped to drive positive equity returns last week. So far, reporting S&P 500 companies are showing EPS growth of 41% in Q3 versus a year ago, beating estimates by a better-than-average 10% per JPMorgan.
S&P 500 (SPY) gained 2.0% last week and is up 26.5% for 2021. For the week, top-performing groups were Technology, Communications Services, and Consumer Discretionary, but Financials lagged with large banks posting losses. Single-name leaders for the week were Nvidia (NVDA), Pfizer (PFE), Tesla (TSLA), and the company formerly known as Facebook, Meta Platforms (FB), with gains of 16.4%, 12.1%, 9.7%, and 5.4%, respectively.
SPY is trading at extreme overbought levels defined as at least two sigmas above the 50-day moving average. SPY trades at 2.9 sigmas > 50-DMA.
Sources: CCM, Yahoo! Finance 
Sources: CCM, Koyfin 
Sources: CCM, Koyfin Russell 2000 (IWM) small-cap equities burst higher last week with a gain of 6.0%. Returns were consistent across the style spectrum: Russell 2000 Value (IWN) gained 6.1% and Russell 2000 Growth (IWO) gained 6.0%.
After meandering sideways since Q1, IWM made a break-out to the upside and now trades at ultra/extreme overbought levels — 5.3 sigmas above the 50-day moving average. That doesn’t guarantee a move lower because OB conditions can persist, but at least a pause is probably in order.
Sources: CCM, Yahoo! Finance 
Sources: CCM, Koyfin 
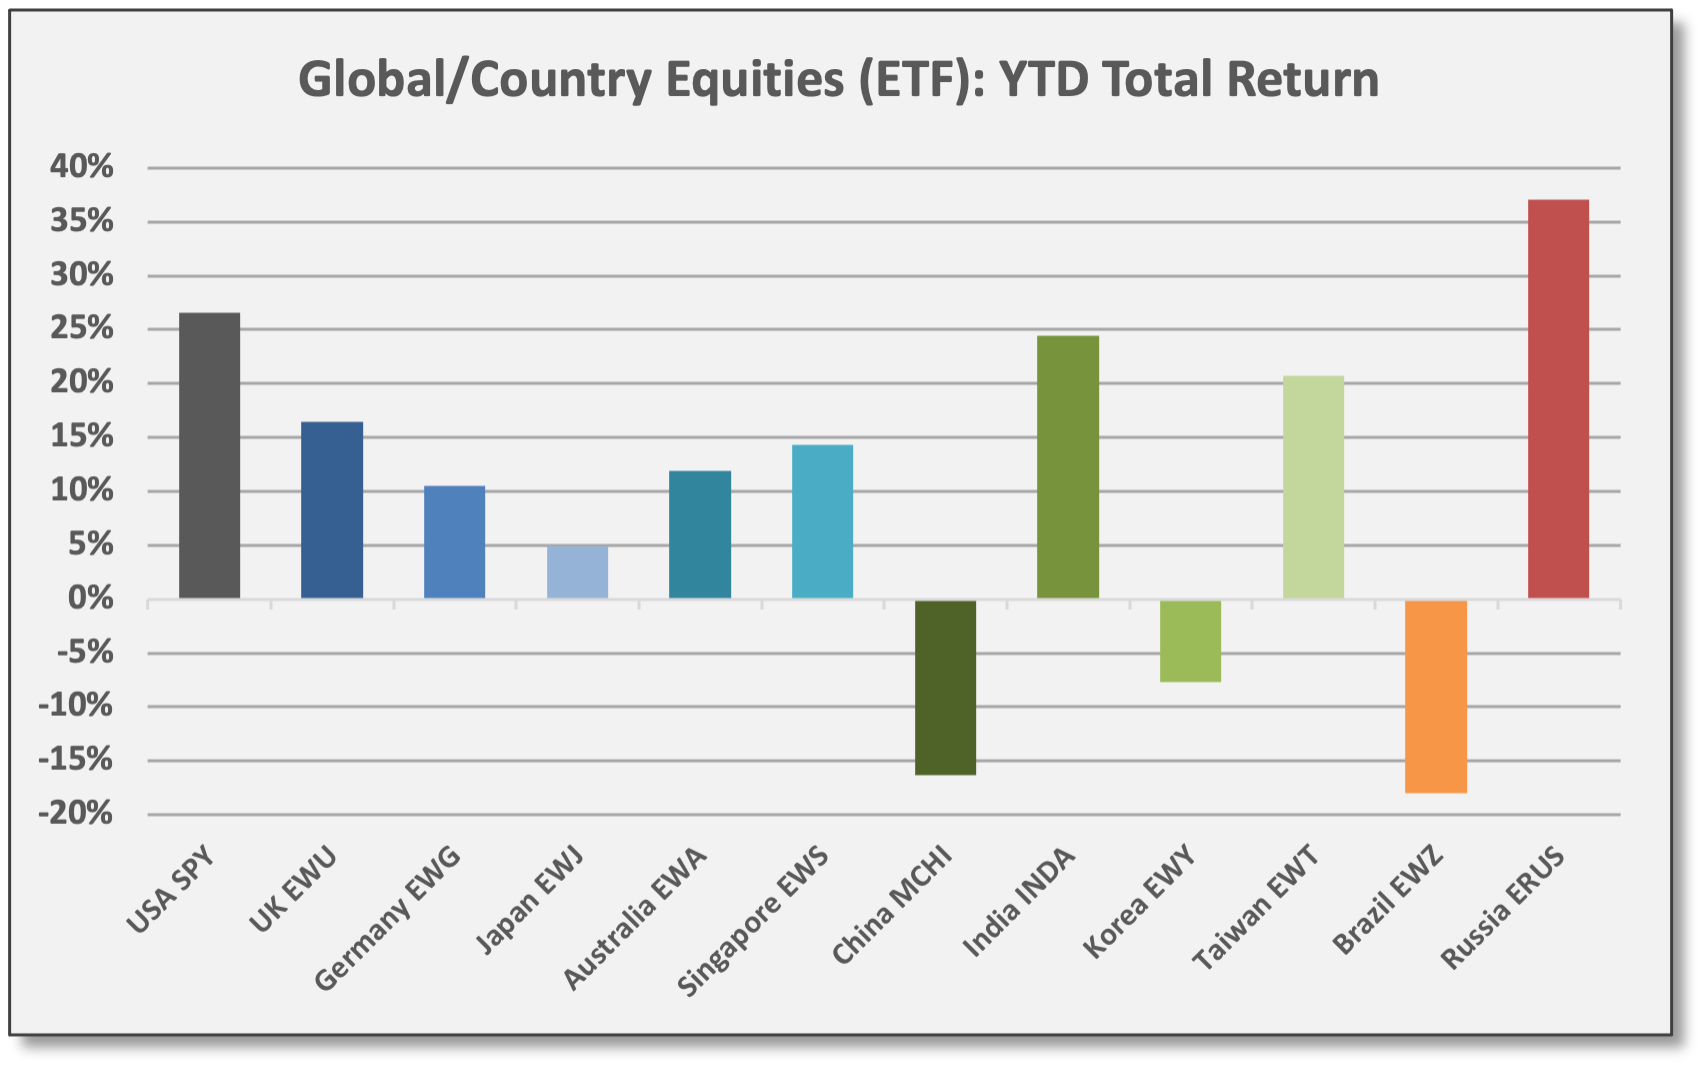
Sources: CCM, Koyfin Developed Markets (EFA) gained 1.7%, but Emerging Markets (EEM) were flat. Top performers were Japan (EWJ), Germany (EWG), and India (INDA) with gains of 2.9%, 2.4%, and 2.3%, respectively. MSCI China (MCHI) declined -2.3%.

Sources: CCM, Koyfin 
Sources: CCM, Koyfin


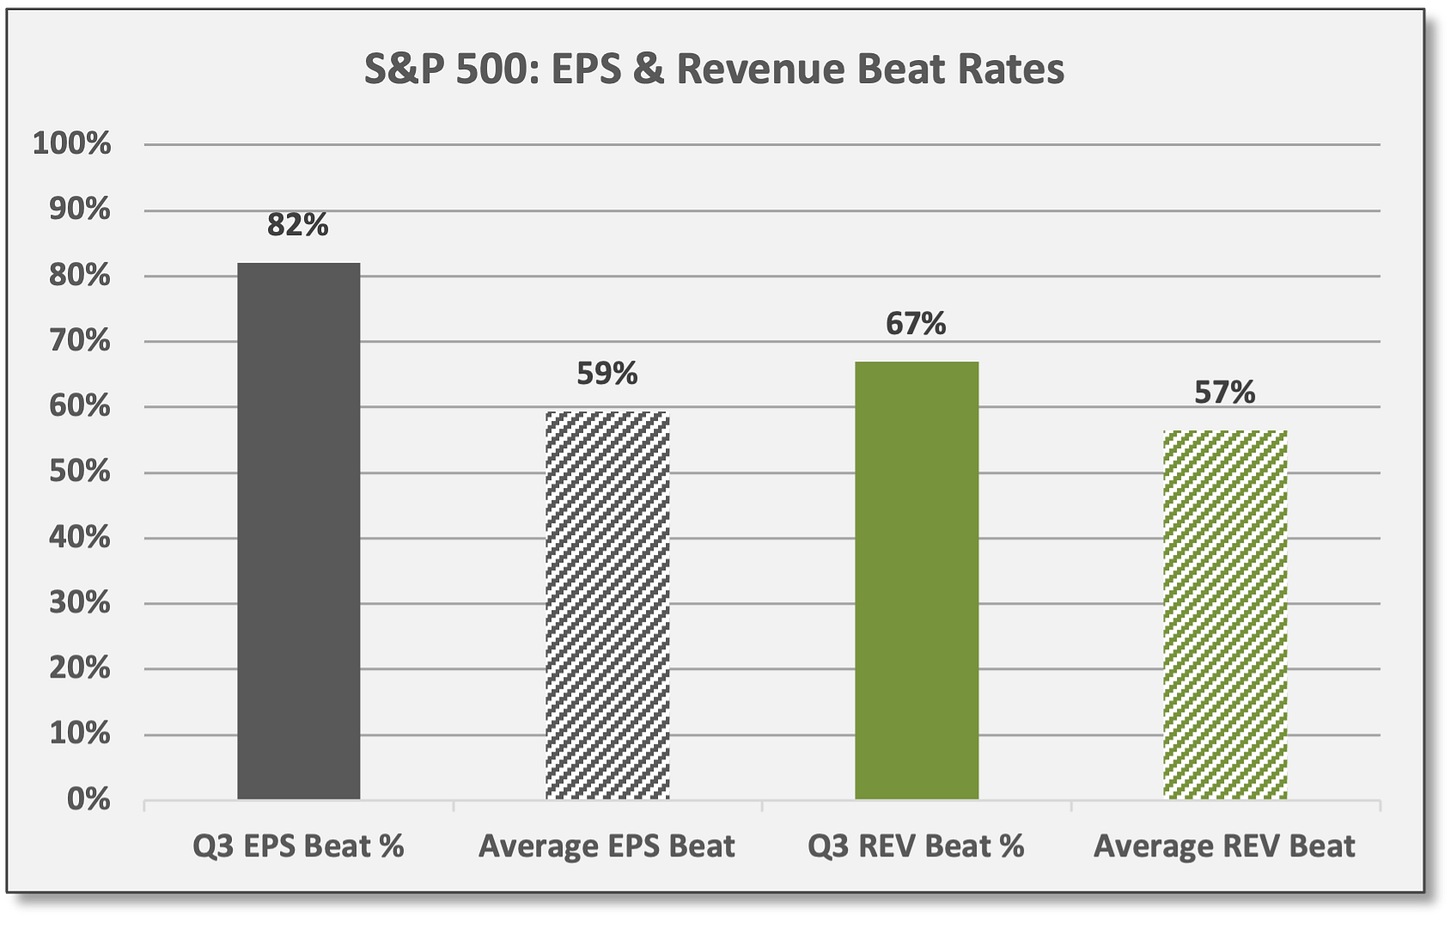
Q3 Earnings Season: Reported EPS and revenues are beating estimates by a better-than-average rate.
For US equities, 82% of S&P 500 companies are beating EPS estimates and 67% are beating revenue estimates, compared to long-term average beat rates of 59% and 56%, respectively. So far, reporting S&P 500 companies (~405) are showing EPS growth of 41% year/year, beating estimates by 10% (compared to the 15-year average beat margin of 5%) per JPMorgan.
Sources: CCM, JPMorgan, Bespoke Across the UK and Eurozone, reporting companies in the STOXX Europe 600 (~415) are beating EPS and revenue estimates by 64% and 63%, respectively. EPS growth is up 50% year/year, beating estimates by 9% per JPM.
In Japan, reporting companies in the TOPIX are beating EPS and revenue estimates by 54% and 46%, respectively. EPS growth is up 27% year/year per JPM. Only 42% of TOPIX companies have reported.

Bespoke: “US earnings power is still very strong, but the gobsmacking performance of the last year and a half is starting to fade as beat and guide rates normalize to more sustainable levels.”
Commodities & Real Assets
Last week, precious metals continued a recent run of success.
Precious Metals (DBP) — 80% allocated to gold and 20% to silver — gained 1.8%. SPDR Gold (GLD) gained 1.9%, presumably on perceptions as an inflation hedge and/or technical factors. GLD remains in a long-term downtrend, although now trading above its 50-day moving average.
Growth-sensitive energy and base metals were lower.


With the ESG movement and the push for decarbonization, the basic laws of economics are being suspended as it relates to energy production. Usually high prices are the antidote for high prices because producers are incentivized to invest and expand production. Currently, we are not seeing that as companies (1) focus on capital returns and/or (2) rotate resources into alternative energy efforts.
BP upgraded plans for divestments and share repurchases. Similar to other oil producers, “management made no signal about raising investment to expand production” even though global demand has rebounded.
Last week, UK-based oil major BP reported results. Both earnings and revenues beat estimates. BP upgraded plans for divestments and share repurchases (capital return). “Similar to other oil producers, management made no signal about raising investment to expand production,” according to Bespoke, even though BP admitted global oil demand had rebounded to 100 million barrels per day.
Volatility, Flows/Positioning & Sentiment
Andrew Sheets leads the quant-based research effort at Morgan Stanley. In the group’s Cross-Asset Dispatches dated 11/5, Sheets described the global capital markets as “calm above the surface” but with “furious churning” below.
“Global equities are hitting all-time highs and enjoying tailwinds of strong seasonality. Realised equity volatility (1-month) across the US, Europe and EM has fallen… Below the surface, however, volatility has jumped.” Morgan Stanley, 11/5/21
With the report, Morgan Stanley introduced a new multi-asset indicator — the “Composite Sigma Indicator” (CSI) — to quantify extreme moves over time. CSI tracks ~250 markets across global equities, credit, commodities, interest rates (nominals, inflation-protected breakevens, and yield curves), and currencies. CSI is designed as a risk management tool that captures “real breakage” in price relationships.
Specifically, Sheets referred to a rising number of markets experiencing extreme one-day price moves — defined as standard deviation events of at least 1.5 sigmas.
Primarily, the elevated volatility is showing up in interest rates markets, inflation-protected bonds, and across yield curves. Sheets: “Risk management in global rates feels very different from equities or FX heading into year-end.”
Collectively, Sheets believes the increased volatility suggests a “shifting” and possibly less favorable liquidity environment, but it’s unclear if/when such liquidity challenges will show up in global equity markets which remain fairly calm.
Alternative Assets/Strategies
Bond disruptions produced losses for low-beta hedge funds in October. Extreme volatility across fixed income markets resulted in P/L pain for several low-beta multi-PM funds in October, including Balyasny Asset Management (BAM) and Millennium Management (MM) according to Yahoo! Finance and other sources.
In some cases, downside loss thresholds were breached, forcing position reductions and the “de-grossing” of fixed income portfolios. To a certain extent, such actions might have amplified the unwind of “steepener trades” identified by JPMorgan (and discussed above in Fixed Income, Rates & Credit). As an example, BAM and MM both operate with tight loss controls; deployed capital can be pulled abruptly from PM teams that suffer sudden losses of ~2-3%.
For context, however, October declines for BAM and Millennium were limited due to the firms’ risk management protocols and strategy diversification.
BAM’s Atlas Enhanced finished October with a loss of just -0.1% and the fund was up 6.0% YTD as of 10/31.
Millennium USA declined -0.4% in October, but is up 10.9% YTD as of 10/31.
Both BAM and MLP operate with limited correlation/beta to US/global equities. With equity beta usually well below 0.20, absolute returns are almost entirely represented by “alpha” — or positive risk-adjusted returns deriving from unique non-market factors. Since 2013 for instance, Millennium shows a median equity correlation of 0.08 to MSCI ACWI over rolling 24-month periods; median equity beta was 0.03. With a net-of-fees return of 11.3% (annualized) since March 2013, MLP shows a positive alpha of 10.2% versus ACWI.
Portfolio Construction & Trading Ideas
Venn is a factor analytics tool from quant fund manager Two Sigma. Venn provides attribution analysis across 18 unique factors and the program is useful for performance attribution, portfolio construction, and relative value analysis across fund managers/strategies.
For October, Venn’s factor analysis summarized performance as follows:
Top performing factors were Equity Beta (ACWI), Momentum (ACWI), Trend-Following (diversified futures), and Quality with gains of 5.0%, 3.7%, 2.6%, and 2.5%, respectively.
Bottom performing factors were Fixed Income Carry, Small-Cap, Emerging Markets, and Value with losses of -3.9%, -2.3%, -1.2%, and -1.1%, respectively.

Sources: CCM, Venn by Two Sigma
About Venn Factors: Factors tracked by Venn include (1) long-only “macro” asset class factors as well as (2) long/short “style” factors. Essentially, the long/short style factors reflect relative value opportunities and are structured to be market neutral without any directional bias (long positions in securities with the strongest representation of the factor and short positions in securities with the weakest representation).
Overview of Venn factors:
Core Macro: Long-only broad-based asset classes for global equities (MSCI ACWI), global intermediate interest rates (7-10 year maturities), global credit (both investment grade and high yield), and diversified commodities (Bloomberg Commodity Index). Global equities and interest rates hedge currency exposures to isolate equity beta and rates. For IG/HY credit, equity and rates exposures are stripped out to isolate credit risk. For commodities, equity, rates, and currency exposures are hedged to isolate unique commodity betas.
Secondary Macro: Emerging Markets is isolated as a long-only factor across various asset classes with equity, rates, credit, and commodities exposures hedged. Otherwise, secondary macro factors are long-only relative to a local/base market. Thus, G10 currencies are a long basket versus the USD with other asset class factors stripped out. Local Inflation and Local Equity reflect US breakevens (7-10 year TIPS) and MSCI USA, respectively.
Macro Style: Equity Short Volatility reflects the selling of one-month S&P 500 put options as an income-generating factor, stripping out equity beta exposures. Fixed income and FX carry factors represent long/short relative value strategies — selling low-yield assets (borrowing) to purchase high-yield assets (invest long); FI carry is focused strictly on sovereign debt. Trend-Following targets index futures across multiple asset classes, investing either long or short based on 6/12-month trends; TF is a directional factor — either long or short — depending on what is trending favorably.
Equity Style: All the equity style factors are long/short relative value factors. They are structured as “market neutral” to eliminate directional bias (regions, sectors, etc.) in order to isolate the unique factor. For instance, Small-Cap captures the “size” factor by investing long in small-cap equities and selling short large-cap equities; negative performance in the small-cap factor implies large-cap outperformance. Value represents long exposure to low-priced equities based on various valuation metrics (P/B, P/E, P/CF, P/S) and short exposure to expensive equities.
By contrast, many trading platforms and other research sources identify long-only ETFs for style and factor-based performance tracking. These represent easy-to-access proxies and offer some merit. Unfortunately, these tend to provide imperfect or convoluted data because the ETFs include so many overlapping exposures. On the other hand, Venn offers more of a pure-play with discreet and precisely-defined factors favored by top systematic trading funds. There is probably a time and place for both, depending on ones’ needs and resources.
Factor-based investing has grown tremendously in recent years. To become better informed and equipped on the nuances of factor analysis and performance behavior, we encourage readers to explore the Venn analytics program. Venn provides weekly factor updates and other sample analysis free of charge, although website users must register. In addition, Two Sigma provides white papers and other helpful educational resources also available at the site.
Venn Analytics Illustration: Below we compare two long-only equity funds: Edgewood Growth (EGFIX) and iShares Core Dividend Growth (DGRO).
Across the 18 factors, only those with statistical significance were include. An exception was made for the small-cap equity factor, although neither fund has shown meaningful exposure to small-cap.
Both funds show equity beta has the prominent risk factor; this is general equity market risk. Venn uses MSCI ACWI as its baseline for global equity market beta. Similarly, both funds show high factor exposure to the local equity factor — MSCI USA in this case — but was excluded due to redundancy.
Edgewood’s negative factor beta to value means it holds high-priced equity securities that score in the bottom of the value rankings. As a byproduct of its growth strategy, it also holds companies that score lower on quality metrics, such as leverage and earnings consistency. Edgewood also is exposed to the crowding factor which relates to popular positions and implies some measure of liquidity risk (which can be either a positive or negative return driver).
iShares Dividend Growth shows a quality/value bias as the strategy provides a mix of growth/income.
For reference, EGFIX returned 28.2% (annualized) over the recent five years with a residual return of 3.5% (positive alpha) based on the Venn multi-factor process. DGRO returned 17.8% (annualized) with a residual/alpha of 1.3%. For comparison, the S&P 500 (SPY) returned 19.6% with a residual of 0.2% over the period.

Sources: CCM, Venn by Two Sigma

Certain factor betas are obvious. Other beta exposures are more subtle, but still valuable as they emit signals about a fund’s underlying performance behavior. Venn’s detection of “subtle” factors usually corroborates previous qualitative research or prompts additional questions to fund managers.
What Others Are Saying
Bespoke, The Closer, 11/3/21: “Our view is that the baseline assumption at this stage should be for a July 2022 hike, presaged by the June 2022 SEP. However, with so much time to pass between now and then, it’s hard to have a concrete view about specific policy actions this far out.”
Brian Wesbury, First Trust, 11/5/21: “As we suspected, the end of excess unemployment benefits is making it easier for employers to fill jobs, and this should continue in the months ahead. However, it’s almost as if the Biden Administration is looking for a way to slow this growth by using OSHA to impose vaccine and mask mandates on private companies. This could create more turmoil in the labor market, which we have seen at airlines and hospitals, as employees fight mandates in court and argue over natural immunity. Competing headwinds and tailwinds should make economic data interesting in the months ahead.”
JPMorgan, Global Markets Strategy, 11/3/21: “Investors should fade the recent yield-curve flattening and buy-the-dip in cyclical assets. With fundamentals unchanged and DM central bank delivery likely to be dovish relative to current market expectations, we attribute the recent twist to technical drivers: Month-end rebalancing flows, CTA buying, and breaching of stop-losses for steepener trades. As such, we re-affirm our preference for cyclical assets, which in many cases trade at substantial valuation discounts, and maintain longs in 2Y and shorts in 10Y USTs… Investors should buy the dip in cyclical assets, such as value, small-caps, energy, financials and EM equities, commodities, and position for yields to resume moving higher.”
Strategas, Technical & Macro Strategy, 11/2/21: “Last week we wrote about the seasonal tailwind for small-caps, and we want to reiterate that call today — roughly November through March historically marks the best stretch of the calendar for small vs. large. The breakout from small-caps speaks to a larger message in our work however... there’s very little market evidence that suggests economic growth is slowing. Discretionary continues to outperform Staples, High Beta vs. Low Beta is at fresh multi-month highs, Semis have broken out vs. Software, and globally groups like European Autos are on the relative high list. We’re mindful of the 2/10 flattener over recent weeks, but so long as it holds above 90, we’re OK with the shape of the [yield] curve.”
Mike Wilson, Morgan Stanley CIO, 11/2/21: “In the current environment, it appears that equity markets may have a little more gas in the tank, as seasonal strength and strong retail inflows keep prices elevated even in the face of growing risks… From our seats, at current prices, the risk-reward is unattractive for most broad asset classes, which is why we reduced our overall portfolio risk in early September. The market experienced a decent correction that month — 10% or more for most assets — but we didn’t feel like that was a large enough drawdown to re-risk our portfolios, given what we viewed as the still deteriorating fundamental outlook. Since then, markets have rebounded sharply, and we’re right back to where we started in early September… Should we have bought the dip in September? Maybe. Should we be more bullish now? We don't think so. We see no way the risk-reward is better today than it was three weeks ago when prices were lower and the outlook the same.”
The Market Ear, 11/3/21: “Fund managers that still aren't trading options in order to manage risk/take advantage of volatility are dinosaurs.”
Cameron Addington, Centralis Capital, 11/1/21: “The Fund continues to be long energy equities. The commodity markets are undersupplied and the securities continue to be under-owned (largely for ESG reasons). The opportunity set from an alpha and beta perspective remains extremely attractive.” Note: Centralis is an energy industry specialist fund with $50 million AUM. The fund is up 56.6% (net) YTD as of 10/31/21 with net long exposure of 72%.
Daniel Ades, Kawa Insights, 11/5/21: “Skepticism is perhaps one of the most powerful tools available to investors when making investment decisions. Often mistakenly confused with negativity, skepticism is a healthy way to think critically about potential investments. With this in mind, I want to take the opportunity to shine a light on the euphoria of the current goldilocks environment of technology and asset accumulation, with the rapid creation of wealth witnessed across a large variety of asset classes. This letter will tackle the massive ‘paper’ wealth creation particularly in cryptocurrencies and technology companies... The irony is that while many technology-minded investors fret over the quantitative easing of governments and the creation of fiat money, they have themselves created multiples of that in a variety of markets, simply due to the misconception that because something is ‘limited,’ valuation is irrelevant. The short supply will ensure there will always be a demand, so they say, and prices can only go in one direction: higher. As prices go higher, we have even more paper wealth created. Yet, at Kawa I always like to remind investors that prices go up for only one reason: There are more buyers than sellers. And they go down for only one reason: There are more sellers than buyers. While the vicious cycle of ‘paper money creation’ continues, we will continue having more buyers than sellers. Until when? It is impossible to predict. But one day we will have more sellers than buyers, and the same vicious dynamic that was seen on the upside will be seen on the downside... How do we think of investments with this backdrop? First and foremost, resist the urge to invest because of FOMO (Fear of Missing Out). Secondly, stick to the basics — purchase assets that one understands, and that generate an expected return of capital and thereafter, on capital... Always ask yourself the question: Will this generate future earnings or income that you’d be comfortable owning forever for the price which you paid? The more detached an investment is from this basic question, and the more dependent it is on the fact that ‘someone will buy it for more in the future,’ the more careful one needs to be.” Access the full article here.
This material is for informational and educational purposes only. All data has been compiled from sources believed to be reliable, but there is no guarantee of its complete accuracy.
GDP averaged 2.2% per quarter from April 2009 to December 2019, essentially the post-GFC period leading up to the COVID shutdown.
Consumer Price Inflation (CPI), unit labor costs, and average hourly earnings are provided by the US Bureau of Labor Statistics (BLS).