


Update: Dec '21 Observations
They say markets climb a wall of worry, but 2021 was more like the cliffs of insanity...

Observations & Performance: December 2021
“Markets climb a wall of worry.” The cliche is true, but the last year seemed more like the “cliffs of insanity” from The Princess Pride...

Another truism is the tendency for investors to underestimate growth recoveries as economies emerge from recession. That was the case in 2021: An extended and stronger-than-expected growth recovery following the COVID recession of 2020. Indeed, consumers and corporate managers both were determined to plow ahead and overcome every obstacle ‘21 threw in their path.
Concerns were legitimate, namely the ongoing pandemic, rising inflation, and a pending shift in Fed Policy. At various points throughout the year, these ingredients mixed together to form a bubbly concoction of stagflation fears. However:
With each COVID variant, the virus shows less severe symptoms. This is consistent with the normal progression and points to what we should expect going forward (as we have learned from epidemiologists). Indeed, COVID policies are currently in flux as safety protocols are being recalibrated to reflect less severe symptoms more comparable to the common flu.
Inflation remains elevated, but prices should moderate in 2022. The largest CPI culprits were in goods manufacturing where supply chains were disrupted, but conditions are gradually normalizing (especially with semiconductor production ramping higher). As 2022 unfolds, falling goods prices should help offset increases in prices (and spending) for services. On balance, inflation is expected to decline next year, even if the CPI rate settles into an above-trend range.
The Fed is removing emergency monetary measures, as telegraphed for months, but financial conditions are nowhere near restrictive. Asset purchases will be reduced to zero by March 2022 and rate hikes will probably begin by June, but inflation-adjusted “real rates” could remain firmly negative for an extended period. Considering the strong US dollar and tight corporate spreads, financial conditions remain mostly supportive.
Meanwhile, all these concerns were TRUMPED by the overwhelming strength of consumer/corporate demand. From a high-level perspective, three areas stand out.
US GDP remains well above trend. GDP is estimated to expand 7.6% in Q4 (based on the latest Atlanta Fed GDPNow modeling). That would boost the trailing four-quarter GDP average to 5.7%. For 2022, we are mostly seeing GDP growth estimates in the 4-5% range — well above the 2.2% post-GFC1 average.
US retail sales have increased 19% over the first 11 months of the year. That pace is unsustainable, but spending in 2022 could surpass the 4.0% median level in place during the post-GFC period. Moreover, steady wage growth combined with lower inflation should continue to support real spending power going forward, according to Cornerstone Macro.
S&P 500 profits are on pace to increase by 45-50% this year. And based on consensus analyst estimates, EPS for next year should grow by 6-8% — a level that would beat the median 6.8% growth rate during the post-GFC period.
Stagflation fears are fading. Obviously, “emergency” fiscal stimulus was a “booster shot” to activity over the last 12 months. Federal programs distributed $2.4 trillion to already strong consumer/corporate balance sheets (in aggregate). In fact, surplus cash still remains in place. As a result, consumer spending and corporate investment (CAPEX) are expected to drive above-trend activity in 2022. Inflation might continue above trend next year, but with growth also rambling above trend, stagflation fears should be put to rest for now…
To overview broad asset class performance:
US equities outperformed in 2021 as the re-opening/recovery progressed. S&P 500 (SPY) gained 28.7%. Developed Markets delivered positive returns across most regions; Emerging Markets declined overall on weakness in China, but performance was broadly dispersed across regions. MSCI EAFE (EFA) gained 11.5%, but Emerging Markets (EEM) dropped -3.6%.
High-quality fixed income declined in 2021 as interest rates moved higher. US Aggregate Bond (AGG) showed a loss of -1.7%. Credit spread strategies — high-yield corporate bonds and floating-rate bank loans — delivered modest gains. HY corporates (JNK) gained 4.0%.
Commodities gained in 2021 with growth-sensitive Energy and Base Metals leading the way. Diversified Commodities (DBC) gained 41.4%.
Crypto-currencies gained traction in 2021. Bitcoin (BTC) and Ethereum (ETH) reportedly comprise ~60% of the crypto-coin universe. For the year, BTC and ETH gained 59.7% and 399.1%, respectively. In Q4, BTC gained 5.7% despite being mired in a current drawdown of -30.9% since peaking on 11/9.2

Sources: CCM, Koyfin

IN DECEMBER: US/global risk assets stumbled out of the gate due to the rapid spread of the Omicron variant. Headlines emerged over the Thanksgiving holiday and markets were still reeling in the days that followed. In our November ‘21 Observations published on 11/30 amid a sharp sell-off for risk assets, we summarized our perspective based on various research sources we follow:
“We suspect the panic headlines are overdone and the severity of the virus will be mild and/or treatable for the vast majority of the population — as we have witnessed with the Delta variant. Regardless, time and data will bring clarity.”
Sure enough, ensuing data confirmed Omicron to be highly contagious — but with relatively mild symptoms in most cases.
Market fears quickly abated and by mid-December, the S&P 500 fully recovered its Omicron losses. From that point, investors digested the Fed Policy shift and navigated a difficult options expiration week, then technical/liquidity conditions stabilized and seasonal factors took hold lifting equity prices into year-end.
December returns mostly followed the pattern of 2021 as US equities outperformed other regions. S&P 500 (SPY) gained 4.6% and Developed Markets (EFA) were close behind with a gain of 4.4%.
High-quality bonds declined with rates moving higher all along the yield curve, but spread strategies delivered gains. US Aggregate Bond (AGG) declined -0.30% and long-duration USTs (TLT) were down -2.0%. HY corporates (JNK) and Emerging Markets (EMB) both gained 2.4%.
Commodities rebounded with the biggest gains from economic-sensitive Energy, and specifically WTI Crude prices. Diversified Commodities (DBC) gained 6.7%.

Sources: CCM, Koyfin

IN Q4: Asset class returns ebbed and flowed based on risk-on/risk-off sentiment, but US equities delivered solid gains. After suffering through the largest drawdown of the year in September — mostly driven by stagflation fears — equities rallied to begin Q4 as corporate earnings season delivered a resounding message: US corporations are more than capable of navigating a tough environment. Despite rising input prices, supply chain delays, and labor shortages, US companies delivered positive profit and revenue results, reflecting strong end-user demand and reasonable pricing power. The positive momentum carried into late November before Omicron headlines hit, prompting losses for the month. But the declines were only temporary as US/global risk assets rallied into year-end as Omicron feared faded.
US equities dominated global markets in Q4, driven by a strong corporate earnings season. S&P 500 (SPY) and Nasdaq 100 (QQQ) gained 11.1% and 11.3%, respectively.
US yield curve twisted and flattened in Q4. Short rates moved higher, but long rates declined. As a result, US Aggregate Bond (AGG) declined -0.10%, but long-duration USTs (TLT) gained 3.2%. Spread strategies posted modest gains.
Commodities delivered gains in Q4, but Energy lagged. Base Metals outperformed. Precious Metals and Agriculture also gained. Diversified Commodities (DBC) gained 3.0% in Q4.

Sources: CCM, Koyfin

Don’t be blue in ‘22 — Coffee & Capital Markets will be here for you!
We aim to deliver timely and relevant data/insights. For full access to the recurring content of Coffee & Capital Markets, please join our community as a paid subscriber.
US/Global Equities
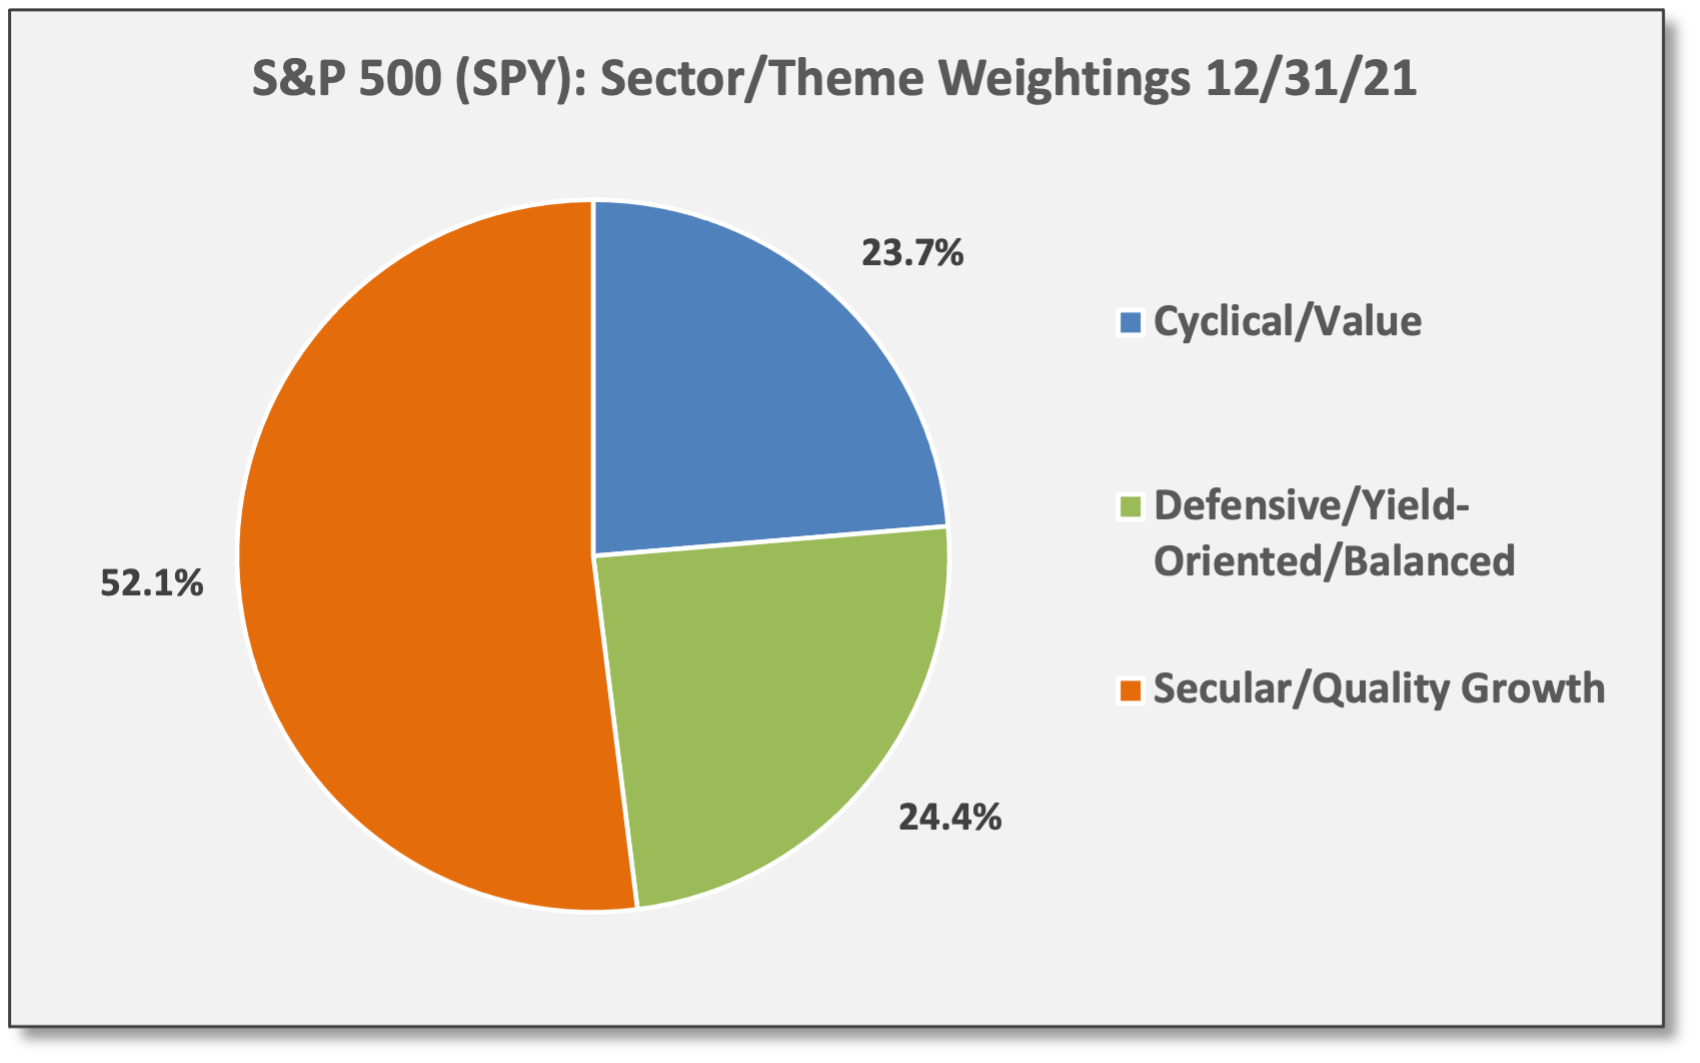
US equities were the consistent leaders throughout 2021. Developed Markets also produced gains. Emerging Markets declined as a group, but performance varied dramatically across underlying countries and regions. In the US, cyclical/value and secular/quality growth both performed well.
For 2021, the “median” S&P 500 stock gained 27.6%. Thus, half the constituents in the US benchmark index scored a return above that level and half scored below. The “average” stock gained 30.0% in 2021. In this context, performance leadership was not as narrow as some might suggest. (Of course, the 28.7% gain for the S&P 500 (SPY) reflects the market-cap weighted return.)
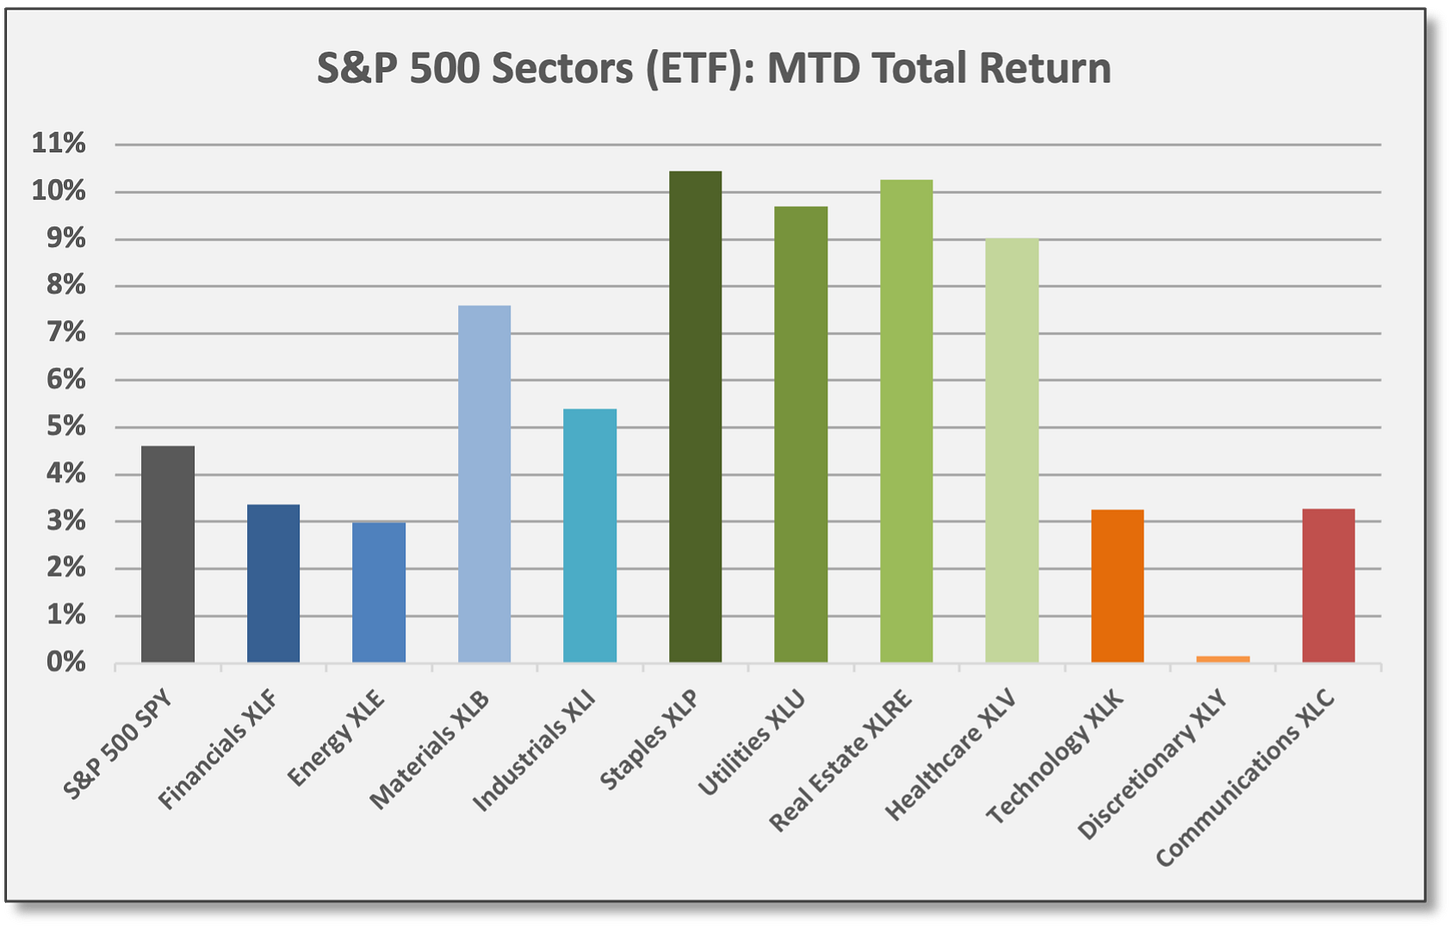
All 11 S&P 500 sectors delivered positive returns in December and 2021.
Defensive/yield-oriented and balanced sectors shined in December. The defensive groups — shaded in green in the chart below — were competitive in Q4, but lagged for most of the year. Consumer Staples (XLP) were the top performer in December with a gain of 10.4%. For the year, Staples were the “weakest” performer with a gain of 17.2%. Real Estate (XLRE) — long perceived as a defensive/yield-oriented sector — gained 46.1% in 2021, but the sector benefited from top holdings in growth-oriented digital communications.
Cyclical/value sectors mostly lagged in December and Q4, but were strong performers for 2021. Energy (XLE) and Financials gained 53.3% and 34.8% for the year.
Secular/quality growth sectors lagged in December, but still delivered gains. For 2021, Technology (XLK) and Consumer Discretionary (XLY) gained 34.7% and 27.9%, respectively.
Sources: CCM, Koyfin 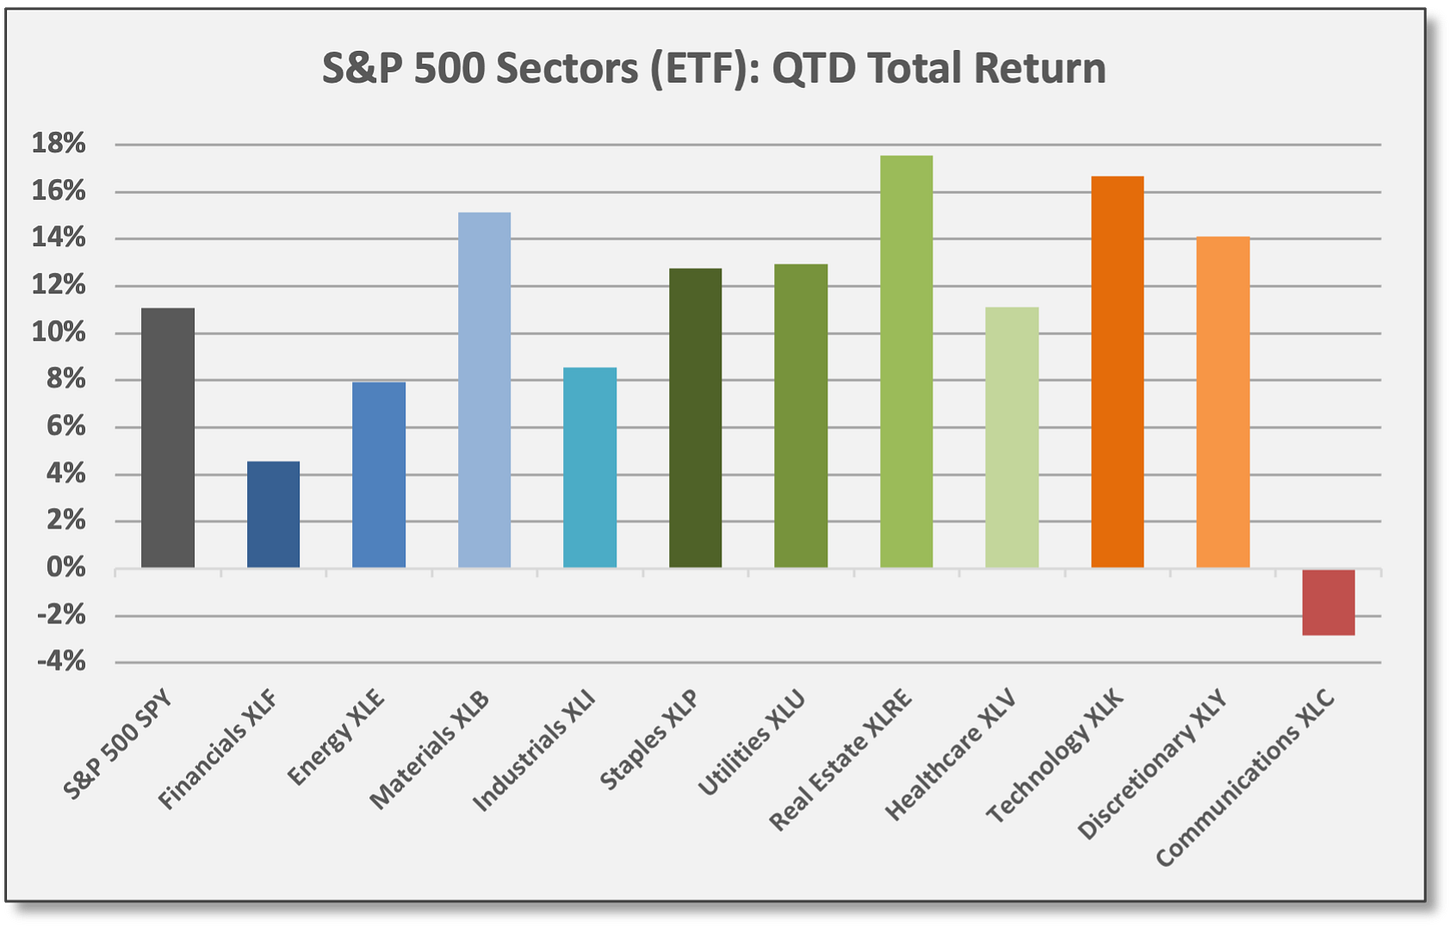
Sources: CCM, Koyfin 
Sources: CCM, Koyfin 
Sources: CCM, Koyfin 
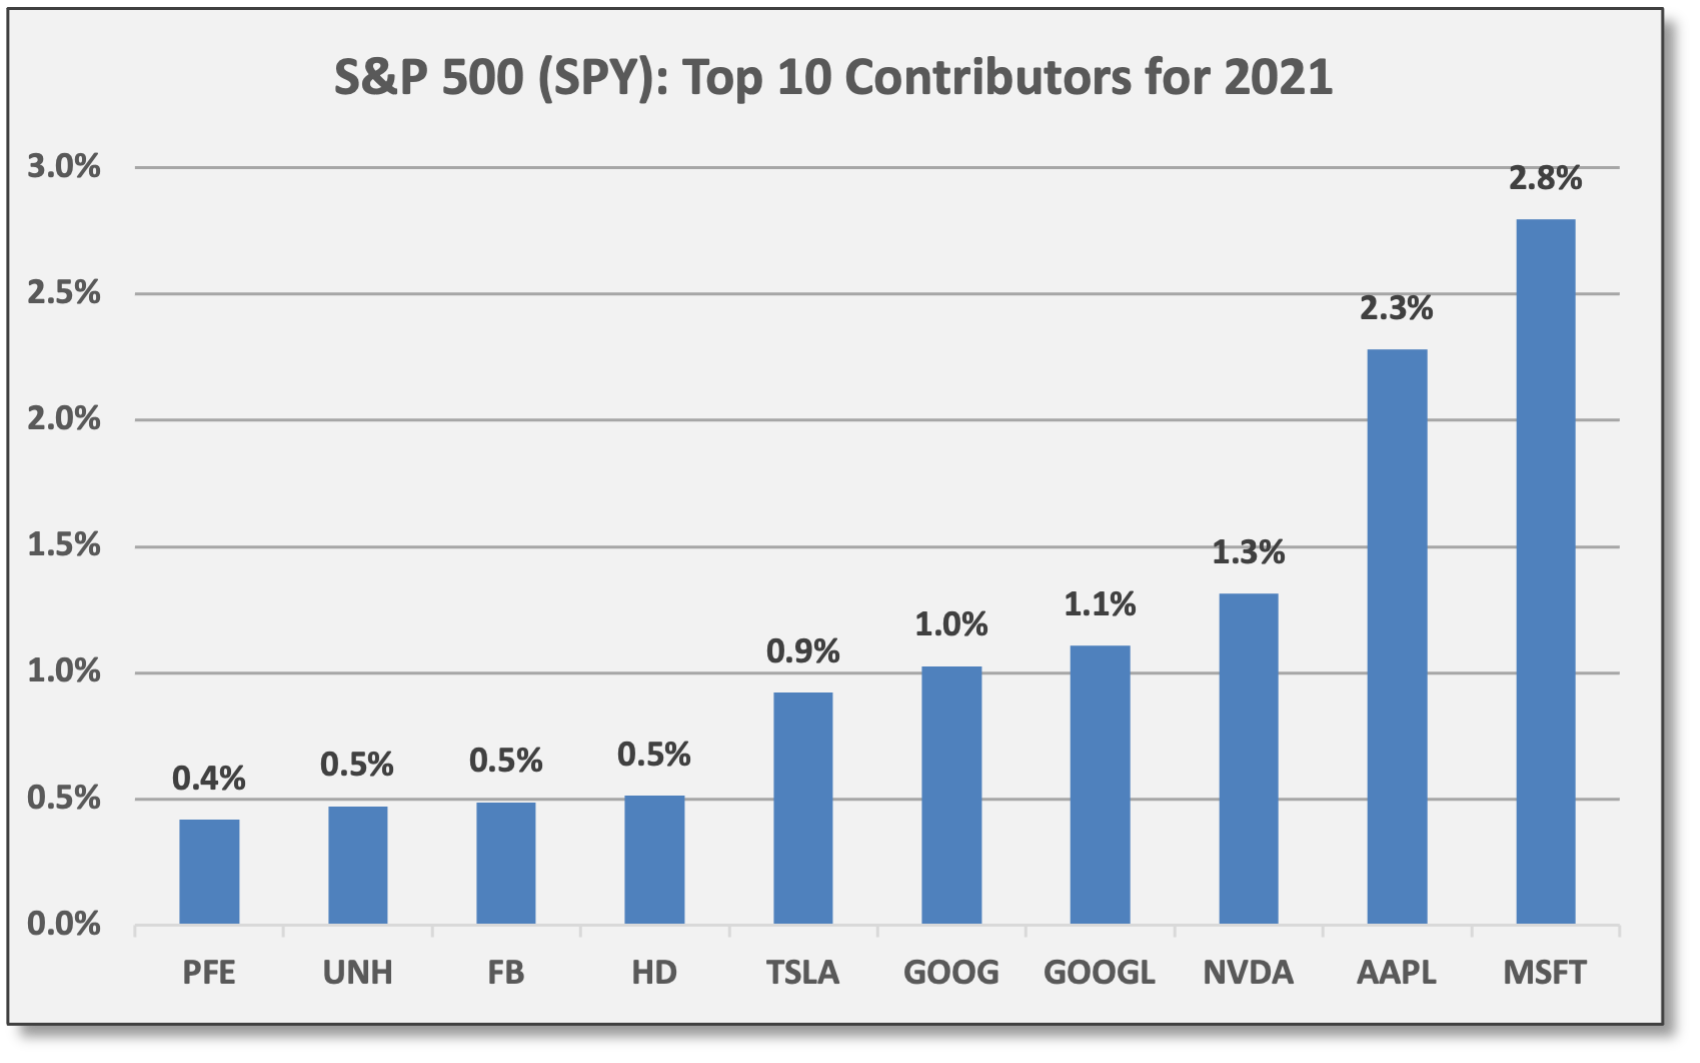
Sources: CCM, Koyfin For 2021, the top 10 contributors to the S&P 500 (SPY) produced positive attribution of 11.3%. The top 10 includes two share classes for Alphabet (GOOG/L); if we include Berkshire Hathaway (BRK/B), the next largest contributor, the top 10 companies account for 11.7% of positive return. Devon Energy (DVN) was the top gainer in the S&P 500 with a ‘21 return of 195.9%.
The bottom 10 contributors accounted for negative attribution of -0.8%. The largest detractor for the year was PayPal (PYPL), which declined -19.5%, costing the SPY ~17 basis points of negative attribution. The rest of the bottom-10 is riddled with Communications companies, including DIS, ATVI, VZ, T, TMUS, and TWTR.

Sources: CCM, Koyfin

Four S&P 500 sectors are ~50% concentrated in their top three holdings. Communications Services (XLC), Technology (XLK), Energy (XLE), and Consumer Discretionary (XLY) all have densely concentrated exposures in their top three holdings. Concentration levels are illustrated below. Following the largest single-name equities helps in tracking sector/industry and theme-based performance.
Essentially, tracking the largest positions informs us on what is moving the S&P 500 and the underlying sectors. For instance, Prologis (PLD) is the #2 holding in Real Estate (XLRE) with a weighting of 11.1%; PLD gained 34.8% in Q4 (not shown) and finished 2021 with a gain of 72.3%. PLD contributed nearly 700 basis points of positive attribution to XLRE this year.

Sources: CCM, Koyfin (Click to enlarge) 
Sources: CCM, Koyfin (Click to enlarge)


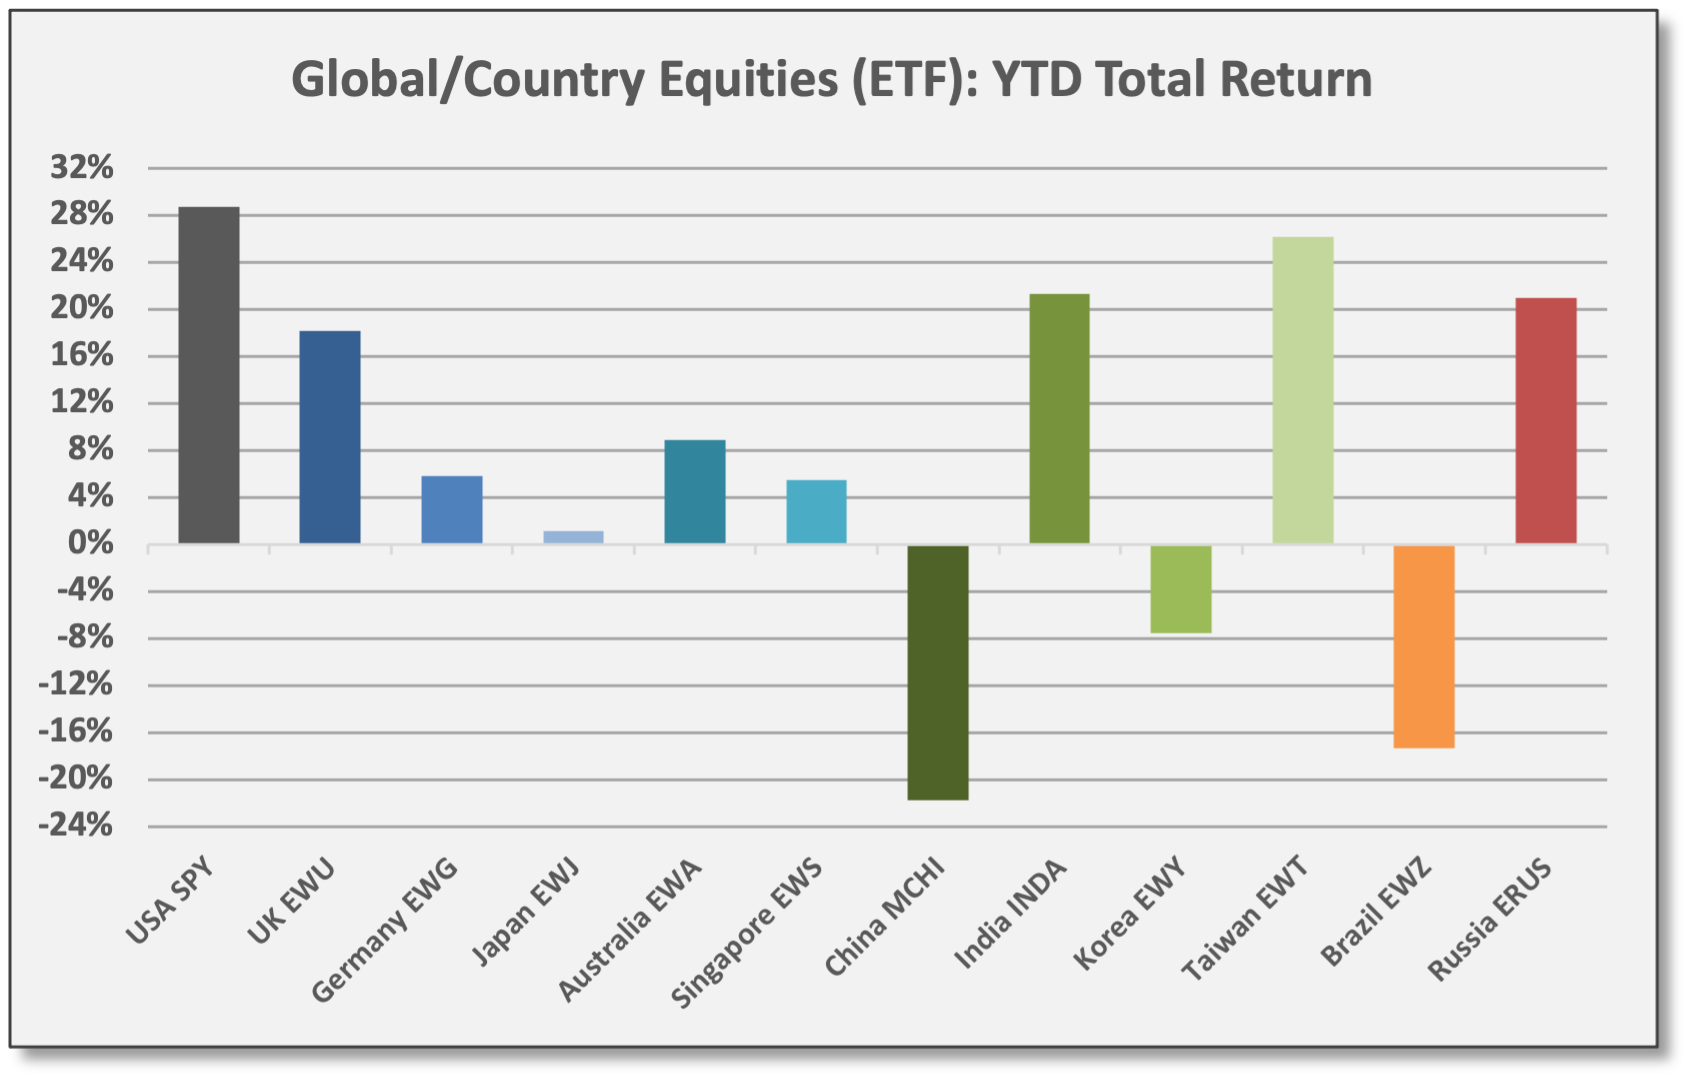
Aside from US equities, all major Developed Markets delivered gains in ‘21. United Kingdom (EWU) was the top performer for December, Q4, and the full year, closing ‘21 with a gain of 18.2%. For the year, no other major DM country delivered a double-digit gain.
Emerging Markets were mixed in 2021. China, the largest weighting in the EM Index at 32%, struggled with (1) a growth slowdown, (2) regulatory policies aimed at large Technology/Media/eCommerce leaders that entailed wealth redistribution, and (3) the deleveraging of the real estate sector. MSCI China (MCHI) declined -21.7% in 2021. Meanwhile, Taiwan (EWT) was the top-performing EM with a gain of 26.2% bolstered by Technology which comprises over 60% of the fund. Russia (ERUS) gained 21.0% in ‘21, benefiting from Energy exposures, a 48% weighting in the fund.

Sources: CCM, Koyfin 
Sources: CCM, Koyfin 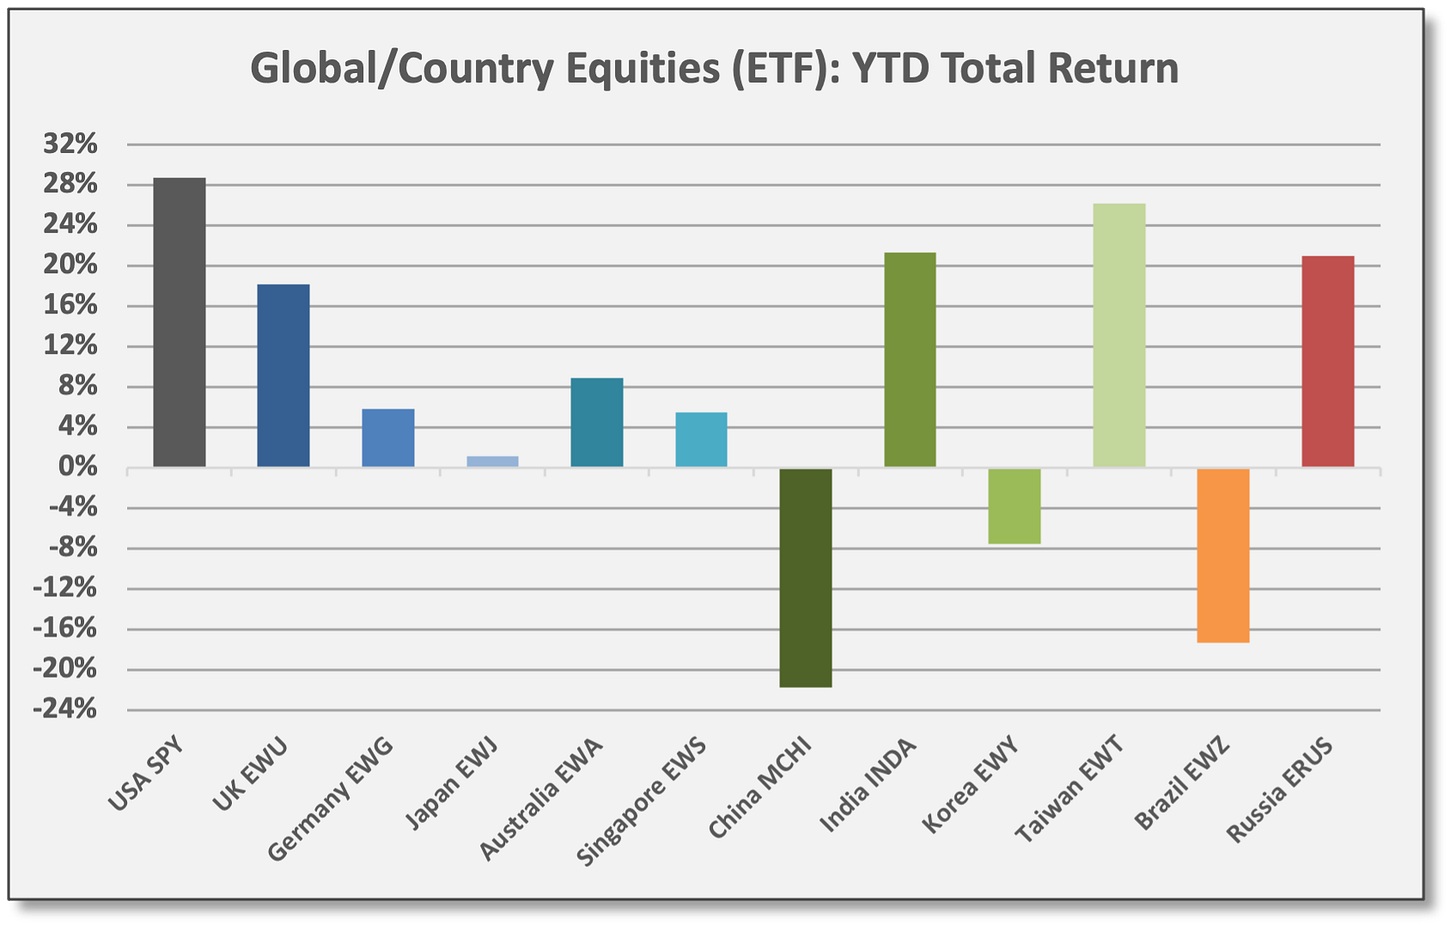
Sources: CCM, Koyfin


Fixed Income & Credit
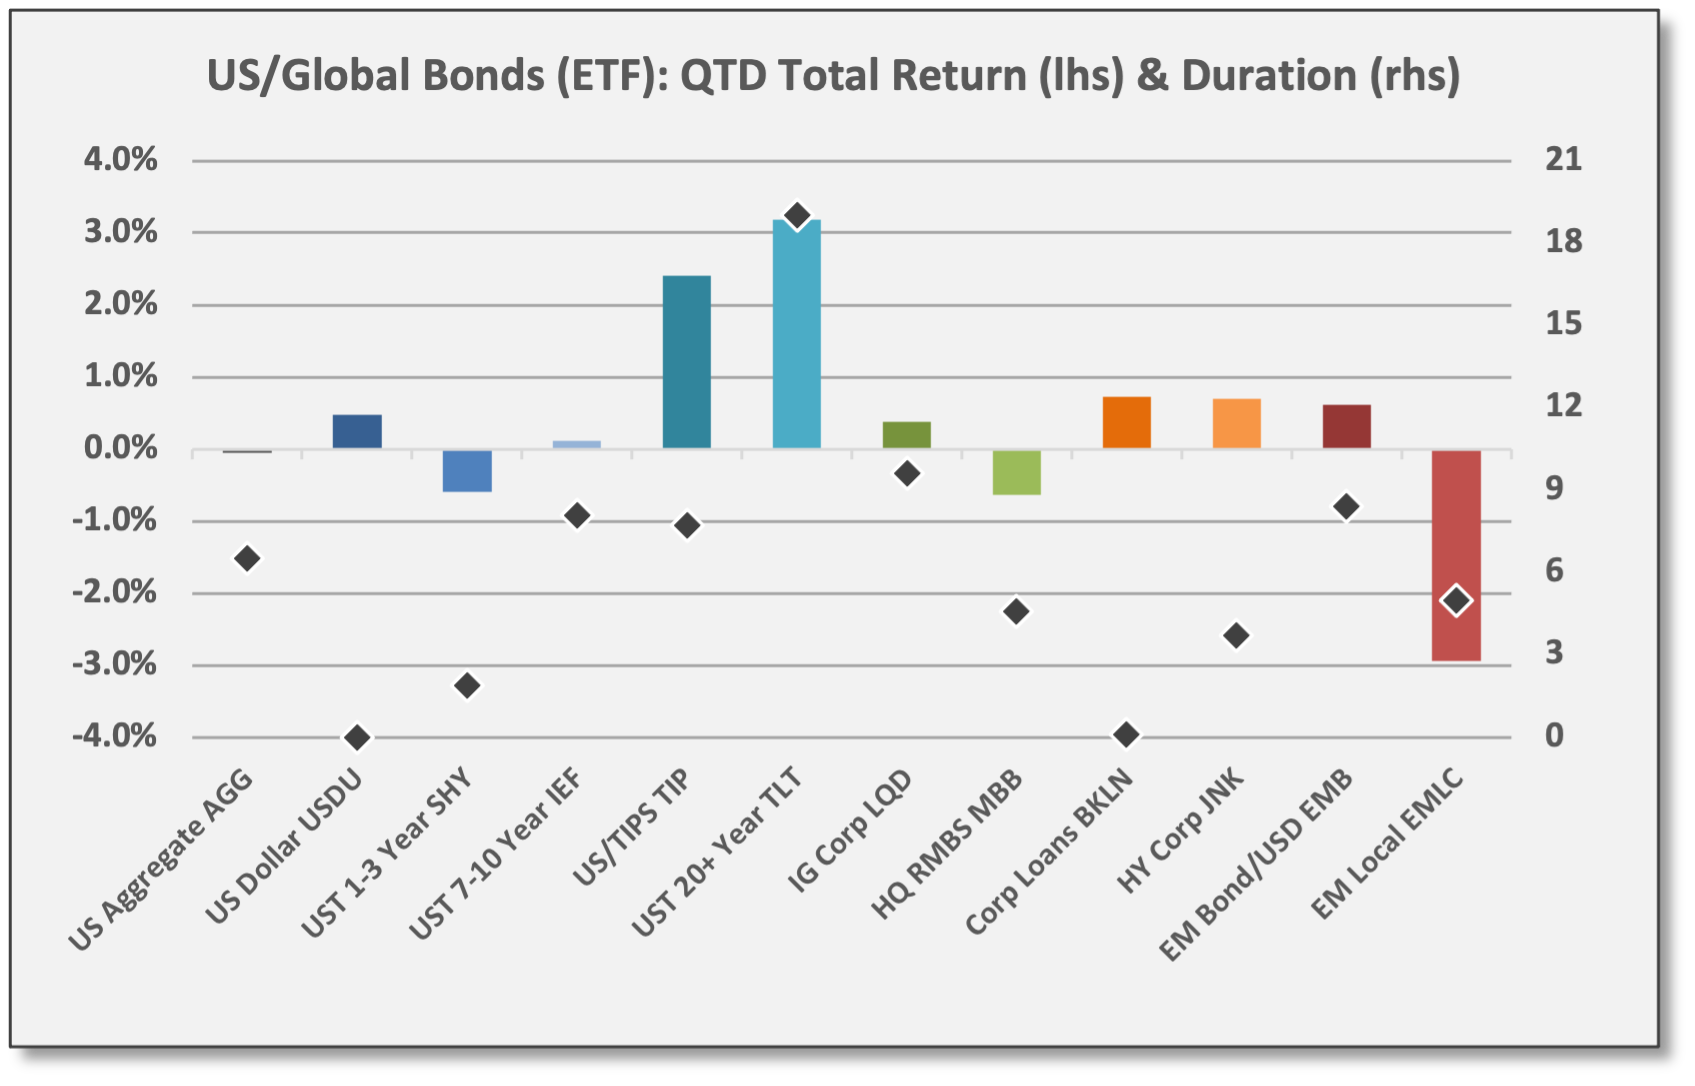
Fixed income underperformed throughout most of 2021 as interest rates moved higher. Rising rates pressured high-quality duration-sensitive bonds, but US-based credit strategies delivered gains from a mix of income and spread tightening.
US Aggregate Bond (AGG) was hobbled all year due to rising rates. AGG — the multi-sector proxy for US fixed income — declined in December and was modestly lower in Q4 to finish down -1.7% for 2021.
Most high-quality bonds struggled in 2021, but inflation-protected bonds were the exception to the rule. US Treasury TIPS (TIP) were up in December and Q4 as CPI surged. For 2021, TIPS were the top-performing bond sector with a gain of 5.7%. The US dollar (USDU) also gained in 2021, ranking as the second-best performer. We include the USD in our fixed income analysis because of its safe-haven attributes similar to USTs.
Credit strategies rallied in December along with equities and other risk assets. HY corporate bonds (JNK) added positive returns in Q4 to finish the year with a gain of 4.0%.

Sources: CCM, Koyfin 
Sources: CCM, Koyfin 
Sources: CCM, Koyfin


Commodities & Real Assets
Diversified Commodities delivered strong gains in 2021 with growth-sensitive Energy and Base Metals leading the way. Returns were especially strong in the first half of the year.
Energy was far and away the top performing commodities sector in 2021. Energy (DBE) rebounded in December as Omicron risk faded, but results were mixed in Q4. For the year, DBE was up 57.6% with WTI Crude (CL1) up 55.0%.
Base Metals (DBB) also delivered solid gains driven by the global recovery and persistent demand for electric vehicles and other green technologies. DBB was the top performer in Q4 and finished 2021 with a gain of 29.0%. Aluminum (LMA) gained 41.1% in 2021.
Agriculture (DBA) produced steady returns in ‘21 as a non-cyclical commodities sector. DBA finished with a gain of 22.4%. Corn and Wheat futures were top performers in 2021 as illustrated below.
Precious Metals lagged most of the year, failing to deliver meaningful inflation protection. Gold (XAU) finally produced positive return in December and Q4 as CPI surged higher, but XAU finished 2021 down -3.8%. In part, Gold suffered this year as fund flows were directed to Bitcoin (BTC) and other crypto-currencies, although Gold outperformed BTC late in the year.

Sources: CCM, Koyfin 
Sources: CCM, Koyfin 
Sources: CCM, Koyfin
This material is for informational and educational purposes only. All data has been compiled from sources believed to be reliable, but there is no guarantee of its complete accuracy.
We reference the “post-GFC” period beginning in Q1 2009, the first calendar year following the depths of the Global Financial Crisis. The US economy did not emerge to post consistently positive GDP growth until Q3 2009, but the S&P 500, anticipating recovery, bottomed in March 2009 and turned higher.
Returns based on “closing price” data reported by Yahoo! Finance. We reference in quotes because BTC and ETH trade continuously, so “closing” values reflect prevailing prices at 4:00 p.m. ET.