


Update: Apr '22 Observations
Tossing aside seasonal patterns, equity markets deteriorated in April...

Observations: April 2022
“Thus fear of danger is ten thousand times more terrifying than danger itself.”

This quotation is from Robinson Crusoe, written by British author Daniel Defoe and originally published in 1719. Last Monday, Bespoke Investment Group applied this interpretation to prevailing market conditions and investor sentiment.
“Fears and uncertainty in the market tend to be scarier than the actual events themselves… How far the markets ultimately fall is anyone’s guess, but by the time the Fed actually goes ahead and starts the aggressive pace of hikes, the market will likely have discounted much of it already.” Bespoke Investment Group, 4/25/22
“Fears and uncertainty in the market tend to be scarier than the actual events themselves,” according to Bespoke. “The most dangerous aspects of the market are the Fed and fears of an economic slowdown spurred on by fears of additional lockdowns in China. While at this point the Fed has only raised rates 25 basis points (bps), fears of 50 or even 75 bps hikes at upcoming meetings are what really have investors on edge. The S&P 500 is already in correction territory while the Nasdaq and Russell 2000 are closer to bear market territory. How far the markets ultimately fall is anyone’s guess, but by the time the Fed actually goes ahead and starts the aggressive pace of hikes, the market will likely have discounted much of it already.”
As April concluded, losses for US equities were driven by more than just irrational fears and sentiment. Several high-profile earnings reports produced lower-than-expected results including unfavorable forward-looking guidance. During the last several trading sessions of the month, for instance, Amazon (AMZN), Alphabet (GOOG/L), and Meta Platforms (FB) all delivered EPS and/or revenue “misses” versus estimates — and all reported lower profits versus a year ago. For detail on these and other corporate earnings reports, see our Weekly Briefing this Sunday, 5/1/22.
Mounting Concerns: Setting aside seasonal patterns — April tends to be one of the better performing months for equities, but not this time — the weight of various events and policies were too much to bear over the last 30 days.
Ironically, our sense is that inflation and Fed Policy are in the process of peaking, but other problems emerged in April, namely reduced economic activity and lower corporate profits.
By mid April, AAII Investor Sentiment had sunk to a 30-year low; bullish sentiment remained well below average at month-end.1 Ironically, our sense is that inflation and Fed Policy are in the process of peaking as goods prices pivot lower (and may soon turn deflationary) and Powell takes a “front-end loading” approach to rate hikes, but other problems emerged in April, namely reduced economic activity and lower corporate profits.
The following concerns and issues stood out in April:
Aggressive Fed Policy: Ongoing concerns about inflation and Fed Policy with Chair Powell suggesting the FOMC will hike rates by 50 basis points in May and again possibly in June. Futures markets are predicting the FOMC will set policy rates at 3.25% by year-end.
Recession Fears & Negative GDP: With recession fears triggered by the yield curve inversion that opened April — even though the inversion soon faded and only points to a potential slowdown well into the future — apprehension mounted in late April when the US economy reported a contraction for Q1. Real GDP declined -1.4% when the consensus expected a modest expansion of ~1%. Consumption gained 2.7%, but inventories, government spending, and net exports all subtracted from growth. Based on the textbook definition of a recession — two consecutive quarters of negative GDP growth — we are half-way there.
High-Profile EPS Misses: Corporate earnings season stumbled out of the gates in April — at least based on industry leaders in Financials (JPM) along with growth-oriented Consumer Discretionary (AMZN) and Communications Services (GOOG/L, FB, NFLX). Aside from several high-profile “misses” like these, S&P 500 EPS are on pace to increase ~8% for Q1 based on actual results so far and estimates for companies yet to report. The Q1 EPS growth projection is up from ~4% two weeks ago.
Short-Gamma Conditions: One again, short-gamma conditions for options dealers amplified losses in April. When investors buy puts and calls, options dealers are short volatility. Dealers profit as market-makers, collecting a bid-ask spread, not by taking directional positions. Under short-gamma conditions and to “delta hedge” their positions, dealers must (1) sell equities as prices decline and (2) buy equities as prices increase. This action amplifies price moves in both directions, but in April, the delta-hedging was mostly to the downside. Before moving lower at month-end, the CBOE Equity Put/Call Ratio spiked to its highest level since March 2020 at the depth of the COVID sell-off.
Cross-Asset Performance: April 2022
In April, US/global equities and fixed income declined. In the US, high-beta and growth-oriented shares declined the most. As a result, non-US markets outperformed by declining less. In fixed income, long-duration bonds declined the most as interest rates moved higher. Across broad asset classes, only the US dollar and commodities delivered gains with energy leading the way for the latter.
For the month, the S&P 500 (SPY) declined -8.8%. Nasdaq 100 (QQQ) and Russell 2000 (IWM) declined -13.6% and -9.9%, respectively. MSCI Developed Markets (EFA) and Emerging Markets (EEM) declined -6.7% and -6.1%, respectively. In bonds, the US Aggregate Bond (AGG) declined -3.8%, but UST 20+ Year (TLT) dropped -9.4%. The US dollar (USDU) gained 4.0% in April and Diversified Commodities (DBC) gained 5.6%.

For 2022, SPY and AGG are down -13.0% and -9.4%, respectively. QQQ is trapped in a bear market with a ‘22 loss of -21.2% with Russell 2000 small-cap shares (IWM) down -16.7%. EFA and EEM are down a less severe -12.8% and -13.2%, respectively. Long-duration USTs (TLT) are down -19.1% for ‘22. HY Corporate Bonds (JNK) are down -9.1%.
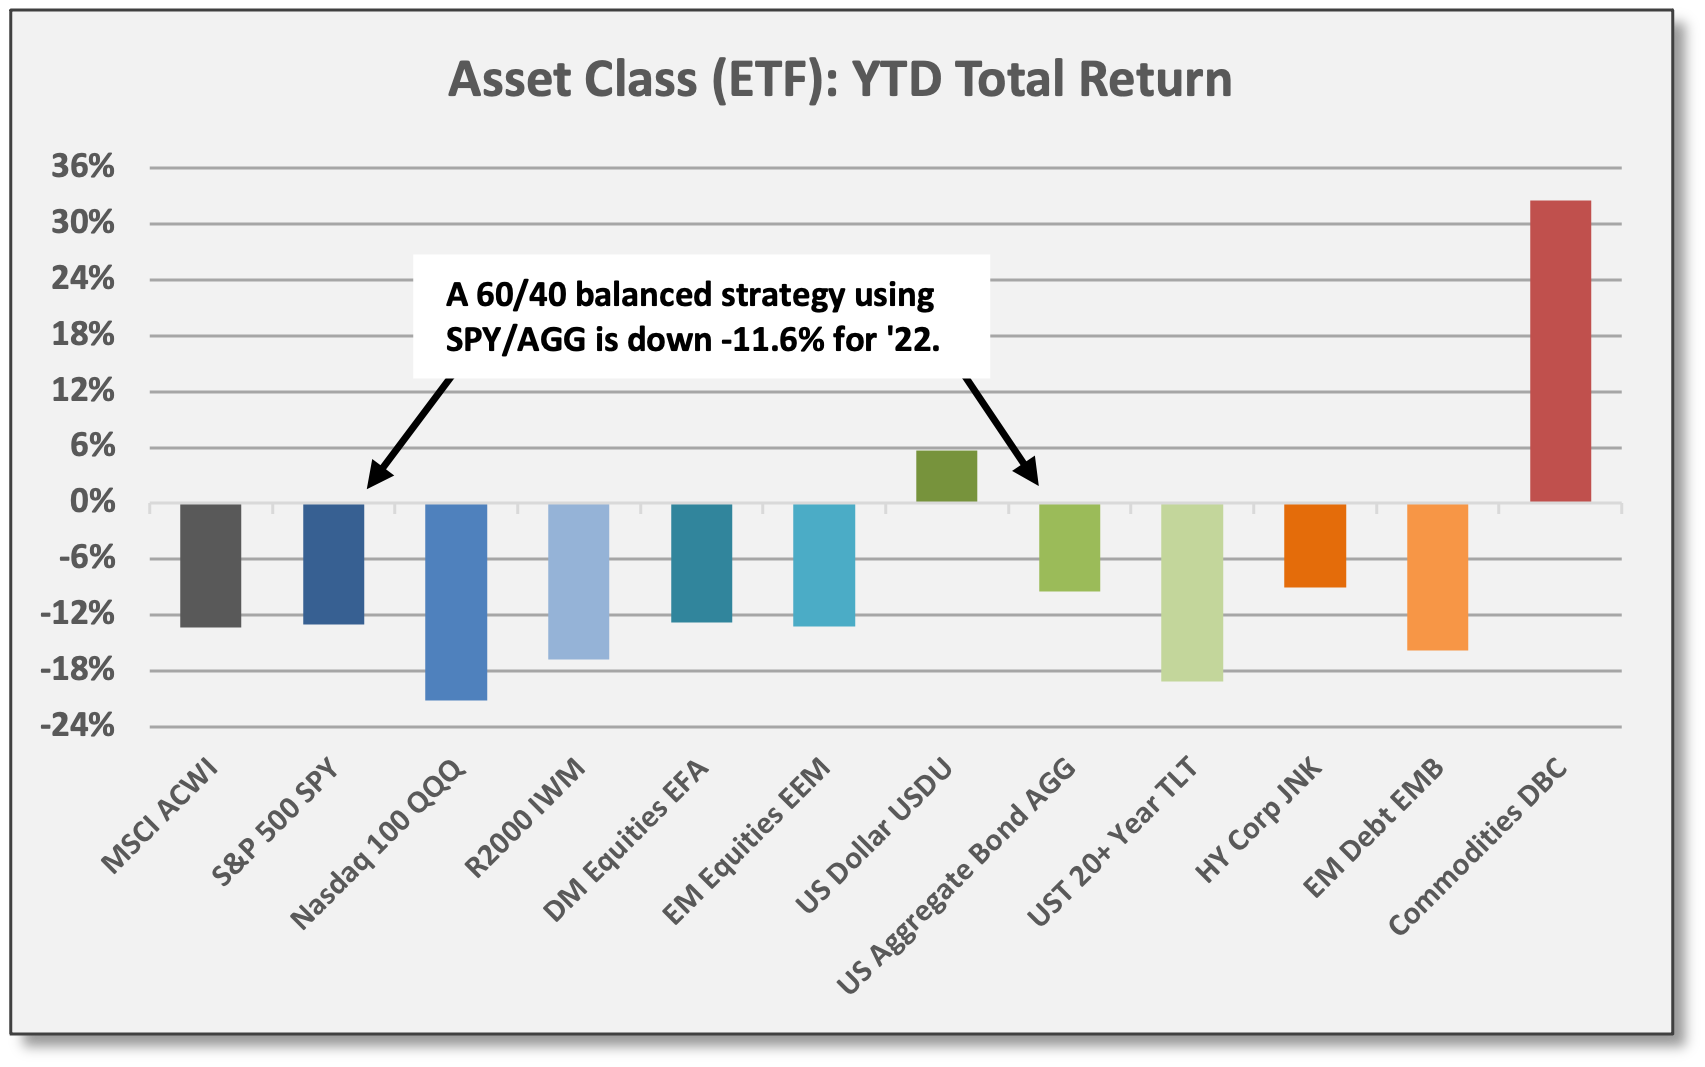
As of the end of April, a simple 60/40 balanced strategy using the S&P 500 (APY) and the US Aggregate Bond (AGG) is down -11.6% — assuming no rebalancing so far this year. Interestingly, since equity and bond prices have shown positive correlation this year — both asset classes showing losses — the relative allocations are virtually unchanged from the start of the year. Market values are lower, but the relative mix is mostly the same. Based purely on YTD total return — with no periodic rebalancing so far this year — a 60/40 blend of the SPY/AGG to begin the year would now reflect a 59/41 mix.
Depending on time horizons and other investment objectives, discretionary or tactical rebalancing decisions might take action based on forward-looking relative risk/reward attributes between equities and fixed income.
At this juncture, simple rebalancing formulas probably are not being triggered. Depending on time horizons and other investment objectives, however, discretionary or tactical rebalancing decisions might take action based on forward-looking relative risk/reward attributes.


We aim to deliver timely and relevant data/insights.
Monthly updates are designed as a recap and data reference in contrast to our weekly briefings which provide extensive commentary from across our research network.
For full access to the recurring content of Coffee & Capital Markets, please join our community as a paid subscriber.
US/Global Equities
As mentioned above, high-profile US industry leaders posted sub-par fundamental results in April, although overall profits for the S&P 500 actually are beating estimates during the current earnings season. None of that mattered in April with losses amplified by short-gamma conditions from options dealers (forced selling of equities for hedging purposes).
S&P 500 (SPY) declined -8.8% in April and is down -13.0% for 2022.
High-beta and growth-oriented equities underperformed value in April. Nasdaq 100 (QQQ) and Russell 2000 (IWM) declined -13.6% and -9.9%, respectively.
Large Growth (IWF) dropped -12.2% compared to a loss of -5.8% for Large Value (IWD).
For the month of April, only Staples (XLP) delivered a positive return. Technology (XLK), Consumer Discretionary (XLY), and Communications Services (XLC) showed double-digit losses. More detail on single-name performance attribution is offered below.

For 2022, only Energy (XLE) has delivered meaningly positive return, although Staples and Utilities (XLU) are marginally positive.


S&P 500 Performance Attribution: In the charts below, we highlight the largest positive/negative contributors for 2022. Energy leaders Exxon Mobil (XOM) and Chevron (CVX) are the top positive contributors for ‘22. Microsoft (MSFT) and Amazon (AMZN) are the top negative contributors based on a mix of size and performance.
For April, the top positive contributors were Merck (MRK), Proctor & Gamble (PG), and Exxon Mobil (XOM) with gains of 8.7%, 3.9%, and 3.5%, respectively. MRK and PG added four basis points (bps) each and XOM added three bps.


The largest negative contributors in April were Amazon (AMZN), Apple (AAPL), Microsoft (MSFT), and Nvidia (NVDA) with declines of -26.8%, -11.9%, -12.0%, and -35.3%, respectively. AMZN subtracted 113 bps; AAPL and MSFT posted decent earnings results, but subtracted 84 bps and 73 bps for the month, respectively. NVDA subtracted 66 bps.


Concentration Levels & Top Performers by Sector: Technology (XLK) and Energy (XLE) are the two most concentrated sectors with the top three positions comprising 49.4% and 49.1%, respectively. Consumer Discretionary (XLY) and Communications Services (XLC) have top-3 concentration levels over 46%.

Subsequent charts illustrate April and YTD performance for the top two holdings across all 11 S&P sectors. Sector weightings for the S&P 500 also are provided.


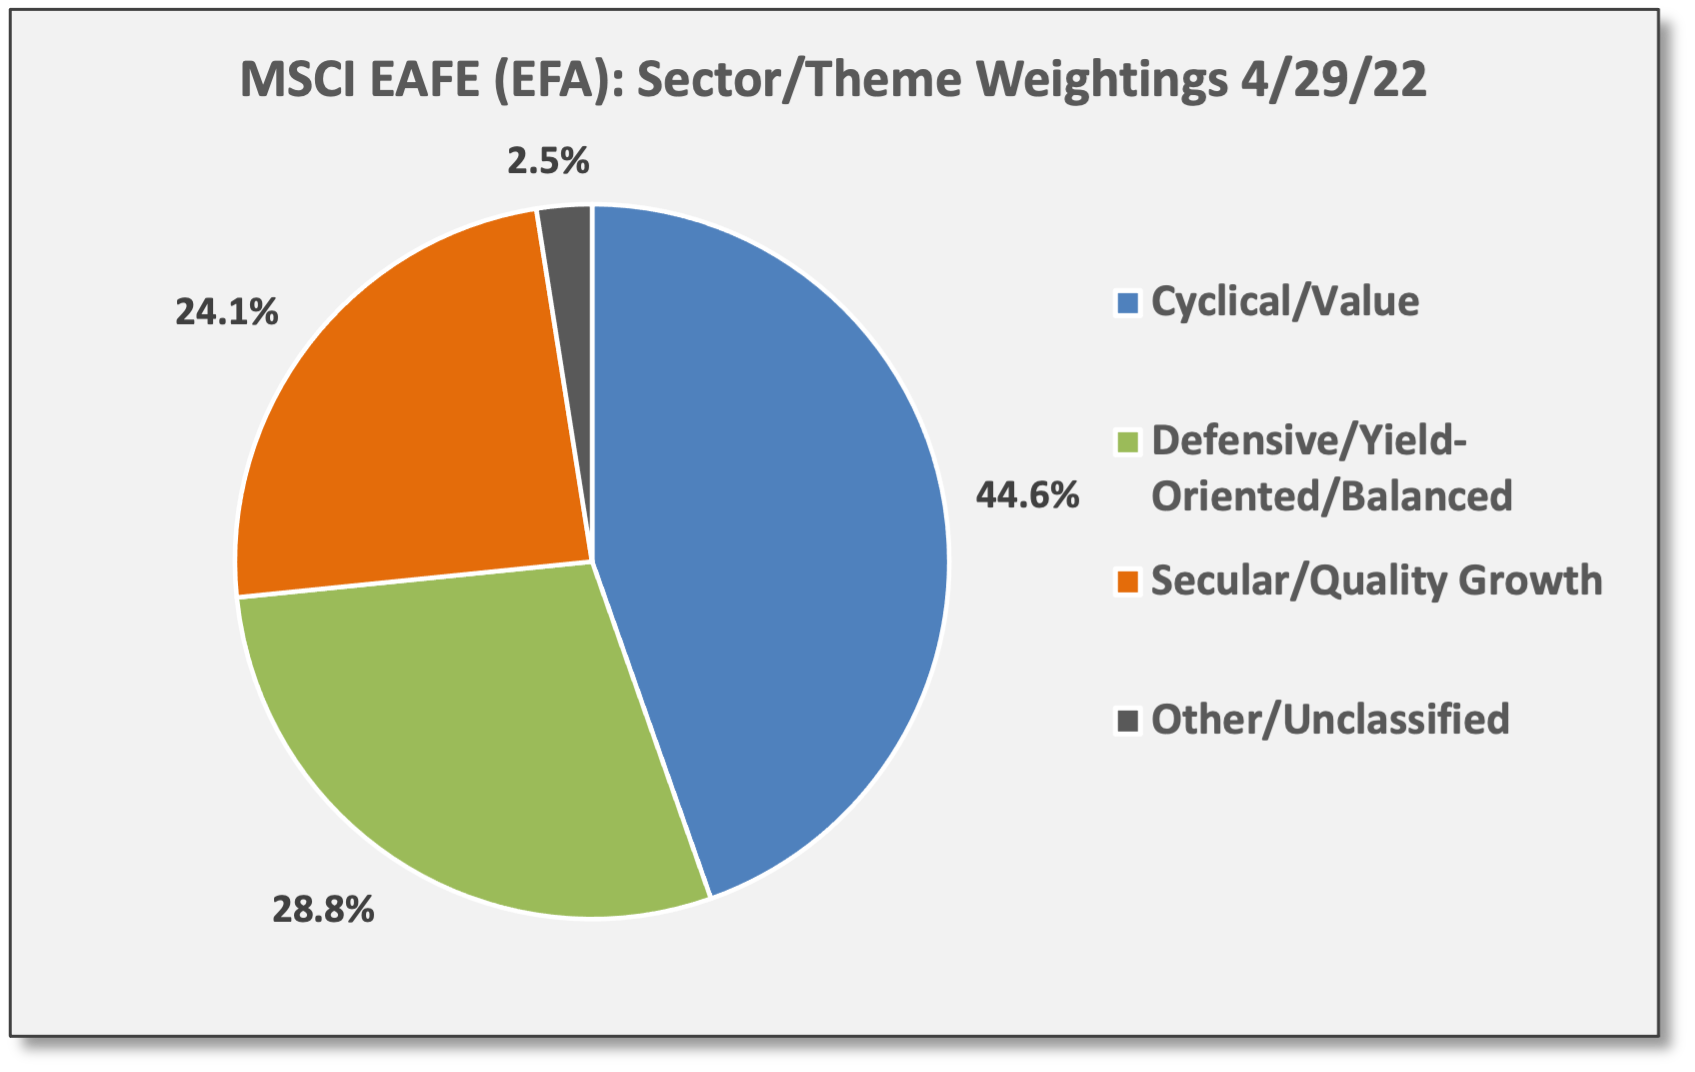
Non-US markets tend to be more cyclical/value and less exposed to high-valuation growth shares. MSCI China (MCHI) is one exception to that rule. However, even if global growth is sputtering and cyclicals are struggling to gain traction — evident from disrupted global supply chains and the negative “net exports” in the recent US GDP report — international equities declined less in April. This is largely explained by less exposure to the fundamental growth factor and less exposure to the related technical selling pressure.

Consequently, non-US markets outperformed in April by declining less than US equities. Of the major markets we track, only energy-oriented Saudi Arabia (KSA) delivered positive return in April with a gain of 6.8%.

For 2022, non-US equities are mostly performing in line with the S&P 500. Non-US markets were outperforming at the start of the year, but played catch-up on the downside once the Russia-Ukraine War commenced in late February. Resources-oriented Brazil (EWZ) and Saudi Arabia (KSA) are the top performers for ‘22 with gains of 16.7% and 23.9%, respectively.

Japan, Germany, and the UK have heavy exposures to cyclical/value. In MSCI Developed Markets (EFA), Japan, the UK, and Germany are among the top country weightings. Looking through to underlying markets, Japan (EWJ) has a ~38% allocation to Financials, Industrials, Energy, and Materials — the major cyclical/value sectors. For Germany (EWG), the combined exposure is ~40% and for the United Kingdom (EWU), the exposure is ~50%. S&P 500 (SPY) exposure to these four sectors is ~26%.


In Emerging Markets, value and growth exposures vary across underlying markets. China (MCHI) is heavy in growth-oriented Consumer Discretionary, Communications and Technology with ~51% to those three sectors. Taiwan (EWT) has a ~56% concentration in Technology (dominated by Taiwan Semiconductor). Korea (EWY) is more balanced with ~33% in Technology, but ~25% to cyclical/value and manufacturing-related sectors.


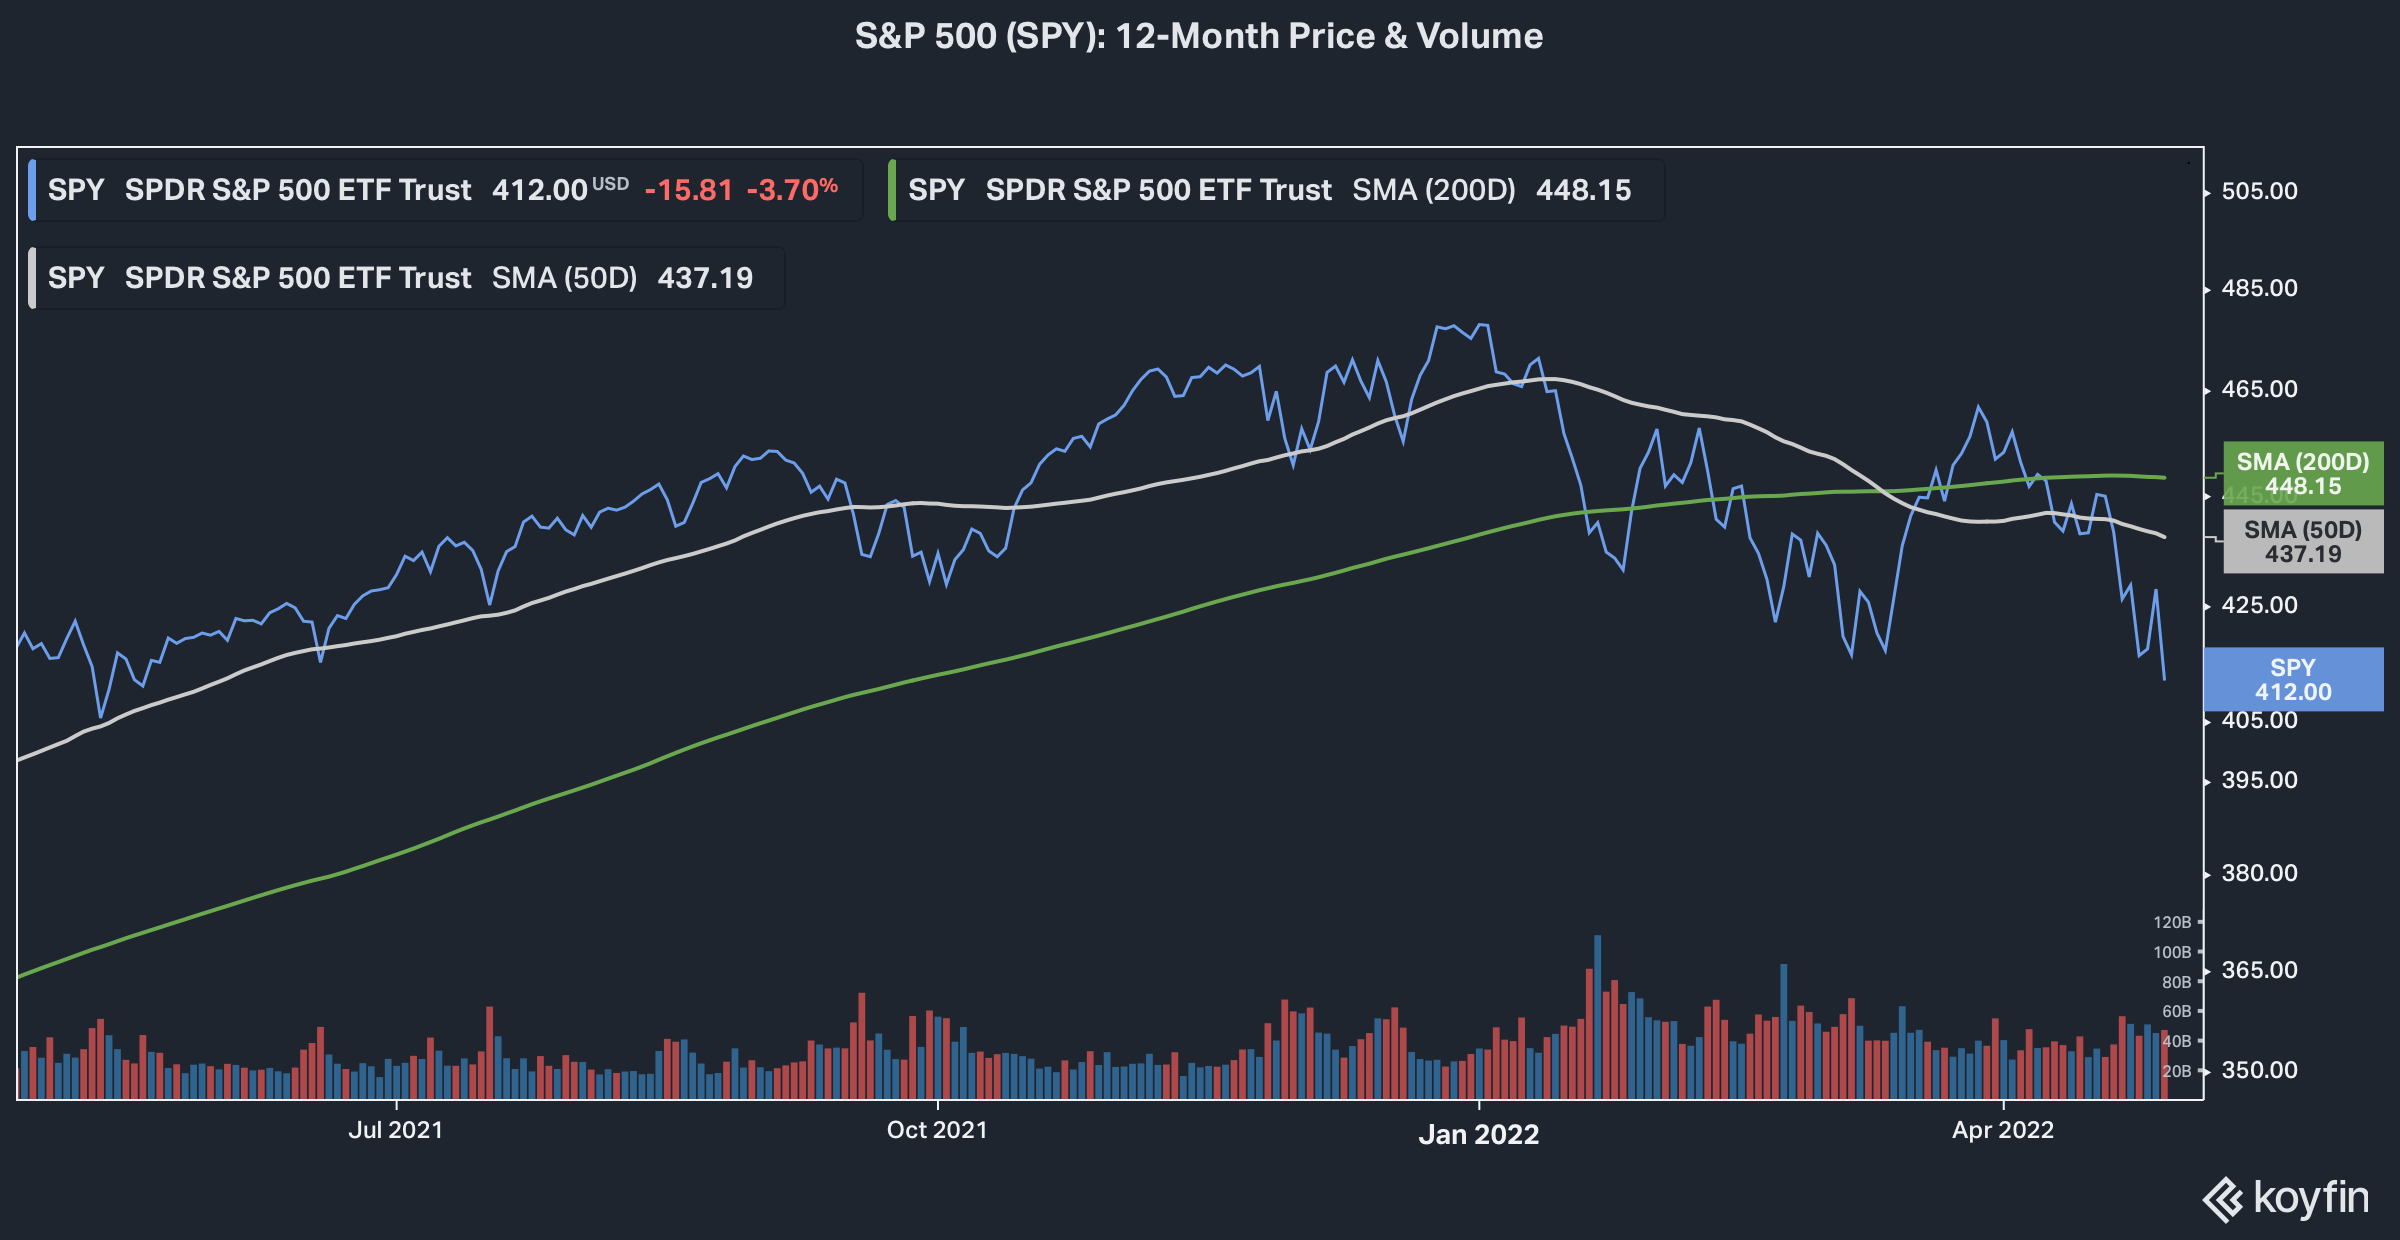
Down-Trending US Equities: SPY and QQQ are both trading below their 200-day moving averages. On that basis, both US equity indices are down-trending. Both are trading at “extreme oversold” levels — roughly two standard deviations below their respective 50-day moving averages. In general, extreme oversold conditions are not sustainable; either the SPY and QQQ will reverse and move higher or pause and move sideways to allow moving averages to catch.

Fixed Income & Credit
With interest rates trending higher, duration has been the major factor driving fixed income performance in 2022. Once again, that was the case in April.
US Aggregate Bond (AGG) — with duration of 6.8 years — declined -3.8% in April. Longer-duration high-quality bonds with greater rate sensitivity suffered larger losses in April. UST 20+ Year (TLT) — with duration of 18.9 years — dropped -9.4%. Investment-Grade Corporates (LQD) — with duration of 9.3 years — declined -6.7%.
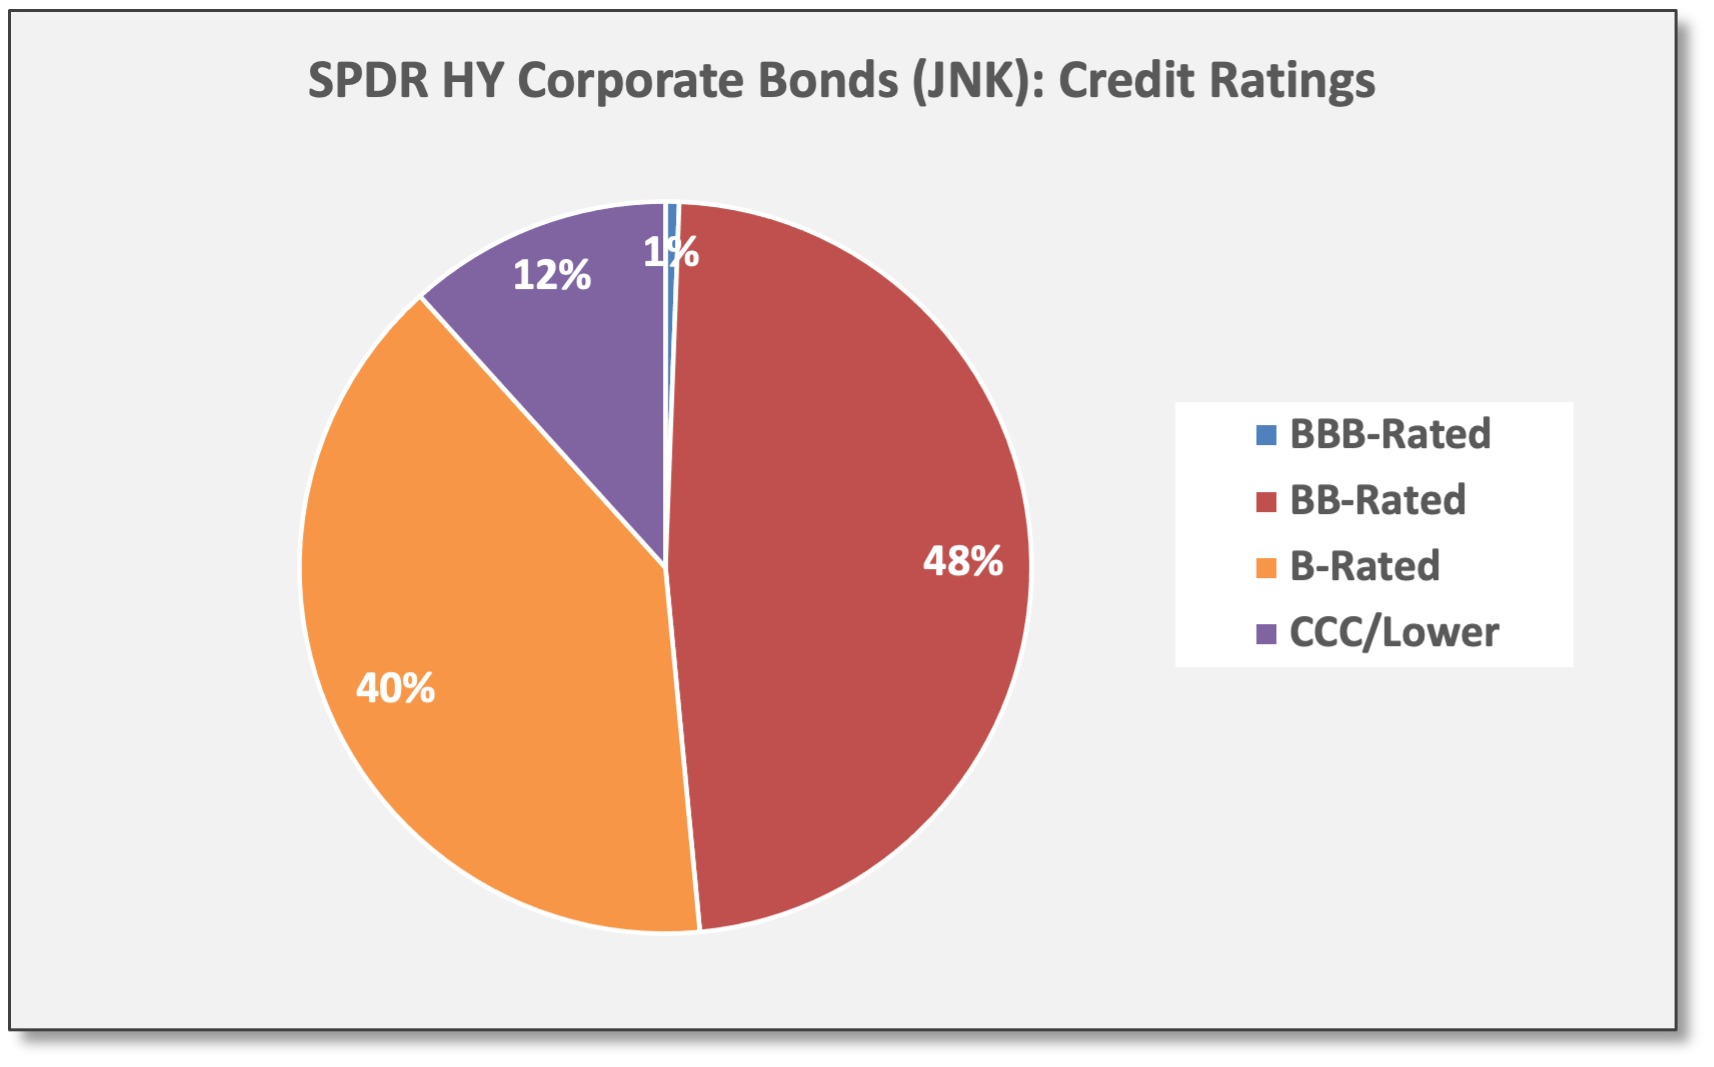
High-Yield Corporate Bonds (JNK) have less rate duration, but HY credit spreads widened by 40 basis points (bps) in April to +383 (as of 4/28). JNK —with duration under four years — declined -4.4% for the month. HY Senior Bank Loans (BKLN) — floating-rate securities with virtually zero rate duration — declined -0.7% in April.
Emerging Markets Bonds (EMB) struggled in April due to duration effects and the stronger US dollar. EMB — with duration of 8.1 years — declined -6.7%.
Meanwhile, the US dollar (USDU) rallied 4.0% against a basket of foreign currencies. We group the USD with fixed income because it has zero credit risk (like US Treasury securities) and functions somewhat like short-duration notes, influenced by Fed Policy and inflation trends — relative to foreign currencies.

Charting fixed income performance for ‘22 shows a similar picture (below). Only the magnitude of losses are larger. For the year, the AGG — broadly followed as a high-quality US fixed income benchmark — is down -9.4%.

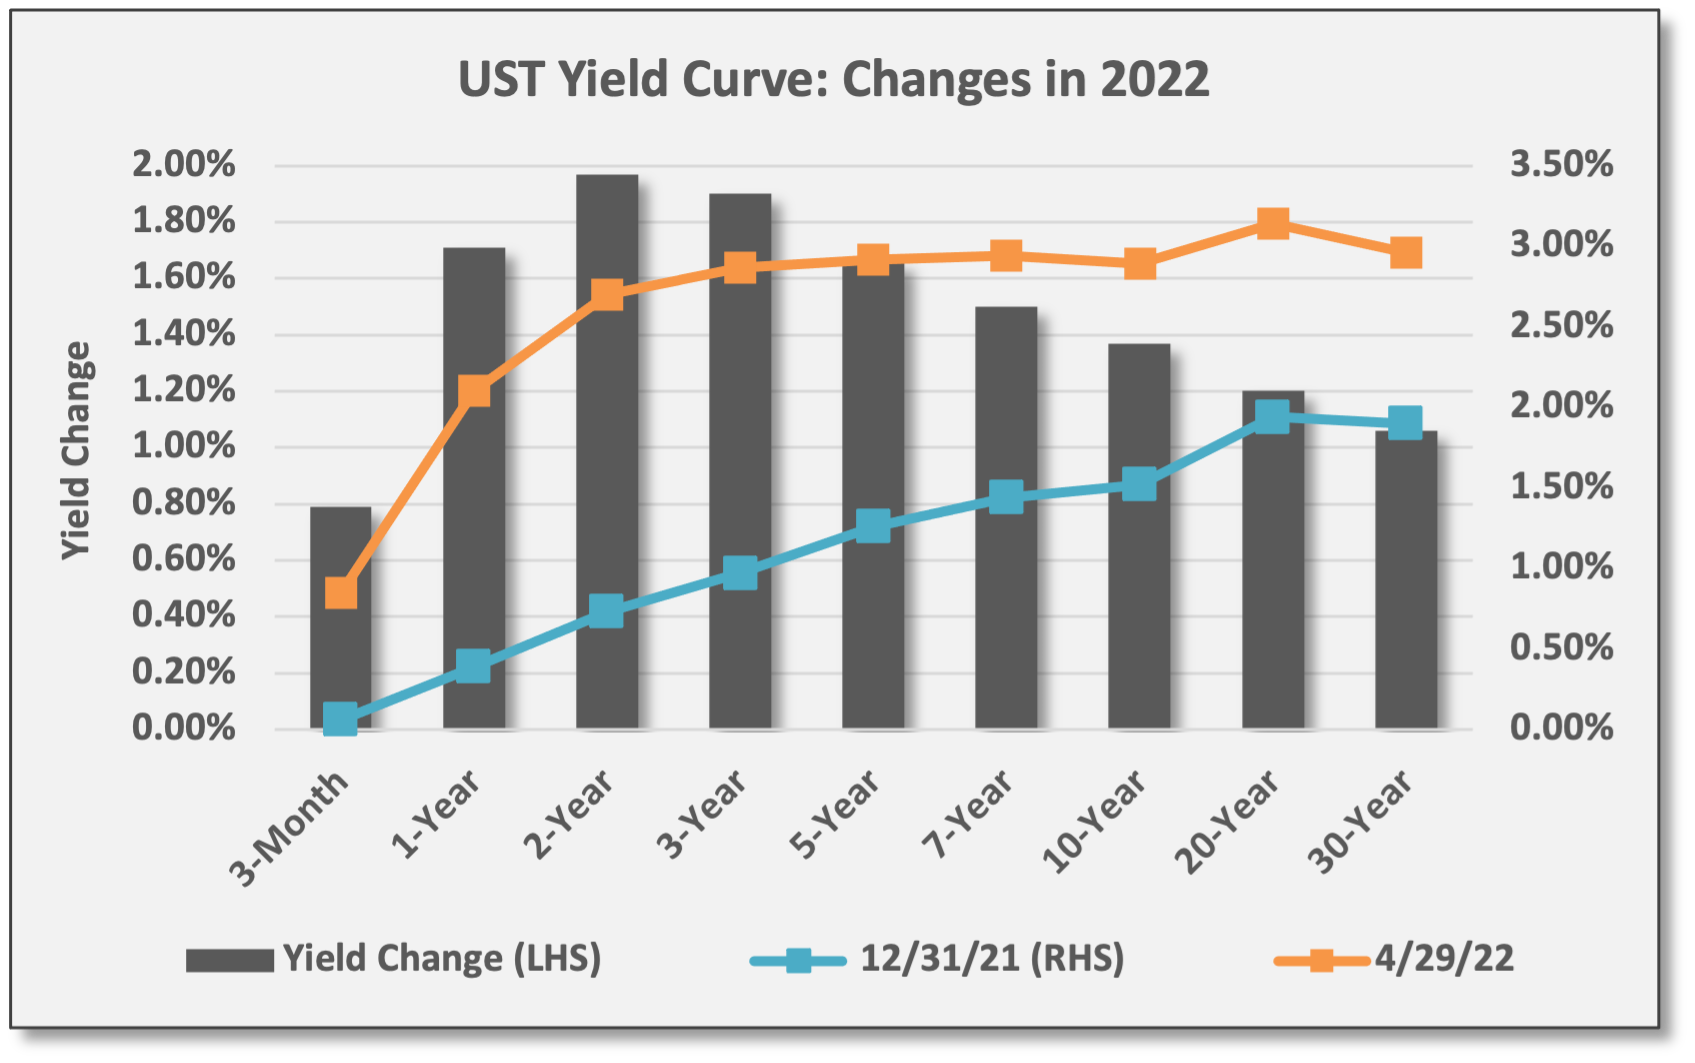
Steeper yield curve in April. For the month, the yield on the UST 2-year note jumped 42 basis points (bps) to 2.70%. After briefing inverting on the first trading session of April, the yield curve promptly steepened over the balance of the month. The yield on the UST 10-year note jumped 57 bps to 2.89%.

Flatter yield curve for 2022. Of course, the major narratives for ‘22 have been rising inflation, the Fed on a mission to aggressively hike interest rates, and bond markets responding to the policy pivot — doing the Fed’s work by lifting rates across the yield curve. That being said, short-term rates have moved more dramatically than intermediate/long-term rates — a recognition that inflation is more of a front-end loaded phenomenon due to disrupted global supply-chains and one-off federal stimulus. As a result, the UST yield curve has flattened in 2022 and even inverted for a two trading sessions — based on the UST 2-10 spread — at the start of April.
Up-Trending Rates = Down-Trending Bonds: UST 10-year rates have been up-trending all year. On the flip side, bond prices have been down-trending. AGG is well below its 200-DMA and trades in modestly oversold conditions more than one standard deviation below its 50-DMA.


Besides rising rates, corporate bonds struggled in April due to widening credit spreads. IG spreads closed April at +138 (as of 4/28), wider by 16 basis points (bps). HY spreads widened by 40 bps to +383 (as of 4/28). iShares IG Corporate Bond (LQD) is comprised of ~50% BBB-rated bonds; BBB-rated bonds trade at an average spread of +167. SPDR HY Corporate Bond (JNK) is ~48% BB-rated; BB-rated bonds trade at an average spread of +274.


Global Yields: UST rates continue to offer a yield advantage versus major sovereign bond issuers like the United Kingdom, Germany, and Japan. To a certain degree, the spread differential might cap near-term upside in rates, but at the same time, foreign rates have been moving higher in a synchronized way with the US. However, Bank of Japan is not pursuing rate hikes — a strategy to deflate the value of the yen in order to bolster price competitiveness for Japan’s export-based industries.

Commodities & Real Assets
Commodities have been virtually unstoppable this year. A week after buckling to the pressure of aggressive Fed Policy rhetoric — at least that is how we explained the drop in commodity prices for the week ending 4/22/22 — Diversified Commodities (DBC) regained their composure. DBC gained during the last week of April, making it 13 positive weekly returns out of a possible 17 so far in 2022.
Performance in April, however, varied across sectors: Besides Energy, Agriculture posted a modest gain, but Base Metals and Precious Metals suffered declines.
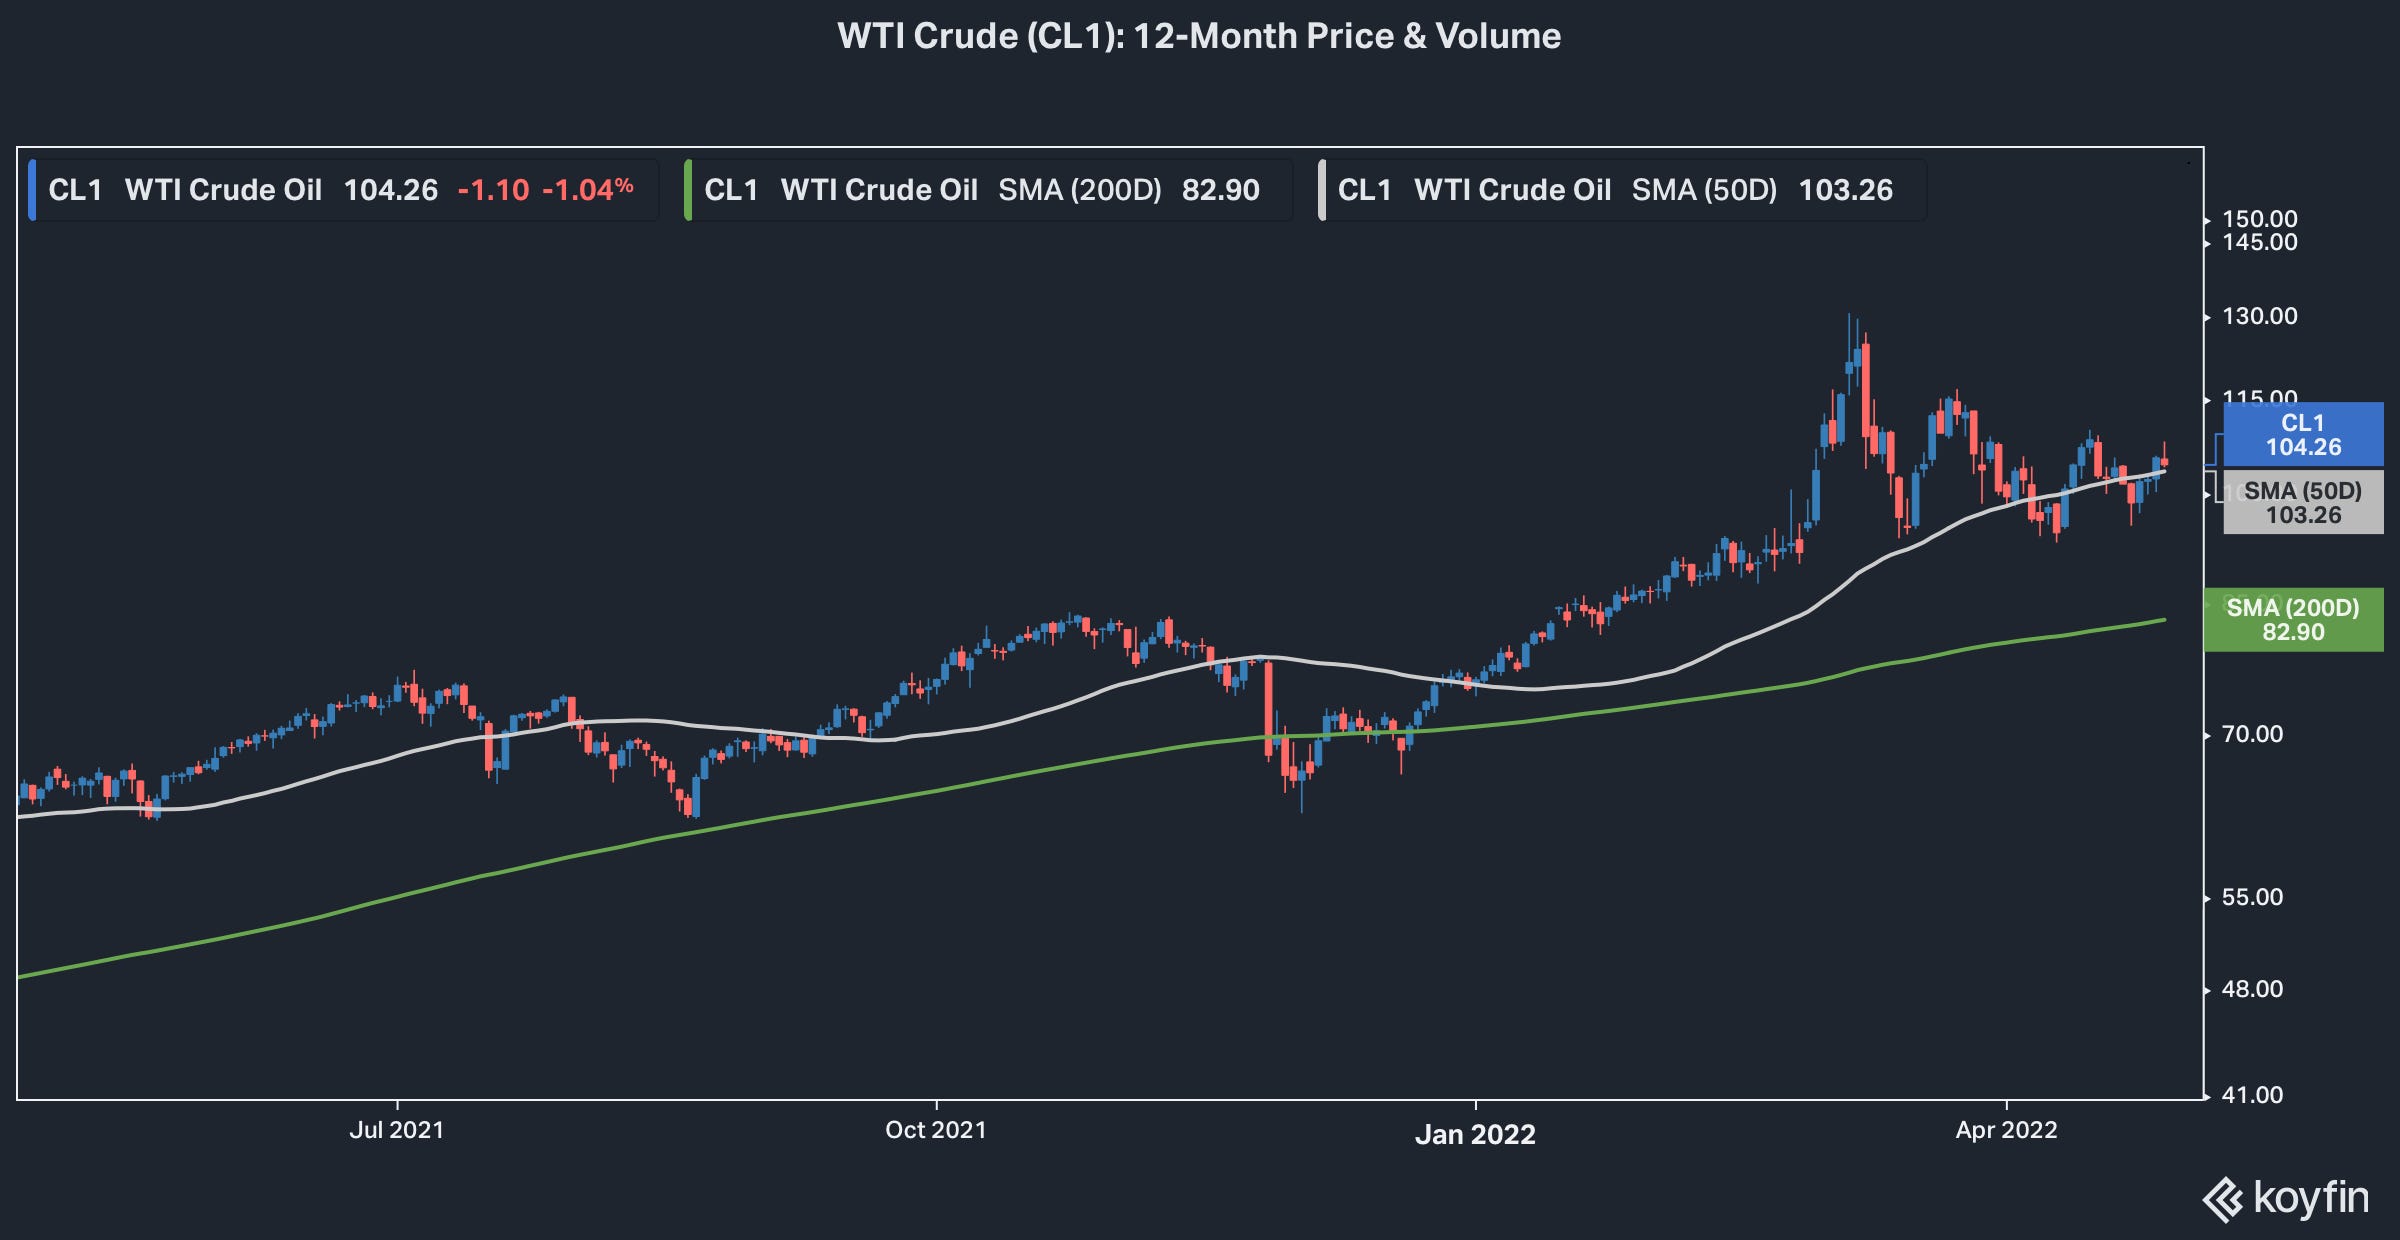
Diversified Commodities (DBC) gained 5.6%, but most of the gain came from Energy (DBE), which gained 10.0%. Natural Gas (NG1) rallied 29.0% in April. WTI Crude (CL1) gained 4.0%, closing April at 104.26 per barrel.
Base Metals (DBB) declined -8.0% in April. Aluminum (LMA) slumped -12.6% and Copper (HG1) dropped -8.0%.
Precious Metals (DBP) declined -3.6% in April. Gold (XAU) — comprising ~82% of the fund — declined -2.1%. Silver (XAG) was down -5.3%.
With Energy commodities representing over half the exposures in DBC, it's no surprise the diversified strategy delivered positive return in April, despite weakness across other sectors.


All four commodity sectors are positive for 2022. Of course, Energy (DBE) is dominating with a YTD gain of 32.5%. Precious Metals have lagged with a gain of 1.9%; Gold has failed to deliver inflation-protection. Across Agriculture, Corn and Wheat have been big performers with the latter rallying on the Russia-Ukraine War as the two countries are large producers/exporters.


Energy Commodities Dominate: Energy commodities have dominated performance in 2022 — after a strong showing in 2021. Energy comprises ~54% of the Invesco Multi-Sector Commodity Trust (DBC). We commonly refer to DBC as “Diversified Commodities.”

Up-Trending Commodities: Diversified Commodities (DBC) remain up-trending, trading well above their 200-day moving average. Again, DBC is mostly weighted to energy commodities. DBC trades above its 50-day moving average, but modestly so, and does not appear overbought (i.e., it trades less than one standard deviation above its 50-DMA). WTI Crude (CL1) also is up-trending.

This material is for informational and educational purposes only. All data has been compiled from sources believed to be reliable, but there is no guarantee of its complete accuracy.
Readers should conduct their own research or consult with their advisory team before making investment decisions.
AAII Bullish Sentiment was 16.4 on 4/27/22, well below the long-term average of 38.0. The measure dropped to 15.8 on 4/13/22, the lowest reading since September 1992. The AAII Investor Sentiment Survey was launched in 1987.