


Weekly Briefing: 4/17/22
Like a broken record...


Performance & Other Observations
Remember playing vinyl records? Like the song Analog Man by Joe Walsh, we grew up with analog LPs and 45s. Remember that sinking feeling when a favorite song got a scratch? Approaching that sad defect, the song would skip — either jumping ahead to the next section of the song or falling back to replay the same section over and over again. Scratches could be so disheartening, especially when they ambushed a new Top 40 favorite. Eventually, however, we would get accustomed to the scratch. Later, when that tune popped up on the radio in the car while cruising with the windows down, we would anticipate the skip — almost as if it was part of the original hook… Of course, classic vintage vinyl is now a thing. Scratches add texture. Producers even add scratchiness to digital recordings to create an old-school vibe…
The global capital markets are getting to be like a broken record. Stuck on the same scratch and playing the same chorus over and over again…
Analog Man is included in our current Spotify playlist: Access the Coffee & Capital Markets playlist here.
Across broad asset classes, familiar macro factors and performance trends replayed during the holiday-shortened week. Equities and bonds declined with interest rates moving higher, but commodities delivered gains. High-beta growth equities dramatically underperformed defensive/value shares. High-quality long-duration rate-sensitive bonds underperformed more credit-sensitive debt.
Note: In this week’s briefing, references to weekly performance refer to the last five trading sessions.
Over the last week and month-to-date, the S&P 500 (SPY) has declined -2.5% and -3.1%, respectively. SPY is down -7.5% for 2022; SPY trades ~9% below its ‘22 high from 1/3 and ~7% above its ‘22 low from 2/24 (based on intraday high/low prices).
US Aggregate Bond (AGG) declined -1.2% last week as the grind lower continued. The UST yield curve bear-steepened; UST 2-year yields dropped but the UST 10-year yield jumped 11 basis points to 2.83%. Since a brief inversion two weeks ago, the nominal yield curve has steepened. AGG is down -2.8% MTD and -8.5% YTD.
Diversified Commodities (DBC) added 6.5% last week. DBC is up 7.8% for April and 35.2% for ‘22. Energy commodities once again were the leaders, but all major commodities sectors delivered gains last week.
For 2022, a simple 60/40 balance strategy is down -8%. Since the start of the year and without any rebalancing moves, the 60/40 using the SPY/AGG is down -7.9%. A 60/40 using the MSCI All-Country World Index (ACWI) as a proxy for global equities is down -8.3% as both Developed Markets and Emerging Markets have underperformed the USA this year.


Relative Value Spotlight
According to Niall Ferguson, historian and geopolitical strategist at Stanford’s Hoover Institution, Elon Musk once referred to Twitter as “a clown show crashing into a gold mine.”

Last Thursday, Musk offered to purchase all of TWTR for 54.20 — a premium of ~20% over the closing price. Recently, Musk disclosed a 9% stake in the company. He later declined a board seat.

In response to Musk’s offer, Twitter’s board enacted a shareholder rights plan — a “poison pill” — to effectively dilute the position of Musk or any single entity accumulating 15% of the shares without the approval of the board. In that event, the rights plan would allow other existing shareholders to purchase additional shares at a discount.
Musk suggested he has a “plan B” — perhaps joining with other groups to acquire a controlling stake in the company.
During the 8.4 years since Twitter became publicly traded, the common shares have lagged the S&P 500 Index. Essentially, TWTR is flat over that period with a positive annualized return of 0.1%. During the same period, the S&P 500 (SPY) has gained 193% — an annualized return of 13.6%.
Your support and partnership as a paid subscriber is appreciated.
We aim to deliver timely and relevant data/insights to help others leverage their time, make better decisions, and improve their client communications.
We are looking to add subscribers to our community, so please consider referring Coffee & Capital Markets to select colleagues, clients, and friends.
Economic Data & Trends
Inflation Remains at 40-Year Highs: CPI for March increased 1.2% — the largest month-over-month jump in 15 years and matching expectations. CPI was up 8.5% over the last 12 months, the highest level since January 1982.
Energy prices soared 11% in March, adding 0.8% to CPI. Energy prices have a 7.5% weighting in CPI. Over the last 12 months, Energy prices are up 32%, contributing ~230 basis points to annual CPI. Energy prices were trending up long before the Russia/Ukraine War commenced.
Prices for used cars/trucks dropped -3.8% in March. Over the last year, prices for used vehicles soared 35%, adding ~140 bps to CPI, but prices are expected to trend lower over the balance of the year, helping to reduce headline inflation.
Shelter prices gained 0.5% in March and continue to grind higher. Trends for housing-related prices are viewed as “sticky” and less volatile, although rising mortgage rates could lead to moderating prices going forward — and tempering home-price appreciation (HPA) seems to be a direct emphasis of current Fed Policy. Shelter prices are a 33% weighting in CPI (and 41% of Core CPI). Shelter prices increased 5.0% over the last year, adding ~160 bps to CPI.
Core CPI increased 0.3% — lower than expectations — showing deceleration for the second consecutive month. Nonetheless, Core CPI was up 6.5% over the last 12 months. For the Core CPI, the 12-month increase was also the largest in 40 years.


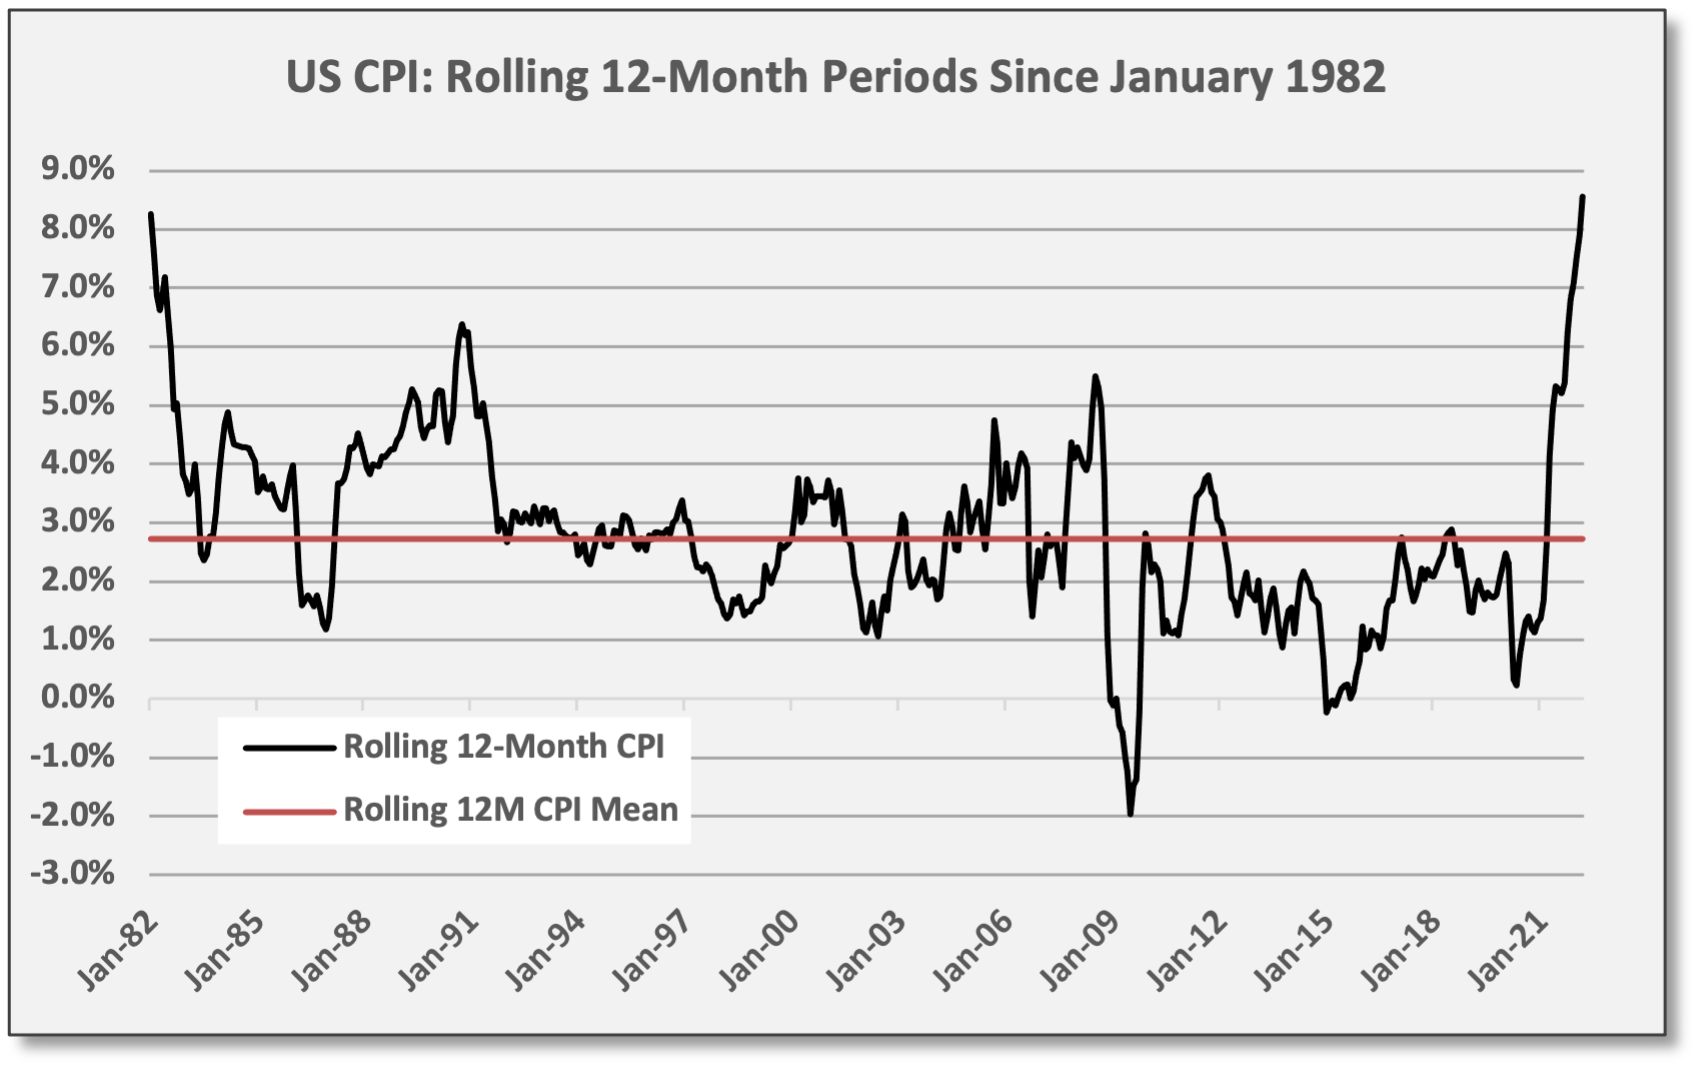

Since 1982, rolling 12-month CPI has averaged 2.7%. We reference 1982 because that is the last time rolling 12-month CPI was at current levels. Meanwhile, Core CPI has averaged 2.2% on a rolling 12-month basis since 2012.
Markets are waiting for inflation trends to peak and begin moving lower, but so far the peak has remained elusive. However, early CPI indicators such as used vehicle prices and freight shipping rates are turning lower. Even at still-elevated levels, we expect equity/bond markets to be more constructive once the “second derivative” begins trending lower.
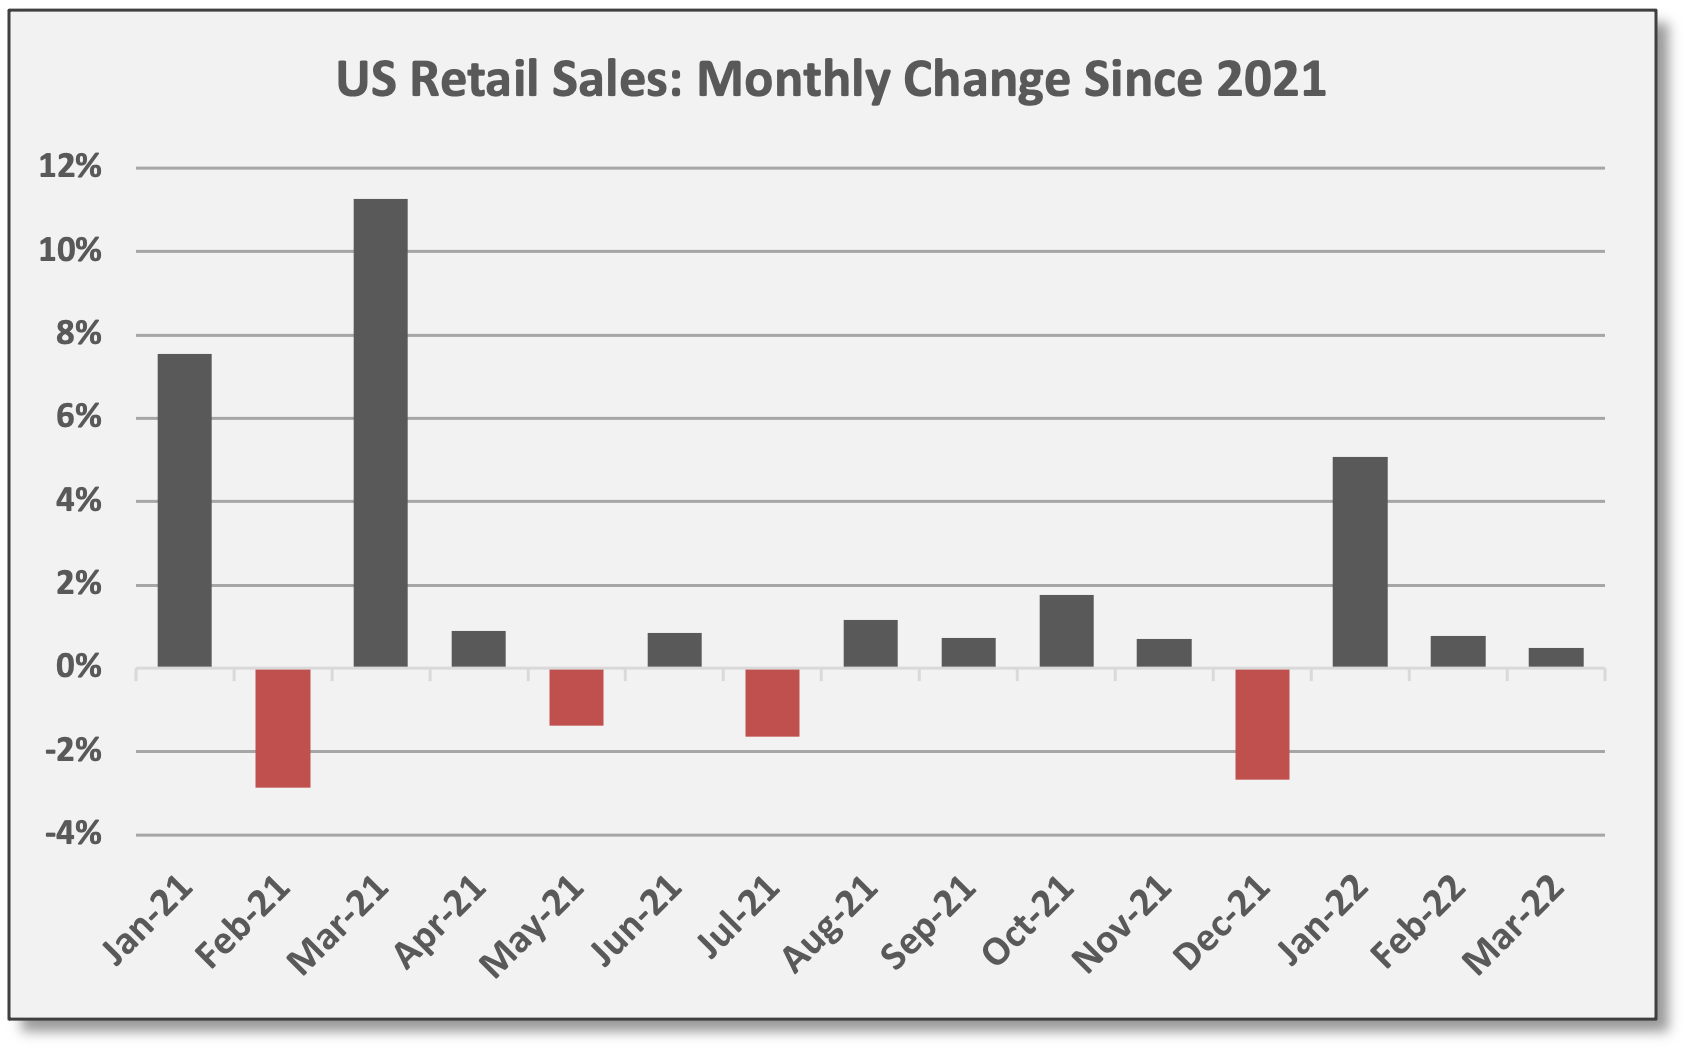
Retail Sales Revised Higher for Q1: US retail sales for March increased 0.5%, missing expectations at 0.6%, but positive revisions for Jan/Feb boosted sales by an additional 1.2%. The report lifted the Atlanta Fed GDPNow forecast for Q1 real GDP to 1.1% (inflation-adjusted). The advance estimate for Q1 will be released by the BEA on 4/28.
Retail sales increased 6.4% in Q1. Over the trailing 12 months, retail sales increased 6.8% supported by the lingering effects of federal stimulus and CPI.
After plunging 22% during the COVID shutdown, retail sales have fully recovered. Now 23 months removed from the COVID recession lows, retail sales are 26% above pre-COVID levels.
On a calendar year basis, retail sales have averaged 5.0% growth per year since the Global Financial Crisis (GFC) with a median growth rate of 4.2%.
By year-end 2022 and barring a severe slowdown, retail sales should normalize in a 4-6% (annualized) range. Above-trend inflation, however, would keep nominal retail sales above trend.
“Rising wages, jobs, and inflation will all be tailwinds for retail sales, while the waning of the temporary and artificial boost from ‘stimulus’ checks and other government benefits will be headwinds.” First Trust, 4/14/22
First Trust: “In the months ahead, the path of retail sales will be a battle between a number of opposing factors. Rising wages, jobs, and inflation will all be tailwinds for retail sales, while the waning of the temporary and artificial boost from ‘stimulus’ checks and other government benefits will be headwinds. But real (inflation-adjusted) retail sales will struggle while the service sector picks up the slack due to continued re-opening.”

Monetary/Fiscal Policy
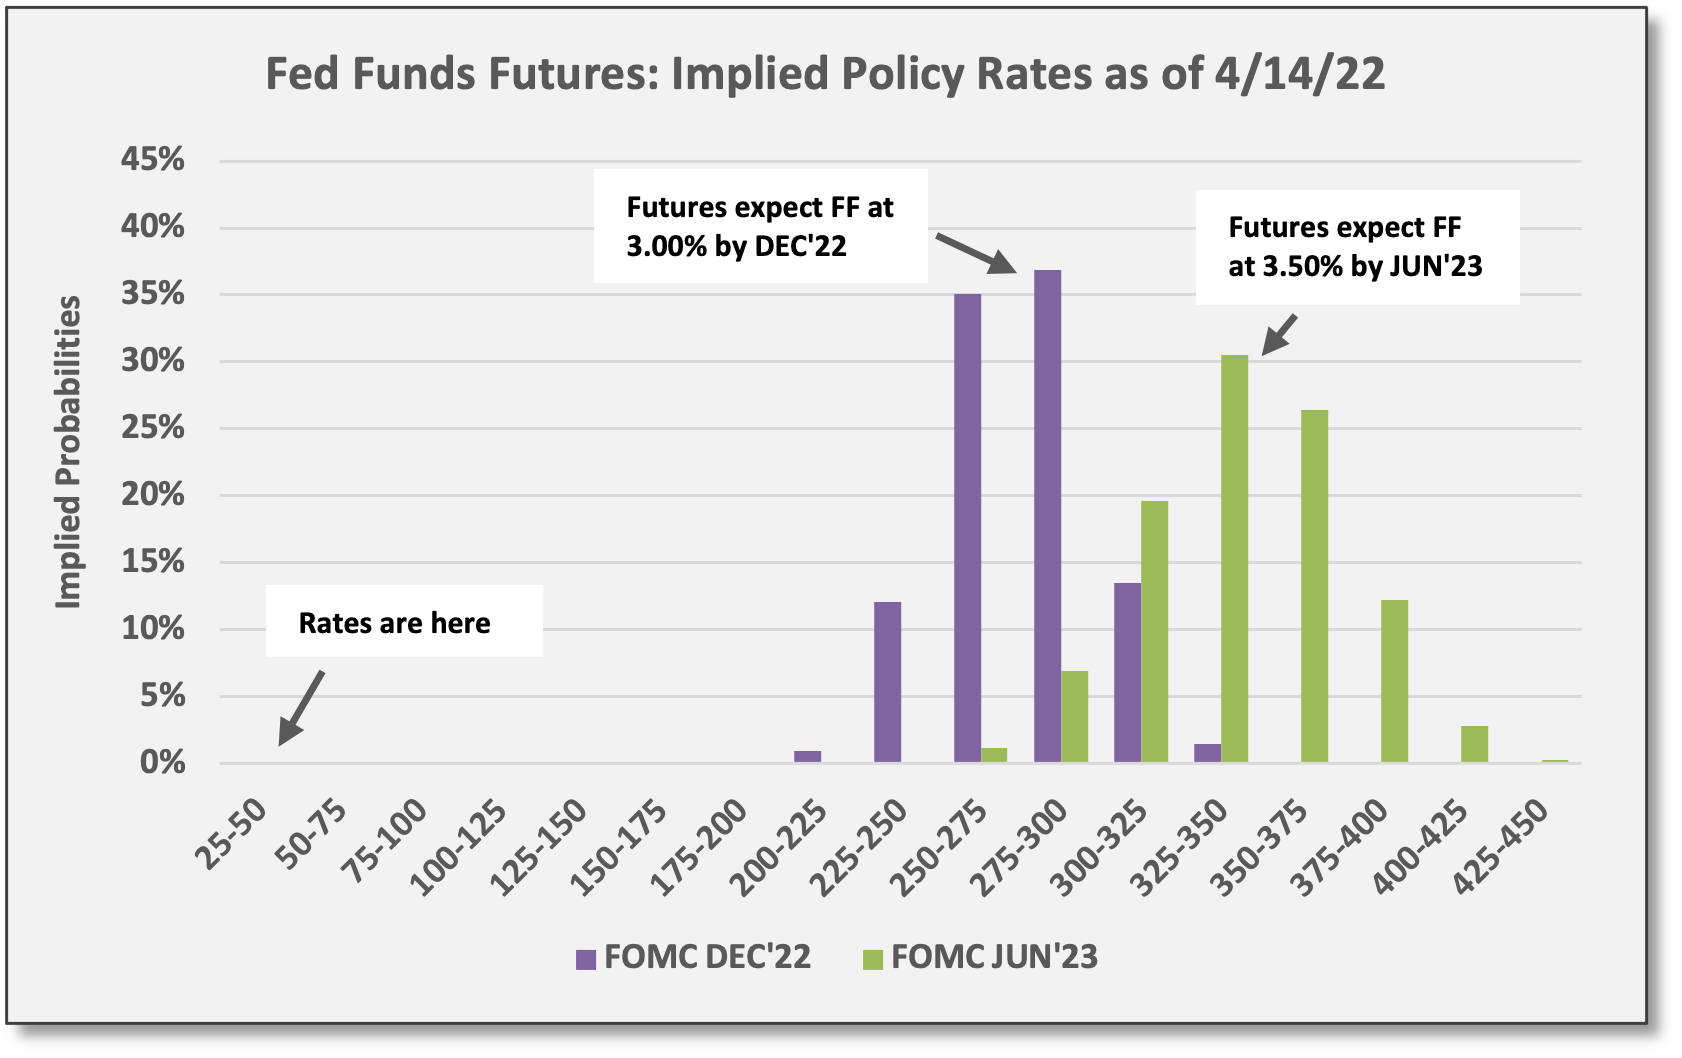
Rates Move Higher: Part I. As it relates to short-term policy rates, Fed Funds futures added incremental rate hikes to the outlook. Currently, the FF target rate is 0.50%. For the upcoming FOMC meetings, market-based pricing reflects the following:
91% probability of a 50 basis point hike on 5/4, lifting policy rates to 1.00%
69% probability of a 50 basis point hike on 6/15, lifting policy rates to 1.50%. There is a 93% probability of two or more hikes with markets assuming the Fed might hike rates to 1.75%.
After the June meeting, the FOMC will gather an additional four times before year-end. Looking ahead, futures markets expect policy rates to reach 3.00% by December ‘22 and 3.50% by June ‘23. In both cases, futures markets added 25 basis points to the implied forecast last week.
Negative Real Rates: Inflation-adjusted “real” rates are set to remain negative for the foreseeable future. Even if inflation peaked in March and begins trending lower. During the first three months of this year, CPI has increased 2.7%. For emphasis, consumer prices have increased by 2.7% in absolute terms (not annualized). If monthly CPI prints dropped immediately to 0.2% — an annualized pace of 2.4% — and maintained that level over the last nine months of 2022, CPI would still finish the year with an increase of 4.6%. Thus, policy rates at 3.00% would still be negative on an inflation-adjusted basis. Assuming CPI averages 0.2% per month over the balance of the year seems ridiculously implausible. If CPI averages 0.4% per month — an annualized rate of 4.8% — CPI would finish ‘22 with an increase of 6.5%.

This thought exercise illustrates the effects of high inflation will linger for an extended period, even after CPI peaks and begins trending lower.
The effects of high inflation will linger for an extended period, even after CPI peaks and begins trending lower.
That being said, we would expect equity/bond markets to behave much more constructively when inflation begins trending lower — even if trailing 12-month absolute levels remain elevated. At that juncture, it will be more about the trend and trajectory going forward.
Used Car Prices & Freight/Shipping Costs Headed Lower: Indeed, several “leading inflation indicators” are suggesting price inflation is peaking and will soon be trending lower. Last week, FSInisight referred to Mannheim Used Car Prices and the Cass Freight Index as two such indicators heading lower. Goldman Sachs: "While inflation reached its fastest yearly pace in March since the early 1980s, we believe headline and Core CPI should gradually subside throughout most of the rest of the year, and reach 5.7% and 4.5%, respectively, by YE22.”
Fixed Income, Rates & Credit
Rates Move Higher: Part II. In cash markets, the UST yield curve bear-steepened last week with intermediate/long-term rates jumping while 2-year yields moved lower. The UST 10-year yield jumped 11 basis points to 2.83%. The UST 2-year dropped six basis points to 2.47%.

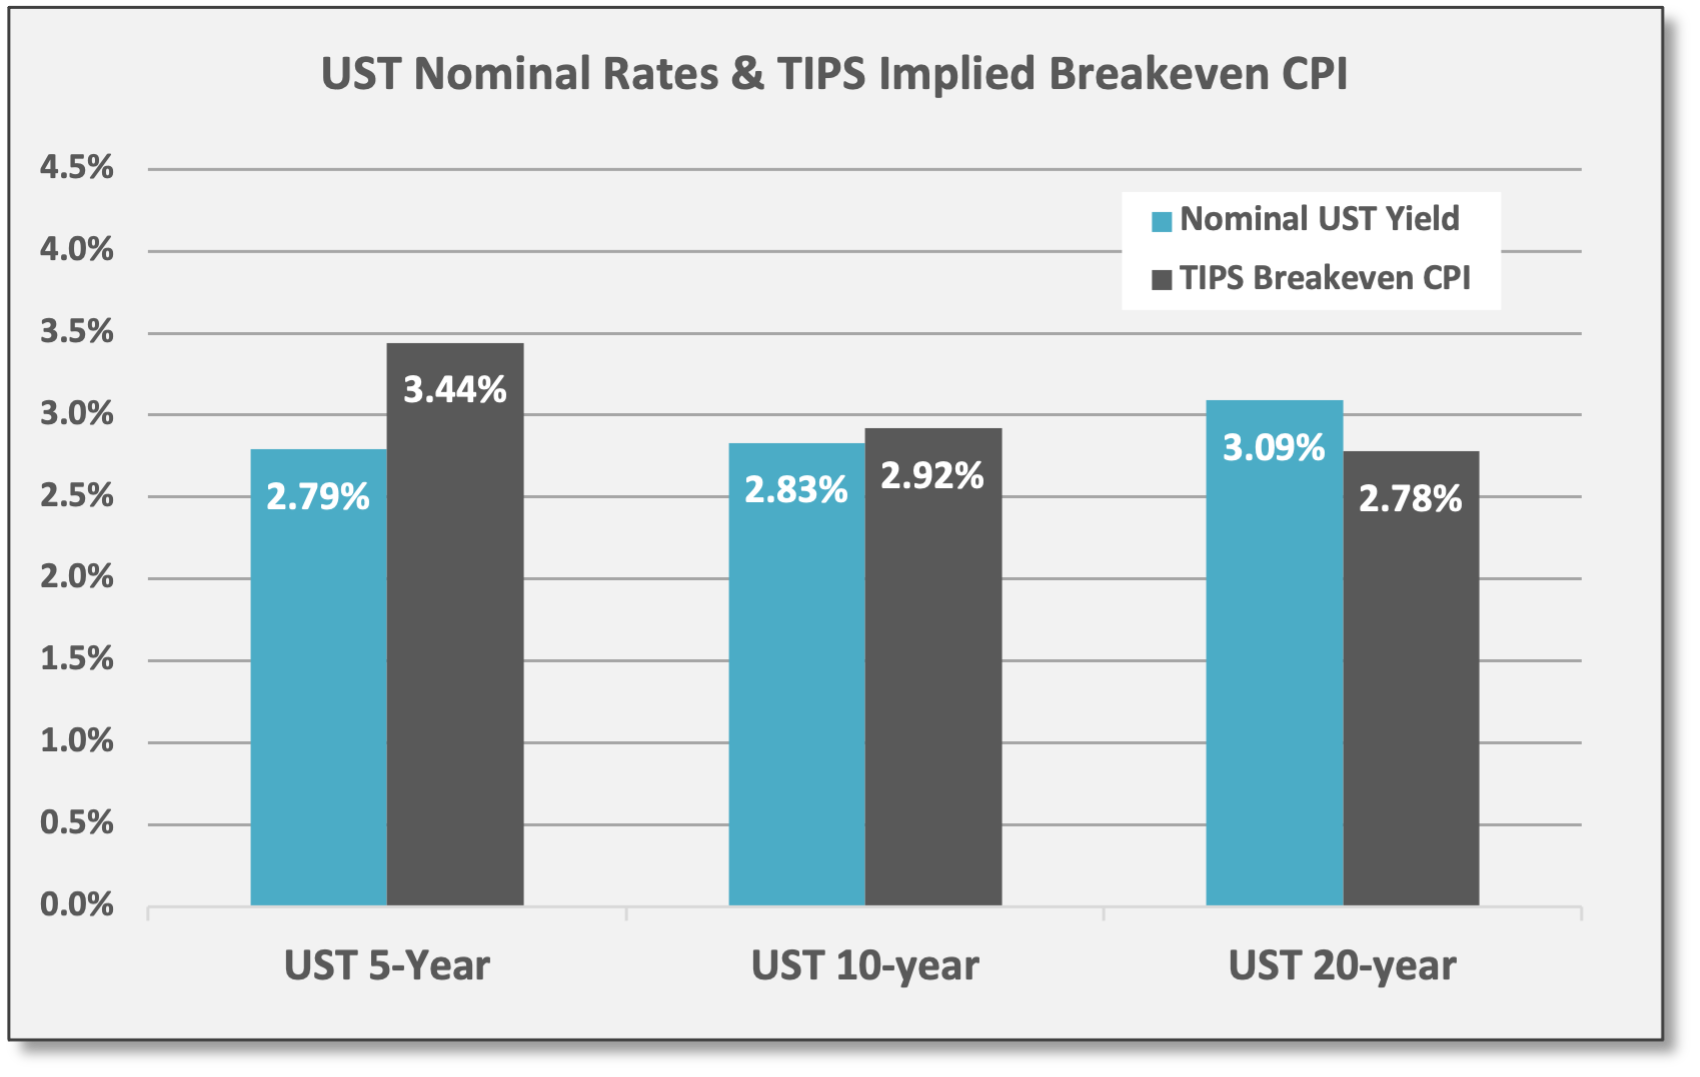
No longer inverted. The UST yield curve has bear-steepened so far in Q2. Actually, the 2-10 curve inverted on 4/1 with the 2-year and 10-year yielding 2.44% and 2.39%, respectively. Since that brief encounter, the curve has resumed its normal upward slope with the 2-10 spread wider by 41 bps to +36. As we highlighted two weeks ago, the inflation-adjusted “real” rates curve never inverted. By contrast, the short-end of the nominal UST yield curve was being distorted due to near-term inflation levels — resulting in a false recession signal according to FSInsight. As of Thursday’s close, both the nominal UST curve and the TIPS curve were upward sloping as shown below.
“Just when everybody became an ‘inversion expert’ — things decided to reverse…” The Market Ear, 4/14/22
The Market Ear: “Just when everybody became an ‘inversion expert’ — things decided to reverse. The negative trend lines remain intact, but the recent bounce has been huge and has caused massive p/l pain among the new smart ‘inversion’ pundits… Our main take stays intact, despite the recent move [higher] in yields, there is more room for yields to move lower in the short-term.”

Why are long-duration yields moving higher? Over the last two weeks, yields for the nominal UST 5-year, 10-year, and 20-year bonds have jumped 24 bps, 44 bps, and 49 bps — but corresponding inflation-breakevens have only jumped by ~10 bps. Instead of rates moving higher on rising inflation expectations — since the move in breakevens has been muted — it might be that markets are adapting to increased UST supply resulting from fewer Fed asset purchases and a smaller Fed balance sheet. The Market Ear: “The most recent episode of the rates sell-off has been almost entirely driven by the real-yield component, with breakeven inflation essentially trading flat — an unfriendly outcome for credit and more generally risk assets.”
Instead of rates moving higher on rising inflation expectations, markets might be adapting to increased UST supply resulting from fewer Fed asset purchases and a smaller Fed balance sheet.
Based on UST prices, the implied inflation forecast is for CPI to average 3.4% over the next five years and 2.9% over the next 10 year. CPI has averaged 2.7% over the last 40 years.
In terms of performance, most bond sectors declined last week as intermediate/long-duration rates moved higher. US Aggregate Bond (AGG) declined -1.2% last week as the grind lower continued. AGG is down -2.8% MTD and -8.5% YTD.
Losses were much more pronounced for long-duration bonds last week, especially US Treasury securities, but investment-grade corporate bonds and Emerging Markets sovereign debt also suffered. UST 20+ Year (TLT) dropped -4.5%; TLT is down -8.4% for April and -18.2% for ‘22. HY corporate bonds/loans showed modest losses last week as credit spreads widened, but the HY space has less interest-rate sensitivity (and HY bank loans are floating-rate securities).


US/Global Equities
Corporate earnings season is upon us. In recent weeks, global capital markets have been dominated by macro factors, but corporate earnings reports bring company-specific events and performance differentiation.
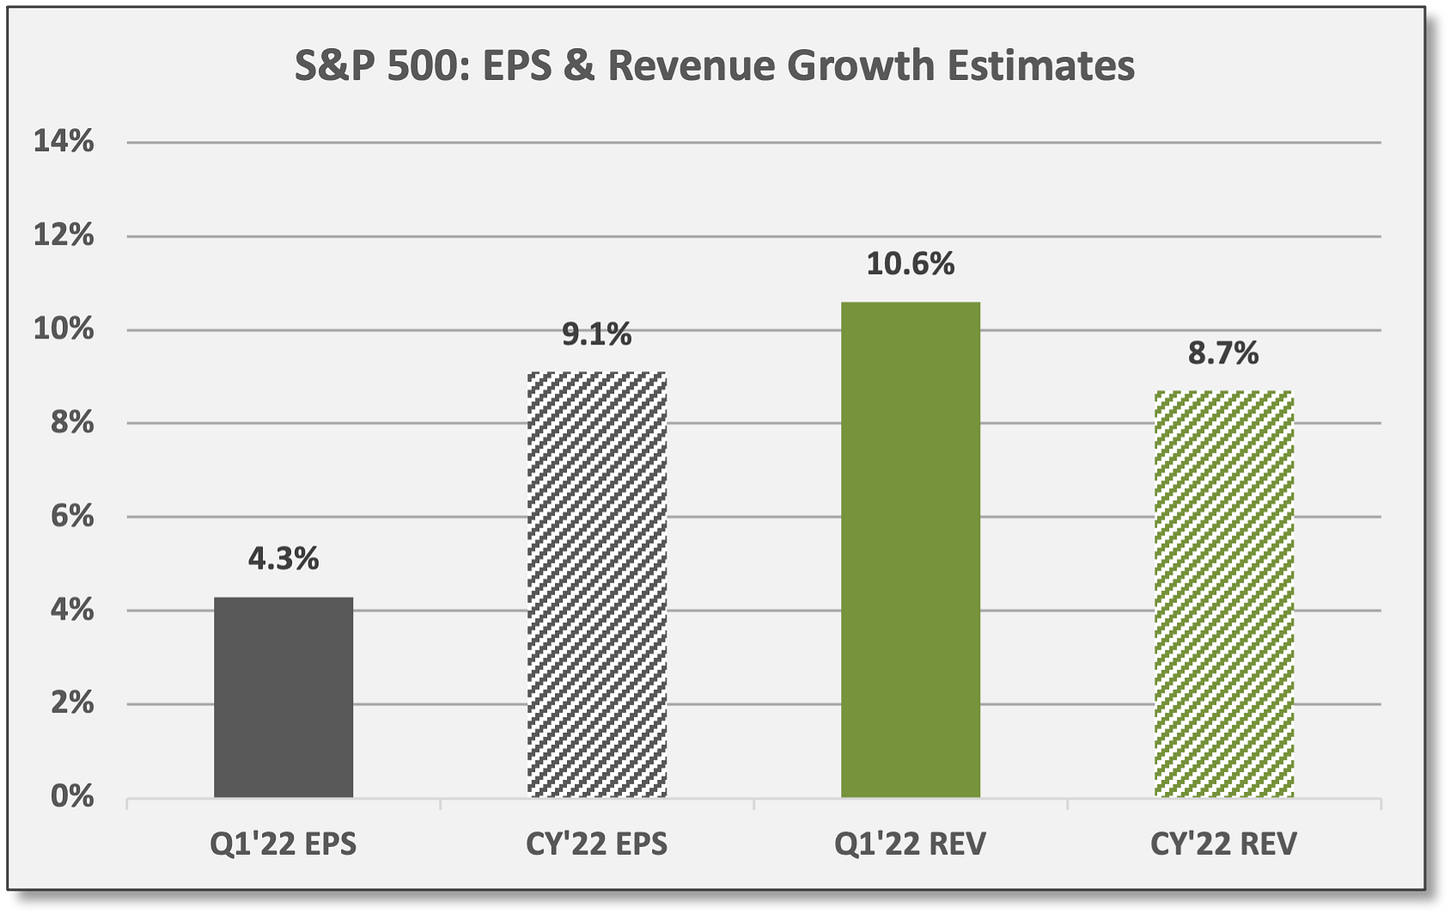
For the S&P 500, Q1 EPS are estimated to increase ~4% versus a year ago. Revenues are estimated to increase ~11%. For the full calendar year ‘22, the consensus currently estimates growth of ~9% for both EPS and revenues.
So far, 28 S&P 500 companies have reported Q1 results: 64% have beaten EPS estimates by a median of ~7%; 68% have beaten REVENUE estimates by a median of ~2%.
Producer Price Index (PPI) increased 1.4% for March, scoring above expectations. PPI increased 11.2% over the last year. Rising producer prices might lead to compressed margins for companies lacking pricing power.

Notable names reporting this week include: BAC, PLD, HAL, JNJ, KO, CSX, NFLX, NEE, PG, LVS, WHR, FCX, ISRG, AXP, HON, SLB, VZ. Looking ahead, the five largest holdings in the S&P 500 (SPY) — AAPL, MSFT, AMZN, TSLA, GOOG/L — report earnings the last week of April.
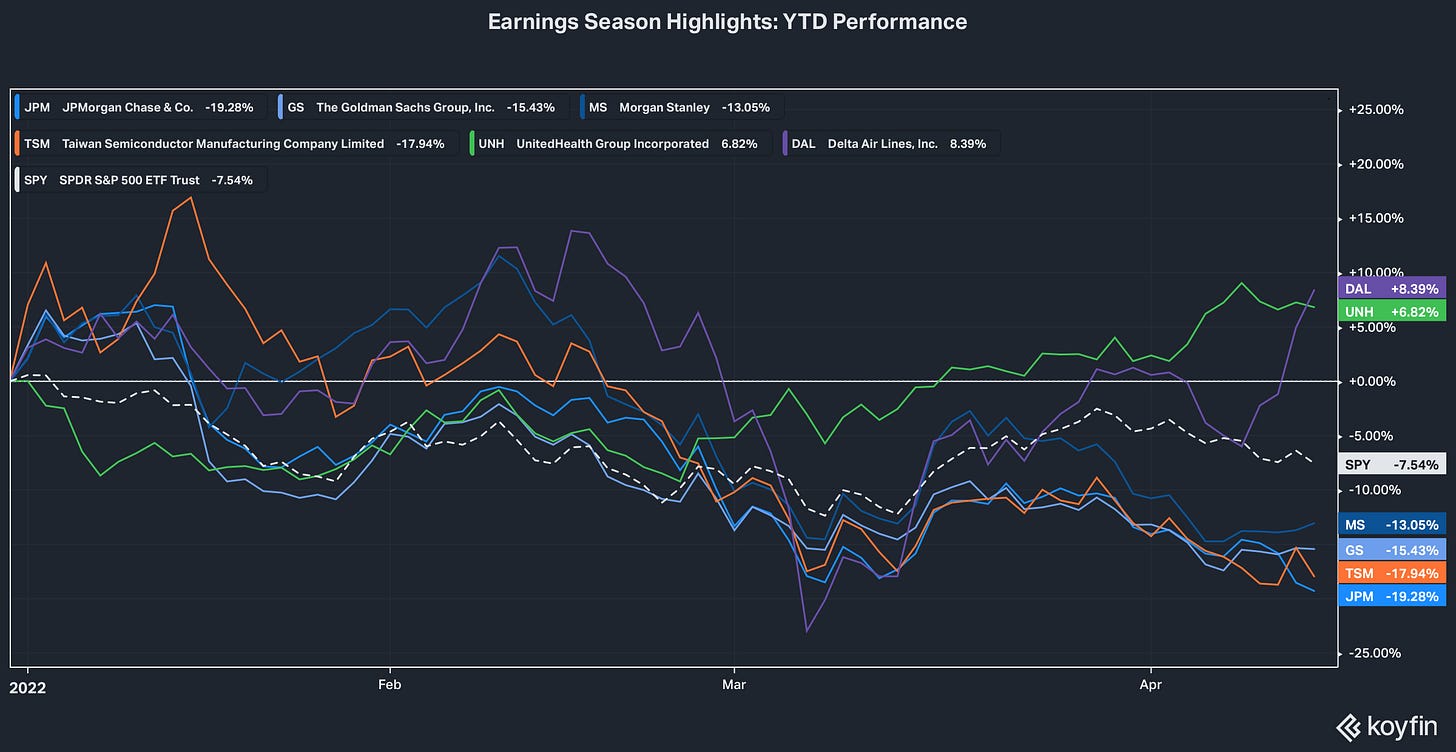
Q1 Earnings Seasons Highlights: Throughout corporate earnings season, we review single-name reports for insights into macro trends and to better understand the prevailing factors driving company-specific performance. Notably, several banks added to loan-loss reserves in Q1, reversing a positive trend since mid-2020. Credit losses were dramatically overestimated during the COVID shutdown; reclassifications have been a boost to EPS ever since, but that trend is fading.
JPMorgan (JPM): Adjusted EPS missed estimates by ~3%; profits were ~43% lower versus a year ago. Revenues beat estimates by ~1%, but declined by ~5% versus a year ago. Investment banking (M&A and IPOs) declined along with trading volumes. Home lending originations declined 37% in Q1 due to rising interest rates, indicating “a sharp cooling in housing demand” per Bespoke. In its credit book, JPM set aside provisions for loan losses, so the post-COVID earnings boost from loan-loss reclassifications could be a thing of the past. ROE declined to 13% in Q1. JPM authorized $30 billion in new share repurchases (equal to ~8% of market capitalization). Note: JPM declined -5.5% last week and is down -19.3% for ‘22.
Goldman Sachs (GS) & Morgan Stanley (MS): Both investment banks beat profit and revenue estimates, but results were lower versus a year ago. For GS, adjusted EPS beat estimates by ~20%, but profits declined ~42% compared to a year ago; revenues beat by ~10%, but were down ~27%. ROE was 15% in Q1. Revenues for asset management and investment banking were ‘significantly lower” in Q1. In credit exposures, the bank set aside loan-loss provisions. For MS, adjusted EPS beat estimates by ~20%, but profits declined ~7% compared to a year ago; revenues beat by ~8%, but were down ~6%. ROE was 15% in Q1. Provision for loan losses increased. Note: GS declined -0.1% last week and is down -15.4% for ‘22. MS gained 0.8% last week, but is down -13.1% for ‘22.
Taiwan Semiconductor (TSM): Adjusted EPS beat estimates by ~9% with profits increasing ~42% versus a year ago. Revenues beat by ~4%, increasing ~32% versus a year ago. ROE was 36% in Q1. TSM also raised guidance with operating margins expected to improve to 46%. TSM’s top three clients are Apple (AAPL), MediaTek (Taiwan-based), and Advanced Micro Devices (AMD). Bespoke: “Demand remains strong for the industry, as a strong backlog will likely prop up revenues for the foreseeable future. With high demand and relatively limited supply, TSM benefits from pricing power.” Note: TSM declined -0.9% last week and is down -17.9% for ‘22.
United Health (UNH): Adjusted EPS beat estimates by ~3% with profits increasing ~3% versus a year ago. Revenues beat by ~2%, increasing ~14% versus a year ago. ROE was 28% in Q1. Operating margins compressed to ~9% in Q1, but UNH raised full-year EPS and cash-flow guidance. Bespoke: “COVID was only mentioned twice on the earnings call, and based on the rhetoric on the call, management seems to believe that the pandemic stage of the virus is complete.” UNH returned $3.9 billion to shareholders in Q1 (dividends and share repurchases) — with an additional $12.6 billion planned over the balance of the year (equal to 2.5% of market capitalization). Note: UNH declined -2.0% last week, but is up 6.8% for ‘22.
Delta Airlines (DAL): Adjusted EPS slightly ahead of estimates, but the firm still showed an operating earnings loss of $783 million. Revenues beat estimates by ~3% and increased ~125% versus a year ago, although they remain ~11% below Q1-2019. Bespoke: “Although there has been a pickup in travel as of late, travel volume remains suppressed relative to pre-pandemic levels.” According to TSA, passenger volumes are up 77% versus a year ago, but remain 16% below 2019 levels. Historical comparisons remain challenged, but US travel is rebounding. CEO Bastian offered positive guidance: “Consumer demand accelerated through the quarter, highlighted by strong spring break performance. As Omicron faded, offices reopened and travel restrictions were lifted, resulting in an improvement in business travel demand and a stronger fare environment.” In March, Delta reported its best cash sales in history and returned to profitability. Note: DAL rallied 15.3% last week and is up 8.4% for ‘22.
Sources: CCM, Koyfin

US/global equities once again moved lower last week. In US markets, the S&P 500 (SPY) dropped -2.5% last week with large growth-oriented shares driving losses. SPY is down -3.1% for April and -7.5% for 2022.
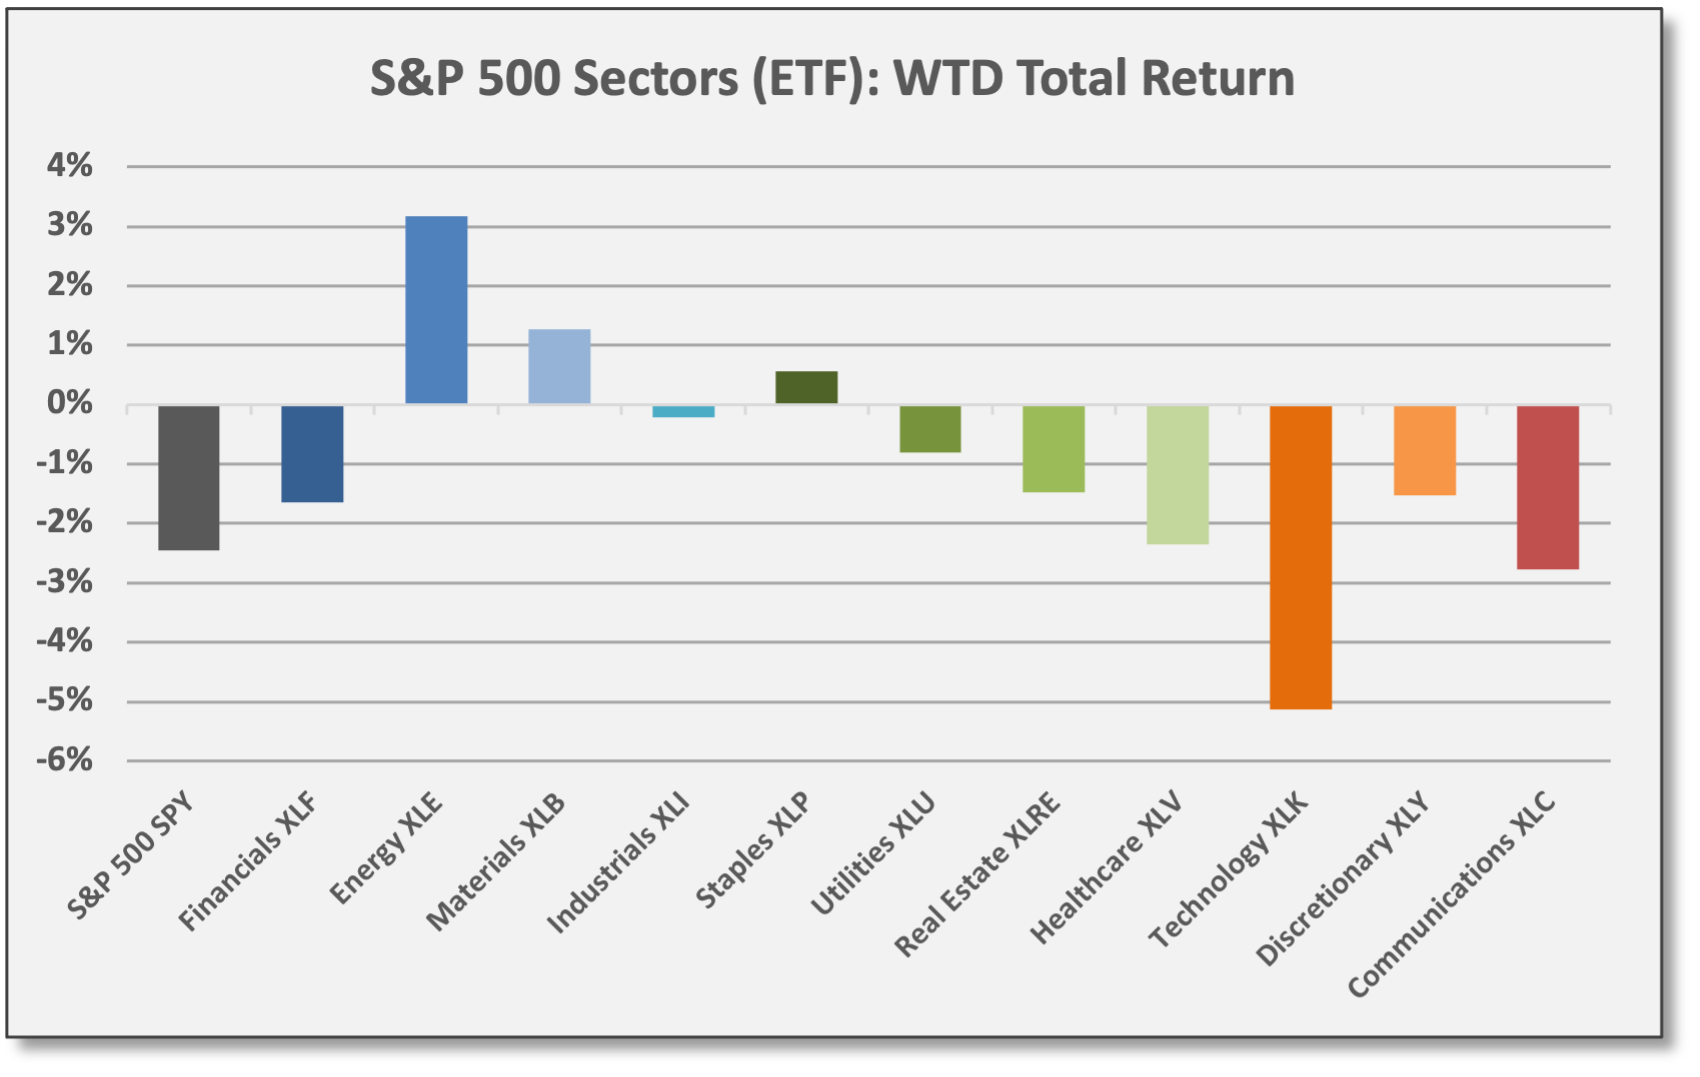
Across sectors, prevailing trends were evident last week. Technology (XLK) was the bottom performer with a loss of -5.1%. Major banks reported mixed EPS results last week with shares moving lower; Financials (XLF) declined -1.7% — an uninspiring start to the earnings season. In Healthcare, just as the sector was building positive momentum and gaining favor with investors, share prices turned lower last week, but HC and other defensive/balanced sectors — green-shaded in the charts below — have delivered positive returns for April. For the week and month-to-date, Energy (XLE) is the top performer, adding to its YTD leadership; XLE is up 45.3% for ‘22.


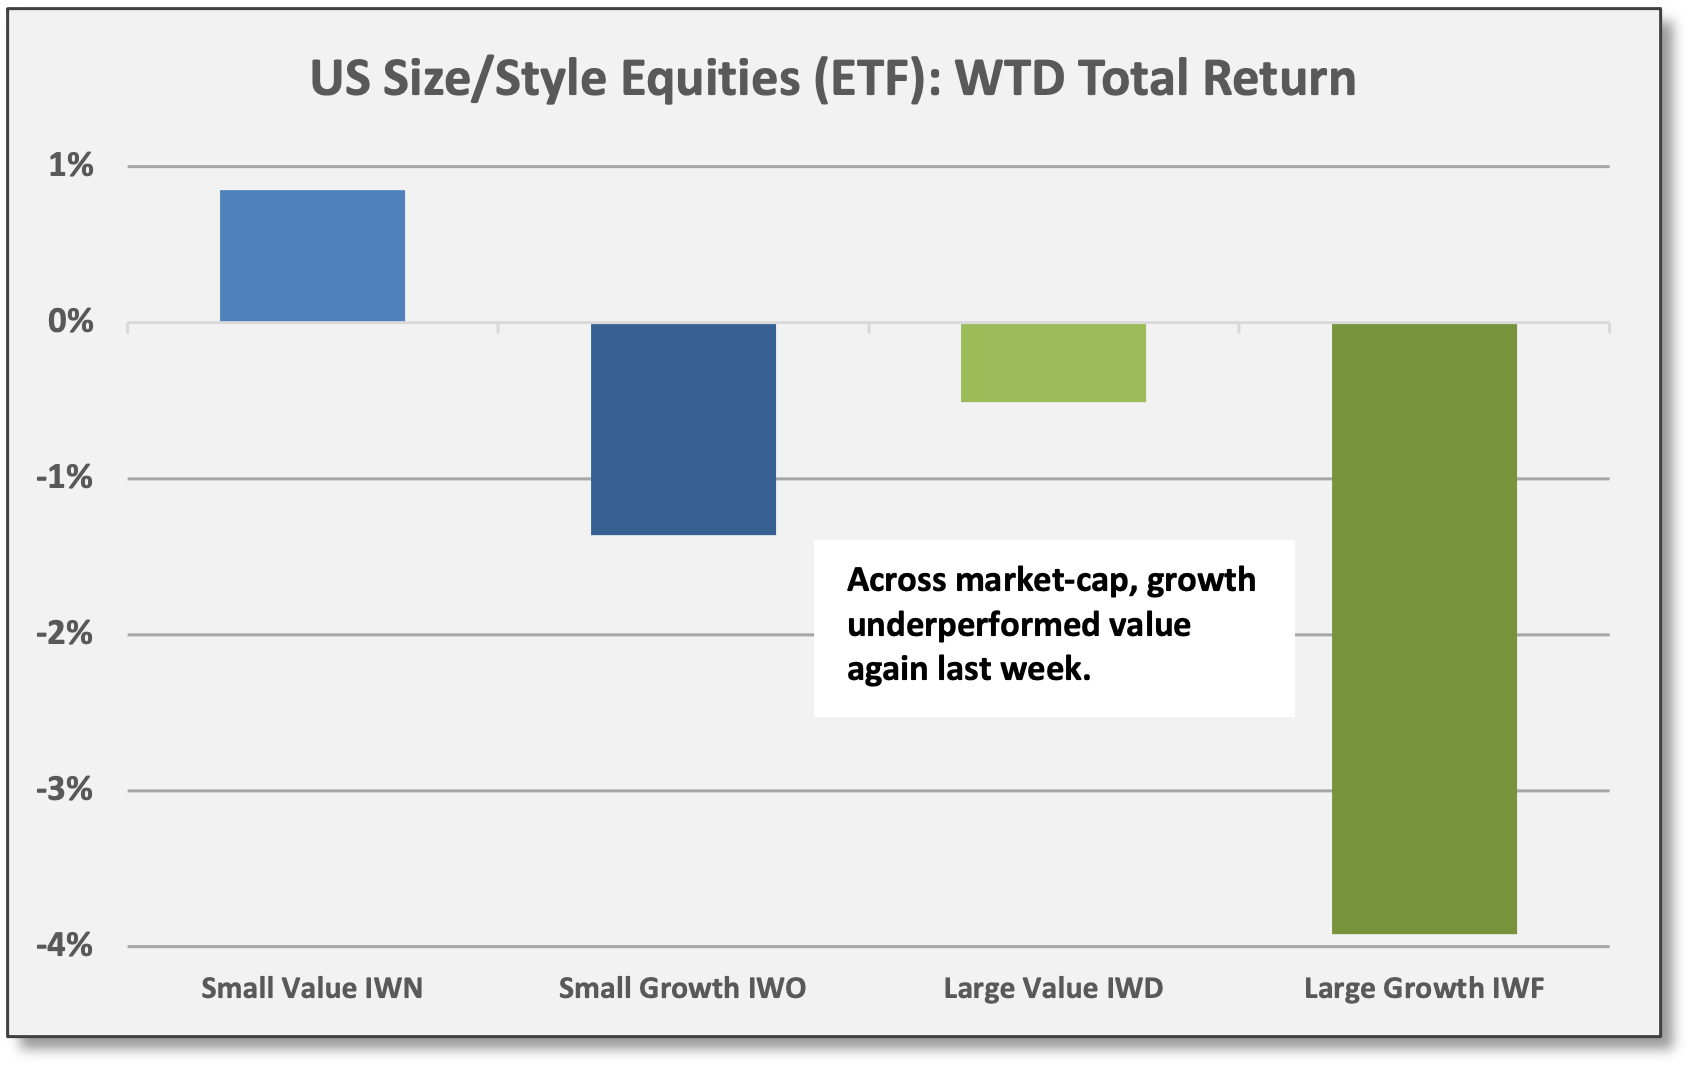
On a style basis, growth shares resumed their underperformance last week. In March, the Nasdaq 100 (QQQ) outperformed on the upside, but the quintessential proxy for large-cap growth declined -4.4% last week; QQQ is down -6.7% for April and -14.8% for ‘22. Large-Cap Growth (IWF) — substantially similar to QQQ — is down -14.2% YTD. For IWF, the largest negative attribution sources for ‘22 are MSFT, FB, and NVDA.
Of the four simple size/style proxies we follow, Large-Cap Value (IWD) is the top performer for ‘22 with a decline of just -1.2%. For IWD, the top attribution sources for ‘22 are XOM, CVX, and BRKB — all posting positive returns this year. Across the size spectrum, value is beating growth by 1200-1300 basis points so far this year.


With less severe losses, non-US markets outperformed last week. Developed Markets (EFA) and Emerging Markets (EEM) declined -1.2% and -1.5%, respectively. For April, EFA and EEM are modestly outpacing US equities, but they are lagging YTD with declines of -8.5% and -9.5%, respectively.
Most major country markets were lower last week, but Saudi Arabia (KSA) gained 2.9%. For 2022, the top performing markets are resources-oriented — Brazil, Saudi Arabia, and Australia — along with the UK (EWU). Even for EWU, top contributors YTD are Energy/Materials equities, including SHEL, RIO, AAL, GLEN, and BP. Thus, equity market leadership remains narrow on a sector/industry basis across most global markets.


Commodities & Real Assets
All four commodities sectors delivered gains last week as Energy continued to dominate. Diversified Commodities (DBC) — 55% Energy — gained 6.5% for the week. DBC is up 7.8% for April and 35.2% for 2022. Energy (DBE) gained 9.5% for the week with Natural Gas (NG1) and WTI Crude (CL1) up 15.3% and 10.6%, respectively. For ‘22, NG1 and CL1 are up 96.5% and 41.9%, respectively. WTI closed the week at 106.23 per barrel.


Volatility, Flows/Positioning & Sentiment
Bullish Sentiment Drops to 30-Year Low: AAII Bullish Sentiment dropped to an extremely low 15.8 for the week ending 4/13/22 — the lowest level since September 1992. It was the 10th lowest bullish reading in history; bullish sentiment has been below average for 21 consecutive months. Bearish Sentiment increased last week and remains well above average at 48.4. Bearish Sentiment peaked at 53.7 on 2/23/22 just as the Russian/Ukraine War commenced, which corresponds to the 2022 low for the S&P 500 (SPY) of 410.64 (intraday on 2/24/22) — roughly 7% below current levels.

AAII Investor Sentiment Survey asks investors for their six-month forward views on the US equities market. Sentiment is concurrent with a confluence of challenging factors: Weak equity performance, persistent inflation, and concerns about aggressive Fed Policy. In particular, the unsettling tone of recent Fed rhetoric has added to investor apprehension as discussed in Performance & Other Observations from our 4/10/22 briefing. The low Bullish Sentiment is a positive contrarian indicator pointing to better equity returns ahead, but in the meantime, equities remain challenged.
What Others Are Saying
CS Lewis, Mere Christianity: “To be a Christian means to forgive the inexcusable, because God has forgiven the inexcusable in you.”
Elon Musk, CEO of Tesla/SpaceX, Ted2022 Conference, 4/14/22: “I think it’s very important for there to be an inclusive arena for free speech… Twitter has become kind of the de facto town square. So it’s just really important that people have both the reality and the perception that they’re able to speak freely within the bounds of the law… It’s important to the function of democracy… My strong intuitive sense is that having a public platform that is maximally trusted and broadly inclusive is extremely important to the future of civilization. I don’t care about the economics at all.” The full Musk interview is available here.
The Market Ear, 4/14/22: “The AAII Bull-Bear sentiment spread is at multi-year lows. Let's see if [the] market will do what it tends to do when this reading is at very low levels. Is another leg higher the pain trade from here?”
First Trust, Data Watch, 4/13/22: “It simply doesn’t matter how you cut it, or which inflation gauge you prefer, they all show inflation running far above the Fed’s target. While the current war-related spike in inflation readings may moderate in the months ahead, the annual rate of inflation will not come down anywhere close to the Fed’s 2% inflation target. Fingers crossed that the Fed has the fortitude to do what is needed to battle inflation in the months ahead, and hopefully those in Washington learn the lesson that their actions have very real (and lasting) consequences.”
Aneta Markowska, Chief Economist, Jefferies, 4/14/22: “Retail sales showed little damage from higher energy prices… there was a clear rotation from online retail to brick and mortar. So, aside from weakness in online sales, there's really no sign of a consumer retrenchment… Restaurant sales posted a healthy 1% m/m increase which bodes well for several other service categories not included in retail sales. Transportation and lodging are likely to be very strong… Not bad for a quarter that started with Omicron and ended with the invasion of Ukraine and a spike in gas prices.”
The Bespoke Report, 4/14/22: “Stocks can’t seem to find any direction these days, and that’s being somewhat generous. If anything, the trend has been lower, but with the weekend approaching, let’s be generous in order to keep up the mood. The 200-day moving average is typically considered a major trend-line for the S&P 500 with breaks above considered bullish, while moves below suggest a bearish outlook. If that’s the case, what are we to make of the fact that the S&P 500 has crossed above its 200-DMA more than five times this year and crossed below it six times? As we’ve all said to our kids all too often, ‘Make up your mind already!’”
BofA Securities, The RIC Report, 4/12/22: “Investors should rotate portfolios to own Materials, Energy and other industries with real-asset exposure, and maintain cash balances ahead of buying opportunities later in 2022. If labor costs and recession risk rise, buy ‘resilience economy’ equities during corrections… The problem: Policy goals across the spectrum, from resource independence to de-carbonization all require copious quantities of raw inputs. The materials are missing [and we see] $150 billion/year in new metals CAPEX needed for green tech alone… The solution: More drilling, mining, refining, and distribution. Raw materials are abundant in North America and allies. We expect a combination of market forces, investment incentives, and policy re-branding to spur investment in coming quarters… The opportunity: Inflation, Russia/Ukraine War, US-China distancing, and public energy fears demand leadership on deregulation and creation of a ‘Strategic Resource Reserve.’ Likely winners are undervalued and will require much higher capitalization.”
JPMorgan, Global Markets Strategy, 4/13/22: “We retain a pro-risk view and continue to recommend OWs in equities and commodities and UW in bonds. Prior to the Ukraine war, growth was expected to accelerate to well above trend as we reopen from the Omicron wave and see an unleashing of pent-up consumer and corporate demand. Although growth prospects have been downgraded over the past month, much of this impulse remains and we still see supports from strong labor markets, light investor positioning, healthy consumer and corporate balance sheets, easing policy in China, and fiscal supports in several countries to offset part of the drag from high energy prices... While the US appears to be on an aggressive tightening path, China is expected to ease as soon as this month. As such, we increase our OW of EM versus DM stocks. We also maintain our large strategic OWs of Commodities and Energy stocks given structural supply/demand drivers and geopolitical risks... We think equity risk-reward is better than sentiment suggests, as geopolitical shocks do not dominate markets for long, and Fed tightening should not be problematic in the early stages. We are mindful of the yield-curve inversion signals, but in our view these are not an immediate catalyst for de-risking but rather an advance warning that the cycle is drawing to a close. Unlike earlier inversions, we are not yet at the stage where we are seeing worsening financial conditions or extremely high real rates, which would confirm the inversion’s message. We are OW Healthcare given high margins, pricing power, attractive yield, and reasonable valuation, as the sector is many turns cheaper than its defensive and growth peers...”
Share Coffee & Capital Markets by giving a gift subscription to:
Clients — to keep them alert to relevant data and trends
Colleagues and team members who need to leverage their time
Students or young up-and-comers who thrive on learning
Seasoned investors looking to keep an edge
Family members who follow the markets