Update: Mar '22 Observations
Update: Mar '22 Observations
Q1 was an eventful year...


Observations & Performance: March 2022
The new year started with a rotation from growth-oriented assets to cyclical/value.
The premise for this relative value trade made perfect sense as the consensus assumed above-trend GDP growth as the post-COVID recovery expanded.
Furthermore, the repricing for growth equities was largely rational (at first) based on inflationary trends and Fed Policy changes. Rising interest rates demand larger discounts applied to the future cash flows, resulting in lower valuations. This applies to almost all asset prices, but the math impacts “long-duration” assets with larger future cash flows the most. In short, valuations for most equities re-rated measurably lower in Q1. Note: For the S&P 500 Index, earnings per share increased ~29% on a year-over-year basis during the Q4 reporting season in Jan/Feb. With share prices moving lower and reported EPS moving higher, the valuation recalibration was unequivocally pronounced.
Early in 2022, much of the rapid growth-to-value move was explained by the portfolio repositioning of leveraged hedge fund managers. By March, equity-oriented hedge funds collectively were showing the largest exposure to cyclical/value and the lowest exposure to secular/quality growth in years.
Soon, however, US/global capital markets took on a more worrisome tone.
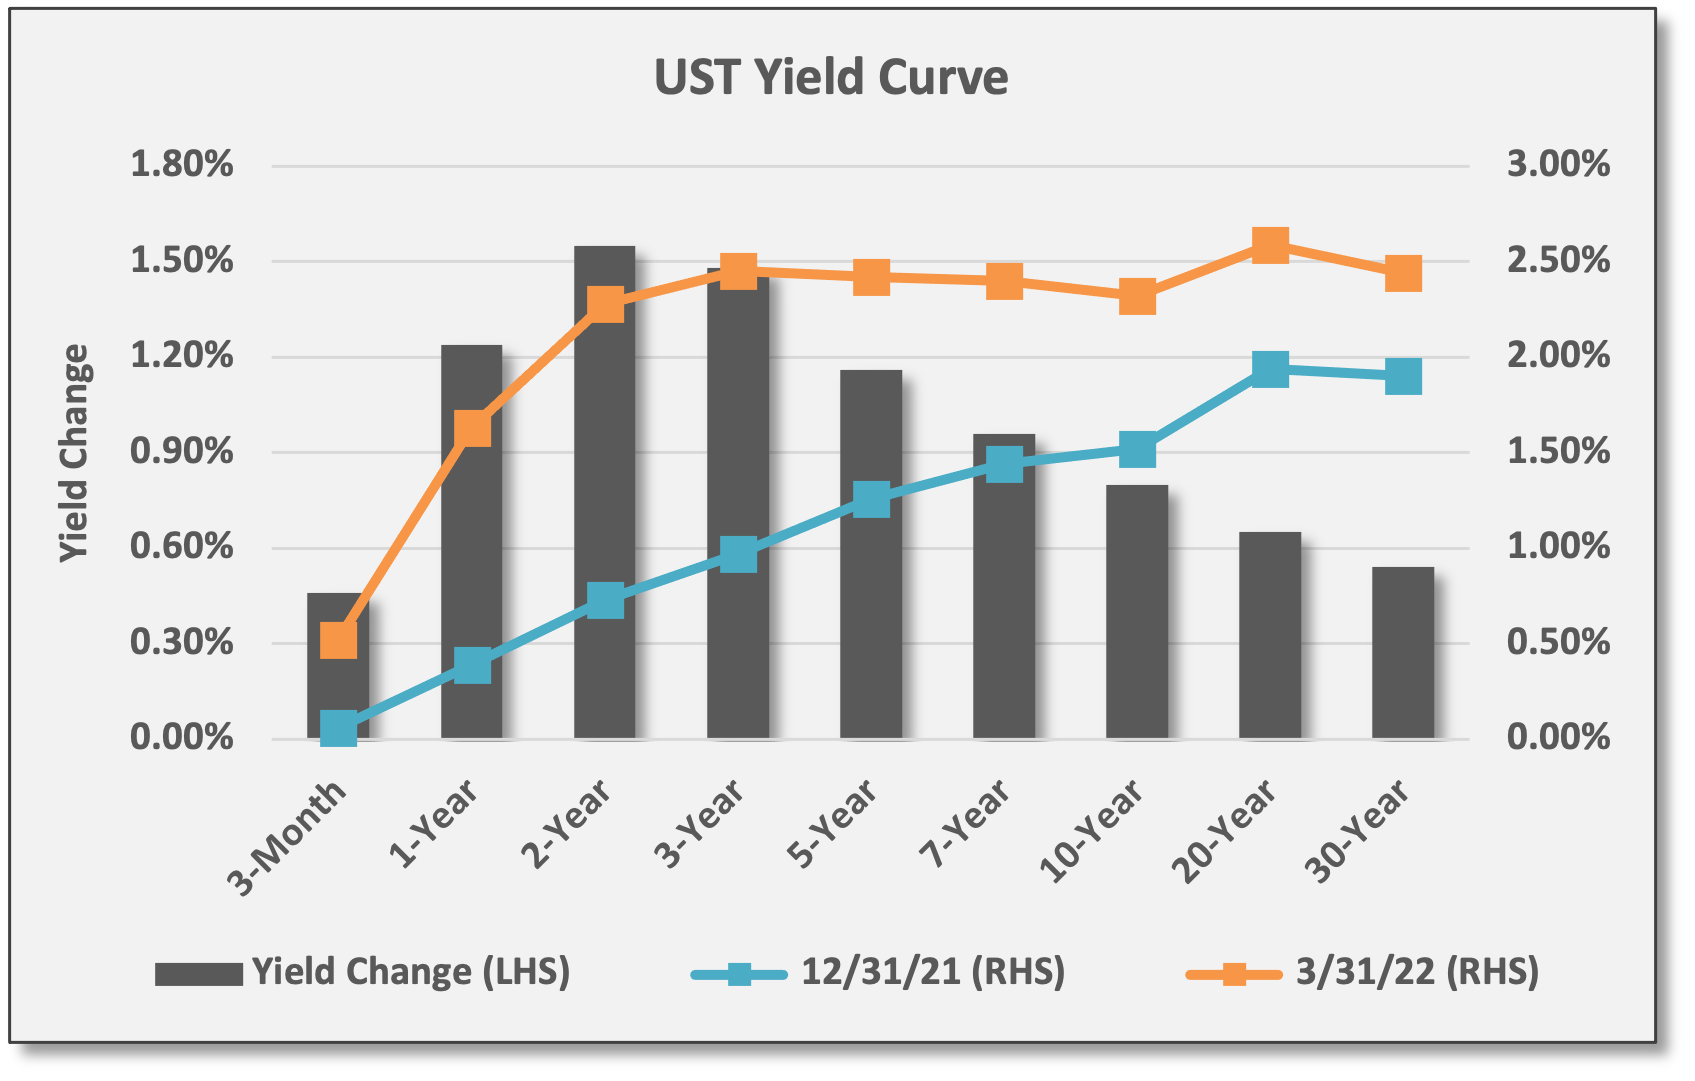
With CPI surging to the highest levels in 40 years and a Fed Policy shift looming, interest rates exploded higher in Q1. Indeed, the FOMC implemented its first rate hike for the new cycle in March — with more hikes to come — but before the deliberate and slow-moving FOMC could even take action, bond markets already lifted rates aggressively. For Q1, the yield on the UST 2-year note made an enormous jump of 155 basis points to 2.28%. Note: The 2-year traded down from its peak of 2.35% over the last two sessions of Q1 as the entire yield curve edged lower. Have rates peaked for the near-term?
As the rotational sell-off gathered momentum, equity declines spread beyond growth shares. Technical factors — including short-gamma conditions in options markets — triggered further selling pressure for equities with various market segments plunging into bear-market territory (i.e., drawdowns of 20% or more).
Thus, inflation and rate-sensitive assets assumed performance leadership, namely commodities and Energy equities. Diversified Commodities (DBC) and S&P Energy (XLE) gained 25.4% and 39.1% in Q1, respectively.
On the flip-side, growth shares were dropping and equities in general were beginning to price a policy mistake by the Fed — i.e., hiking rates into a global slowdown. Worried investors contemplated “stagflation” — or decelerating growth amid rising inflation. At the low-point in Q1 (based on closing prices), the S&P 500 (SPY) was down -12.4% YTD, but the Nasdaq 100 (QQQ) was down -20.0% — meeting the “bear market” definition.
Of course, the Russia/Ukraine War commenced on 2/24/22. Like high winds in a wildfire, the invasion made matters worse, adding more uncertainty and volatility to already stressed global markets.
Like high winds in a wildfire, the invasion made matters worse, adding more uncertainty and volatility to already stressed global markets... All the prevailing concerns were amplified by Russia/Ukraine: Rising inflation, potential demand destruction, higher interest rates and risk of a Fed Policy mistake.
Most directly, Russia/Ukraine added to commodity-related inflation pressures as well as global supply chain disruptions — especially for European-based manufacturing. In the face of all this, economists moved quickly to reduce GDP growth forecasts and downgrade corporate earnings projections. Both consumer and investor sentiment plunged:
AAII Bullish Sentiment dropped to 19.2 (2/16/22) while Bearish Sentiment reached a nine-year high at 53.7 (2/23/22).
Michigan Consumer Sentiment Index — negatively correlated to inflation —dropped to 10-year low of 59.7 in March.
In the weeks that followed the invasion, volatility proliferated. All the prevailing concerns were amplified by Russia/Ukraine: Rising inflation, potential demand destruction, higher interest rates and risk of a Fed Policy mistake. Bonds and equities continued to struggle. However, with growth expectations being reduced, recession fears rising, and so much fear being priced into assets, perhaps equity markets were already grinding through a bottoming process.
Volatility Index (VIX) surged higher, but peaked at 37.52 on 3/8/22 (intraday) before trending lower; VIX closed March at 20.80.
Rates continued to move higher and high-quality bonds struggled until the last few sessions of Q1. Perhaps rates have peaked near-term as some technical analysts are suggesting.
Meanwhile, equities rebounded substantially from extreme oversold levels. For the S&P 500 Index, the intraday low of 4114 established on “invasion day” has so far marked the bottom for this cycle. For SPY, the equivalent low on 2/24/22 was 409.37; SPY has rallied ~10% since that intraday low.
Finally, with the end of Q1, we can take a momentary deep breath and collect ourselves, but markets reopen for trading tomorrow, so there is no rest for the weary…
“Don’t invest in the page one news…” The Market Huddle is a podcast hosted by Patrick Ceresna and Kevin Muir, former derivatives traders. In a recent episode, Jimmy Jude: A Little Crusty, A Little Rusty, the group discussed where to find investment ideas (among many other topics and colorful stories).
“Don’t invest in the page one news from today, invest in the page 16 news that’s on its way to page one tomorrow.” The Market Huddle, 3/18/22
The trio embraced the axiom, “Don’t invest in the page one news from today, invest in the page 16 news that’s on its way to page one tomorrow.” The idea being that front-page news is already known and sufficiently priced into markets, but less covered stories are not fully appreciated and offer greater risk/reward potential.
In the “page one” context referenced above, inflation and recession risk are being widely reported and — perhaps aggressively — priced into US bond and equity markets. That basically covers the downside potential, but what about the upside potential at the other end of the spectrum? In other words, markets seem to be pricing left-tail risk (downside), but ignoring right-tail risk (upside).
“There are many well-reasoned, tangible, concrete, and known risks to the US and global economic expansion. And these issues will not be a ‘rear view’ mirror item for 4-6 months.” Tom Lee, FSInsight, 3/28/22
This was something addressed by Tom Lee of Fundstrat/FSInsight: “There are many well-reasoned, tangible, concrete and known risks to the US and global economic expansion. And these issues will not be a ‘rear view’ mirror item for 4-6 months.” Lee proceeded to reference (1) surging commodity prices, (2) risk of Russia/Ukraine spreading to other regions/countries, (3) an emerging COVID variant with a new wave of economic restrictions, (4) yield curve inversions and hawkish Fed Policy. “At the core, [these issues] lead to an unappealing trade-off between inflation and ‘kill growth’ for policymakers and have been shown to drive recessions… These are real issues [and] credible risks to the US expansion. In fact, over the past few weeks, these issues have indeed worsened. Hence, it should not be surprising that consensus is bearish. It should also not be surprising that the majority of our clients see a major ‘inflation problem’ ahead.”
“But most curiously, equities have been rising consistently in the face of these building headwinds… Thus, if stocks are rising furiously while the apparent risks are urging risk off, we view this as a signal. Positive signal, that is... pretty constructive price action for equities.” Tom Lee, FSInsight, First Word, 3/28/22
In terms of looking beyond the obvious for the less covered “page 16” opportunities, Lee pointed to recent behavior in equities as a positive indicator. “But most curiously, equities have been rising consistently in the face of these building headwinds. And we know that institutional and retail investors went into recession positioning. Yet, the S&P 500 has been rallying furiously for the past few weeks and has already generated several signals only seen at major bottoms... Thus, if stocks are rising furiously while the apparent risks are urging risk off, we view this as a signal. Positive signal, that is... It is hard to escape the view that this is pretty constructive price action for equities.”
“Overall we find too much negativity rather than too much complacency in markets and stay with a pro risk stance in our model portfolio.” Marko Kolanovic, JPMorgan, Global Markets Strategy, 3/30/22
In a succinct way, JPMorgan’s Marko Kolanovic summarized a similar view of prevailing conditions: “Overall, we find too much negativity rather than too much complacency in markets and stay with a pro-risk stance in our model portfolio.”
In closing, Fundstrat’s Lee reiterated earlier this week his high-probability conviction that the “lows” for this cycle were already established on 2/24/22.
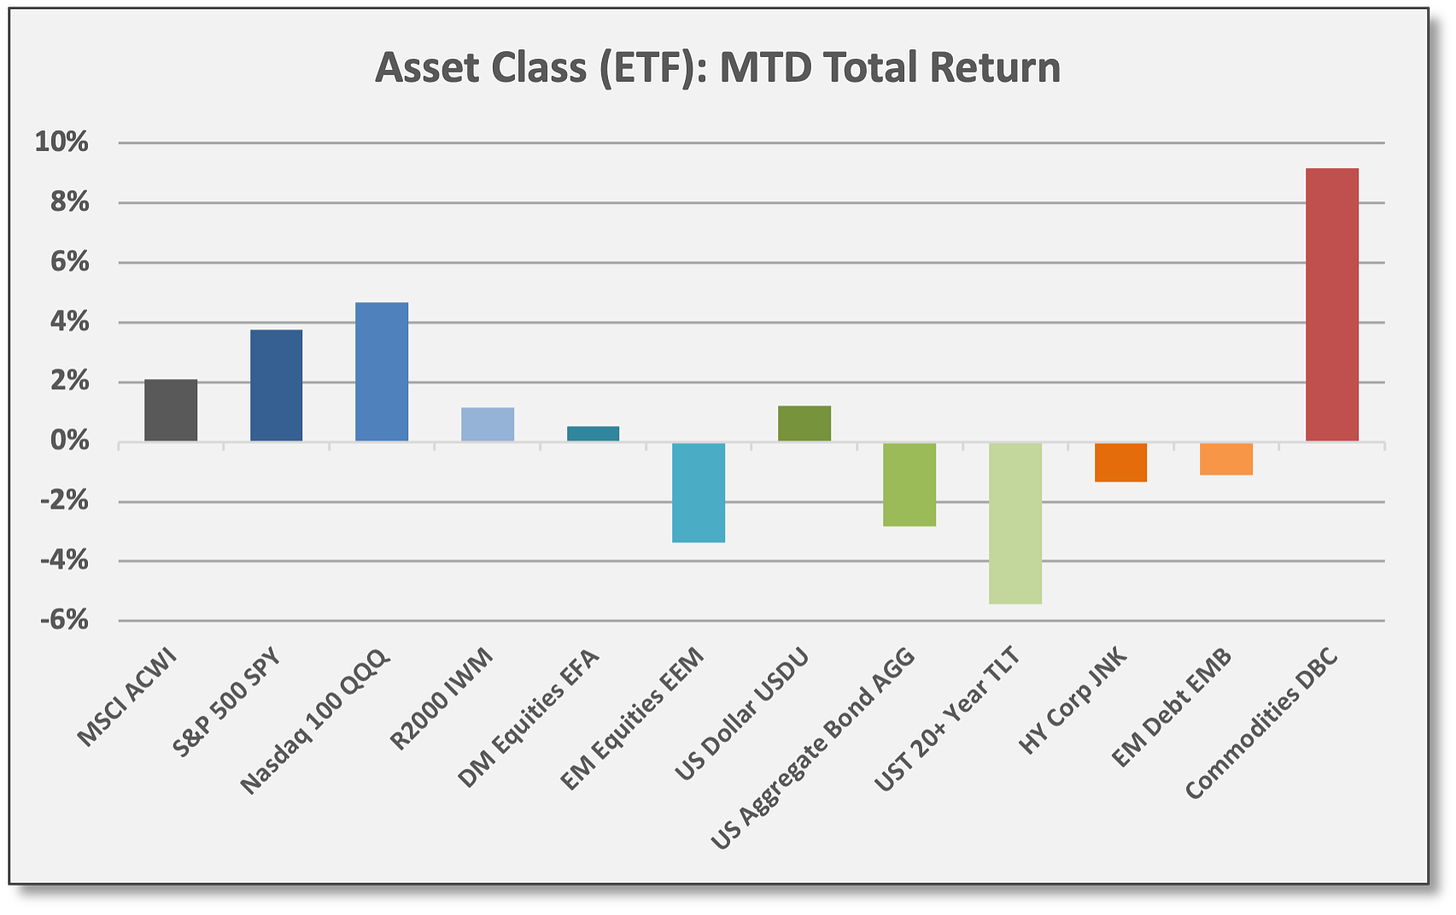
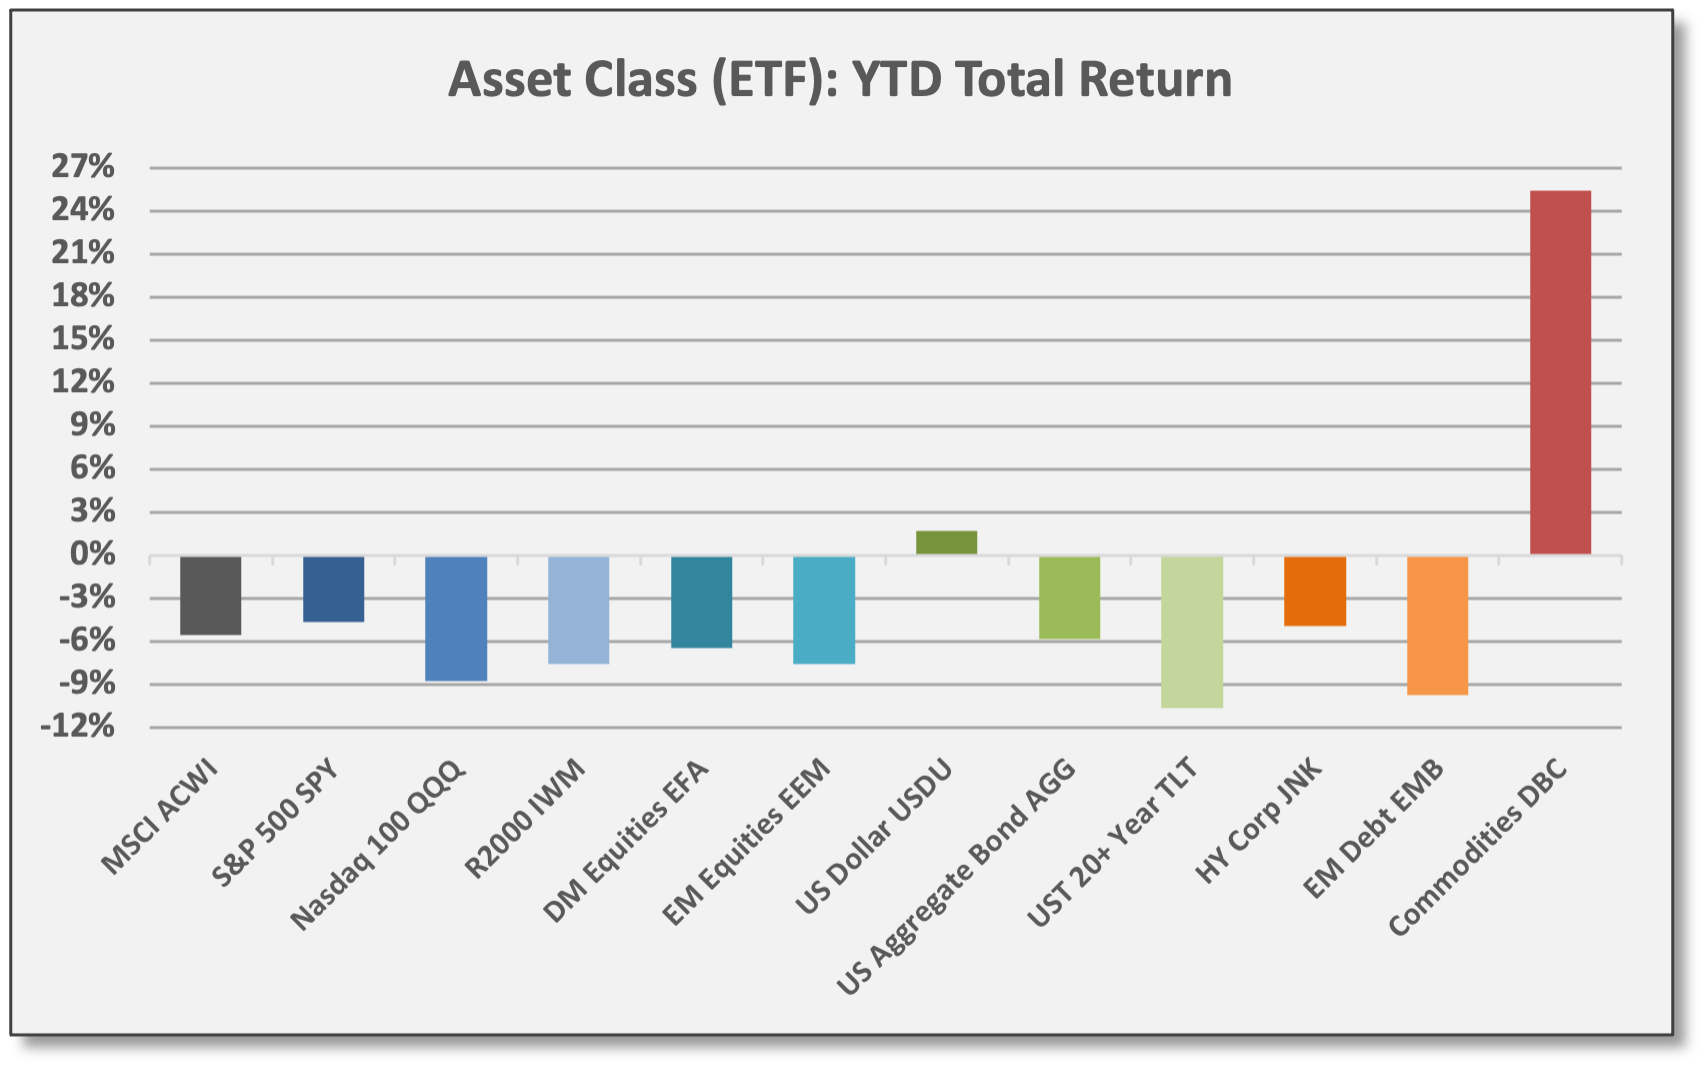
Leadership was extraordinarily narrow in Q1. Across major asset classes, only commodities and the US dollar delivered gains.
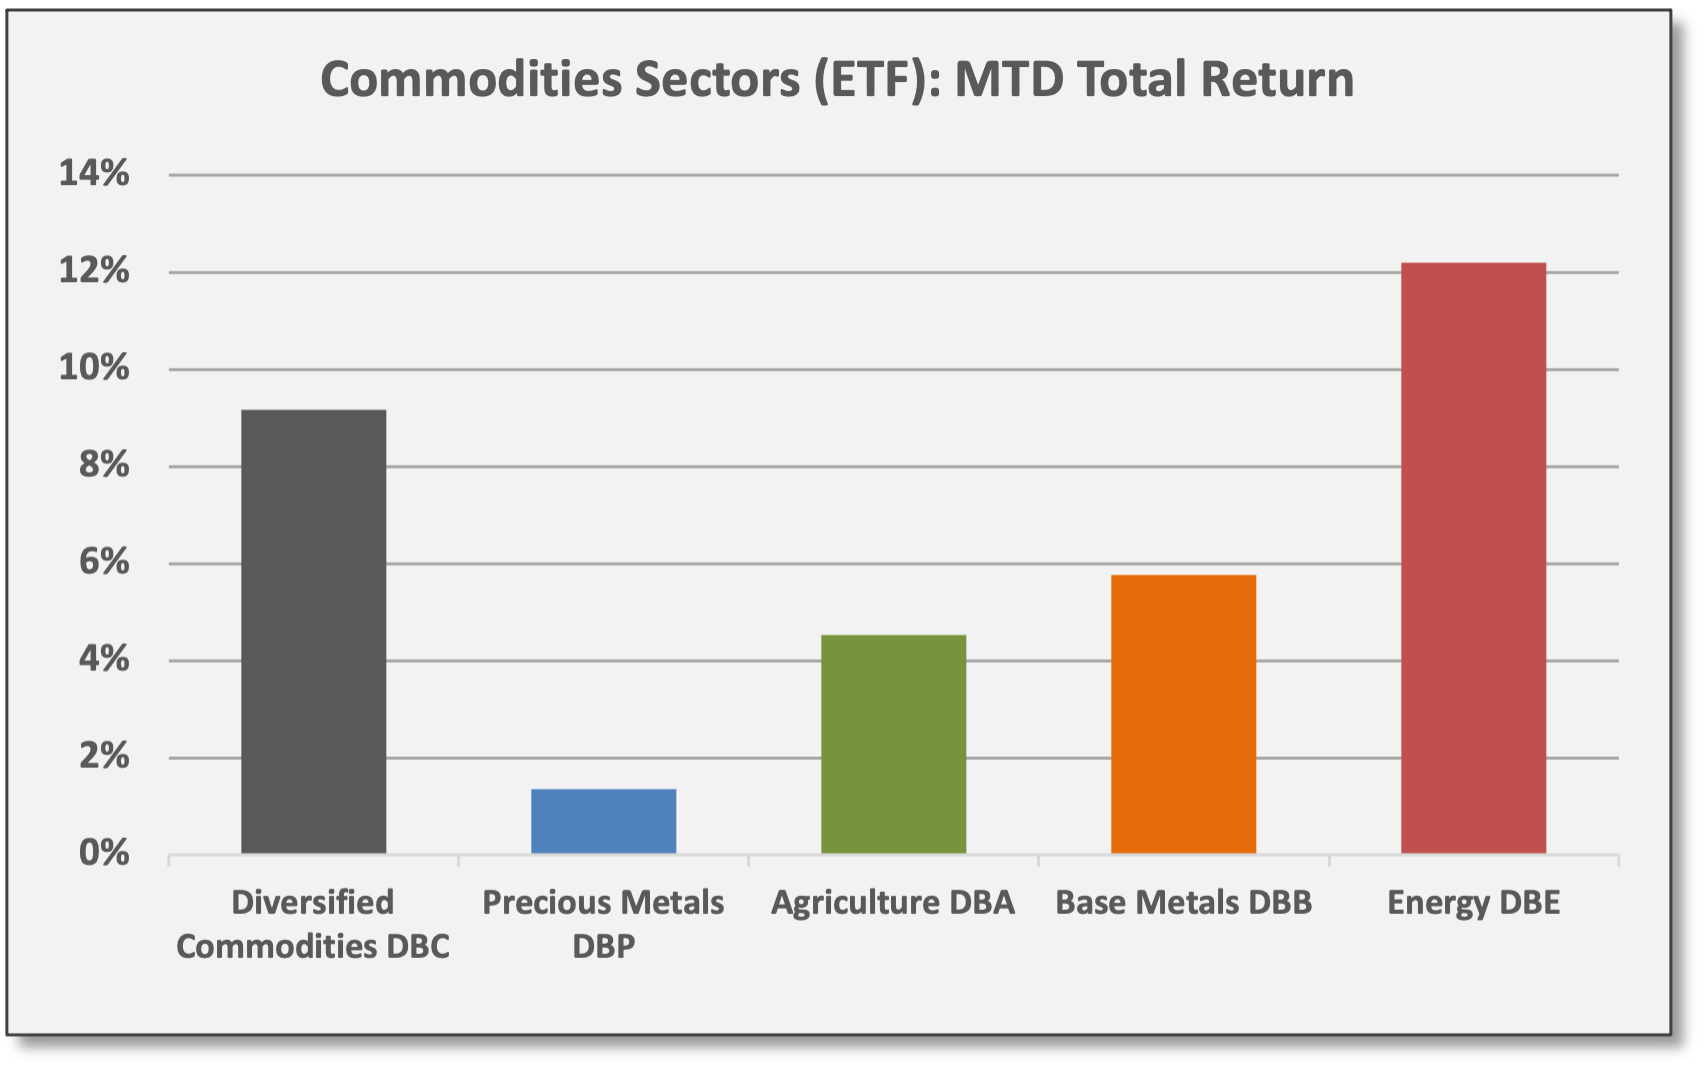
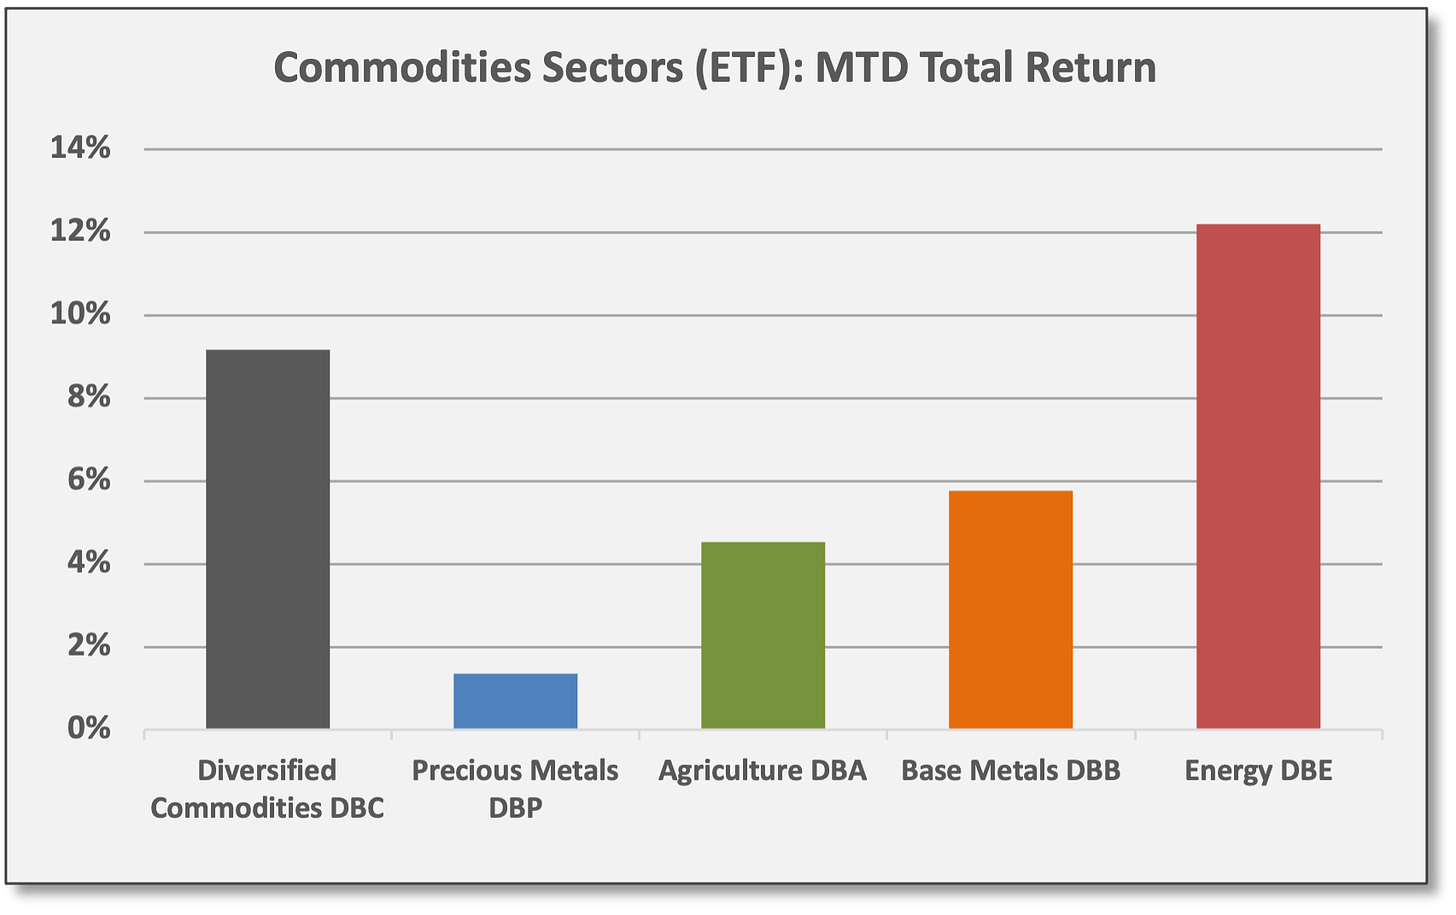
Commodities were the top-performing asset class in March, a trend that persisted throughout Q1. Energy delivered the biggest gains, but all commodity sub-sectors were positive in Q1. Diversified Commodities (DBC) gained 9.2% in March and were up 25.4% in Q1.
After declines in the first two months of the year, US equities finally posted positive returns in March. S&P 500 (SPY) gained 3.8% for the month; the growth-oriented Nasdaq 100 (QQQ) outperformed in March with a gain of 4.7%. For Q1 and YTD, SPY declined -4.6%, but the QQQ declined -8.8%. Non-US equities were outperforming before Russia/Ukraine, but sharp declines ensued after the invasion.
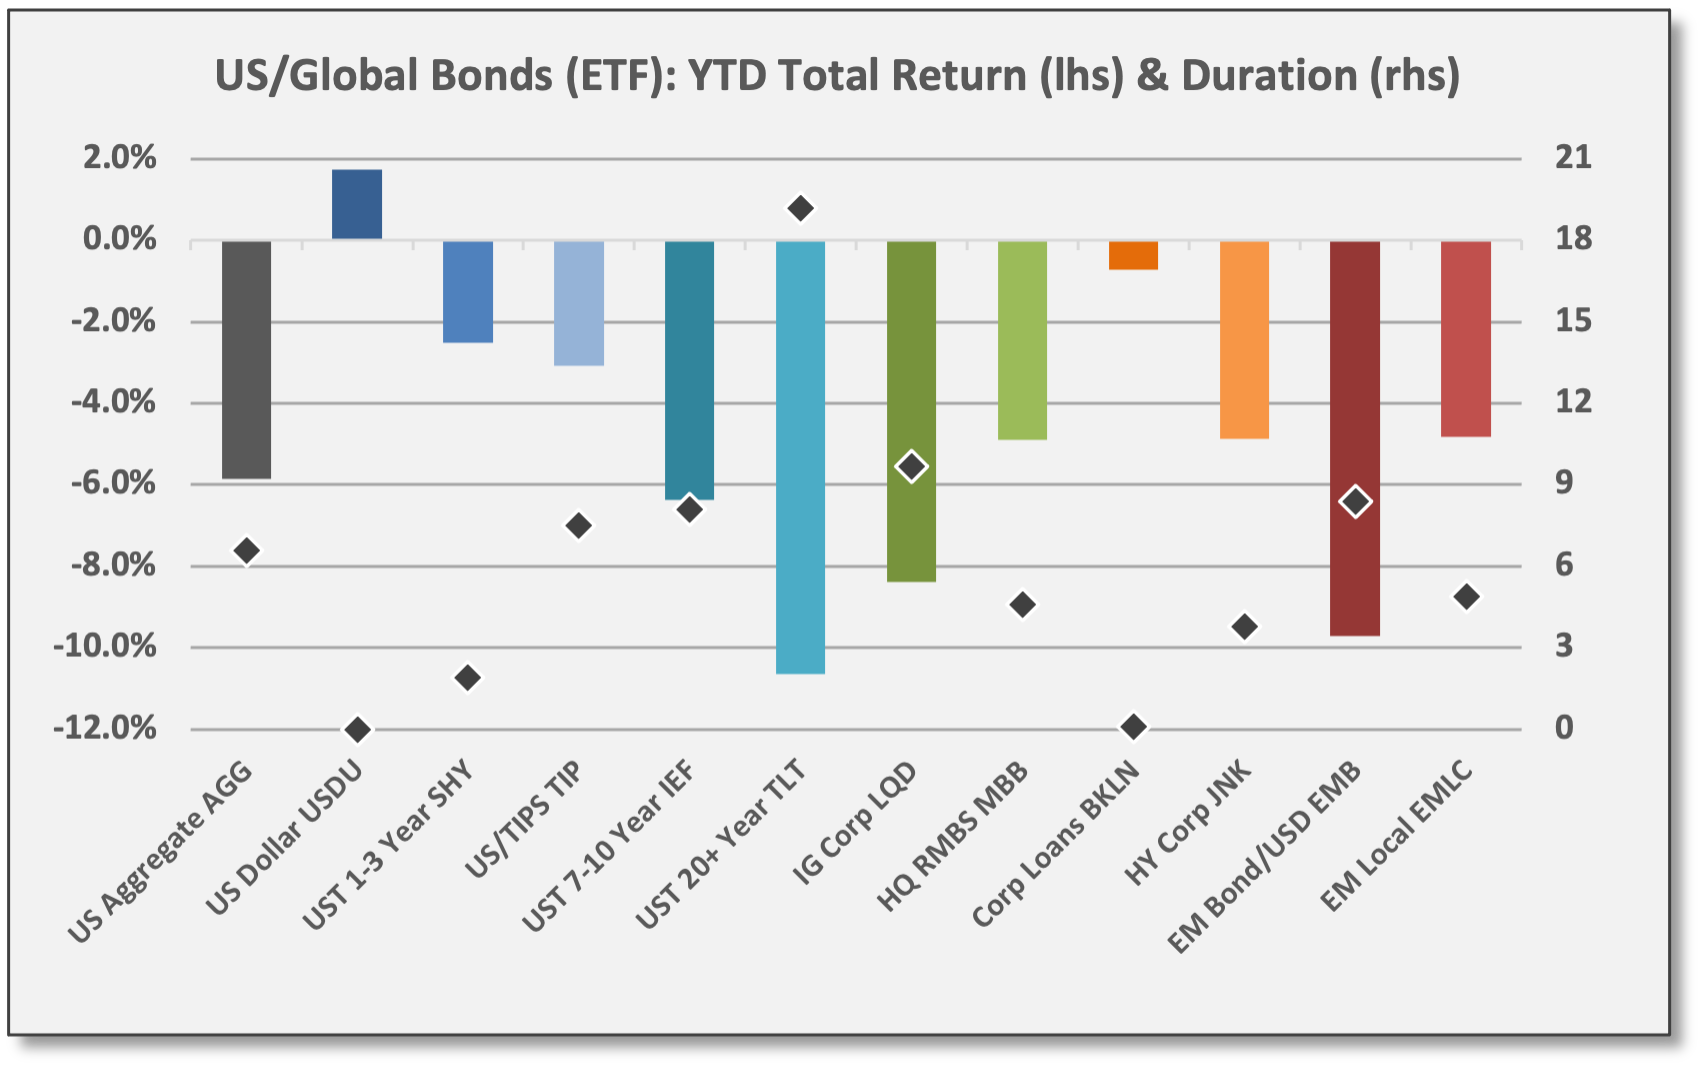
With interest rates moving higher, most bond sectors posted losses in March and Q1. After declines in January and February, US Aggregate Bond (AGG) declined again in March with a loss -2.8% for the month to finish down -5.9% for Q1. Long-duration bonds struggled the most: UST 20+ Year (TLT) declined -5.4% and -10.6% in March and Q1, respectively. Even inflation-protected bonds posted losses in Q1 due to rate sensitivity (duration). Only the US dollar was positive for Q1.
Sources: CCM, Koyfin 
Sources: CCM, Koyfin

We aim to deliver timely and relevant data/insights.
Monthly updates are designed as a recap and data reference in contrast to our weekly briefings which provide extensive commentary from across our research network.
For full access to the recurring content of Coffee & Capital Markets, please join our community as a paid subscriber.
US/Global Equities
After declines in the first two months of the year, US equities separated from bonds to finally post positive returns in March. Our best explanation for why US equities rallied in March is twofold. (1) Shares were extremely oversold amid extremely bearish sentiment, so a technical bounce off the lows made sense — supported by short-covering and delta-hedging by options dealers along with rebalancing flows (from bonds) and perhaps some buying from fundamental value investors. (2) Equity investors probably delivered a bit of a “let’s get on with it” rally as the FOMC finally implemented the first interest rate hike of its new inflation-fighting regime.
Notably, the rebound was mostly driven by flows and technical factors. Fundamentals were mostly absent (except for a few positive economic reports), but corporate fundamentals and company-specific catalysts will take center stage in a matter of weeks when the Q1 earnings season begins.
Despite declines over the last two trading sessions of March, the S&P 500 (SPY) gained of 3.8% for the month. Meanwhile, the higher-beta growth-oriented Nasdaq 100 (QQQ) outperformed in March with a gain of 4.7%. For Q1, SPY declined -4.6%, but the QQQ declined -8.8%.
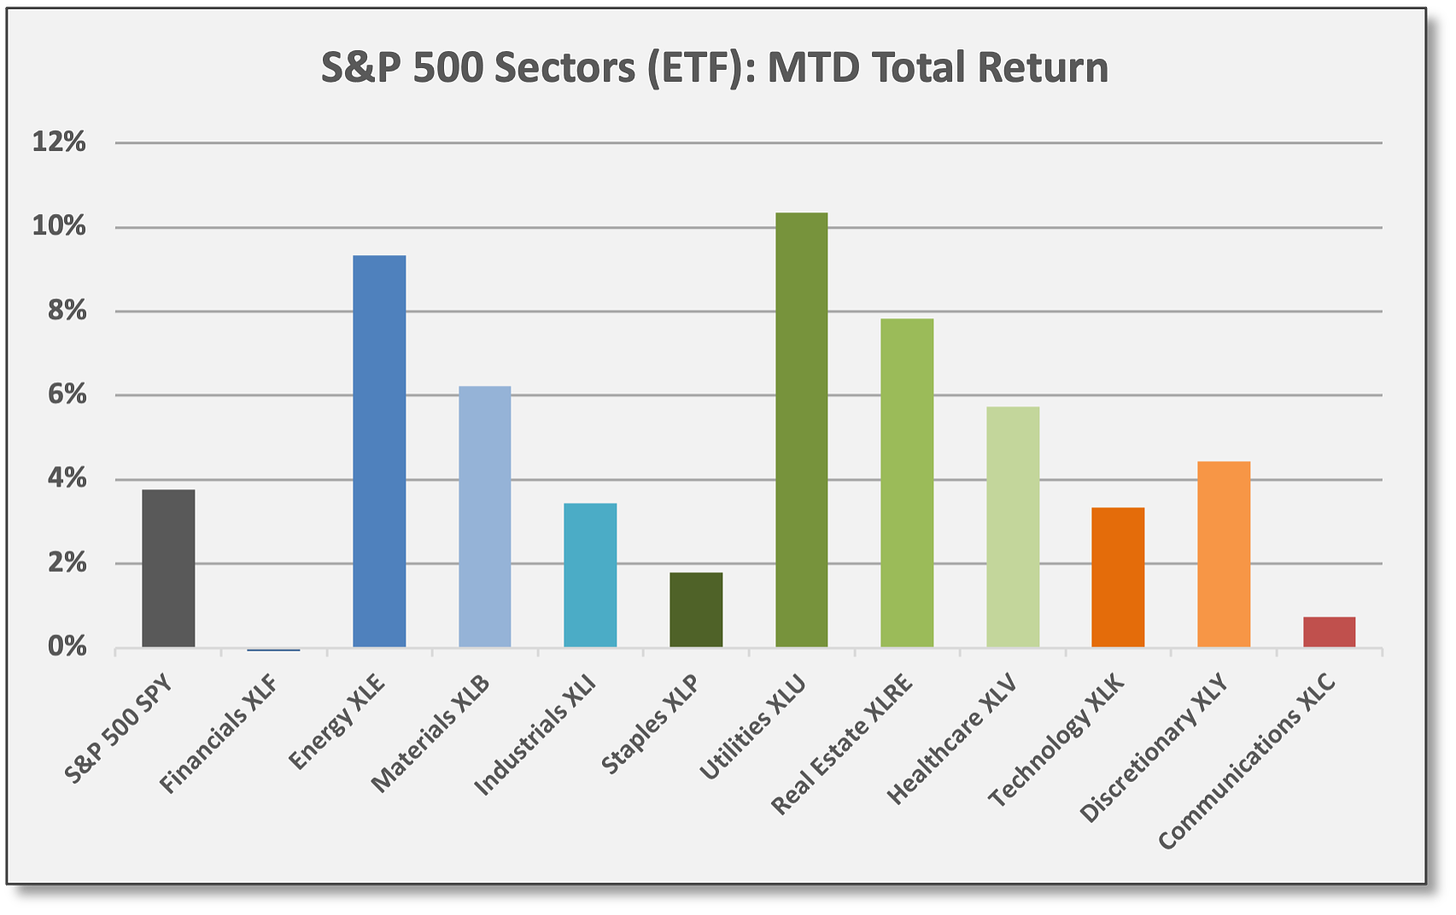
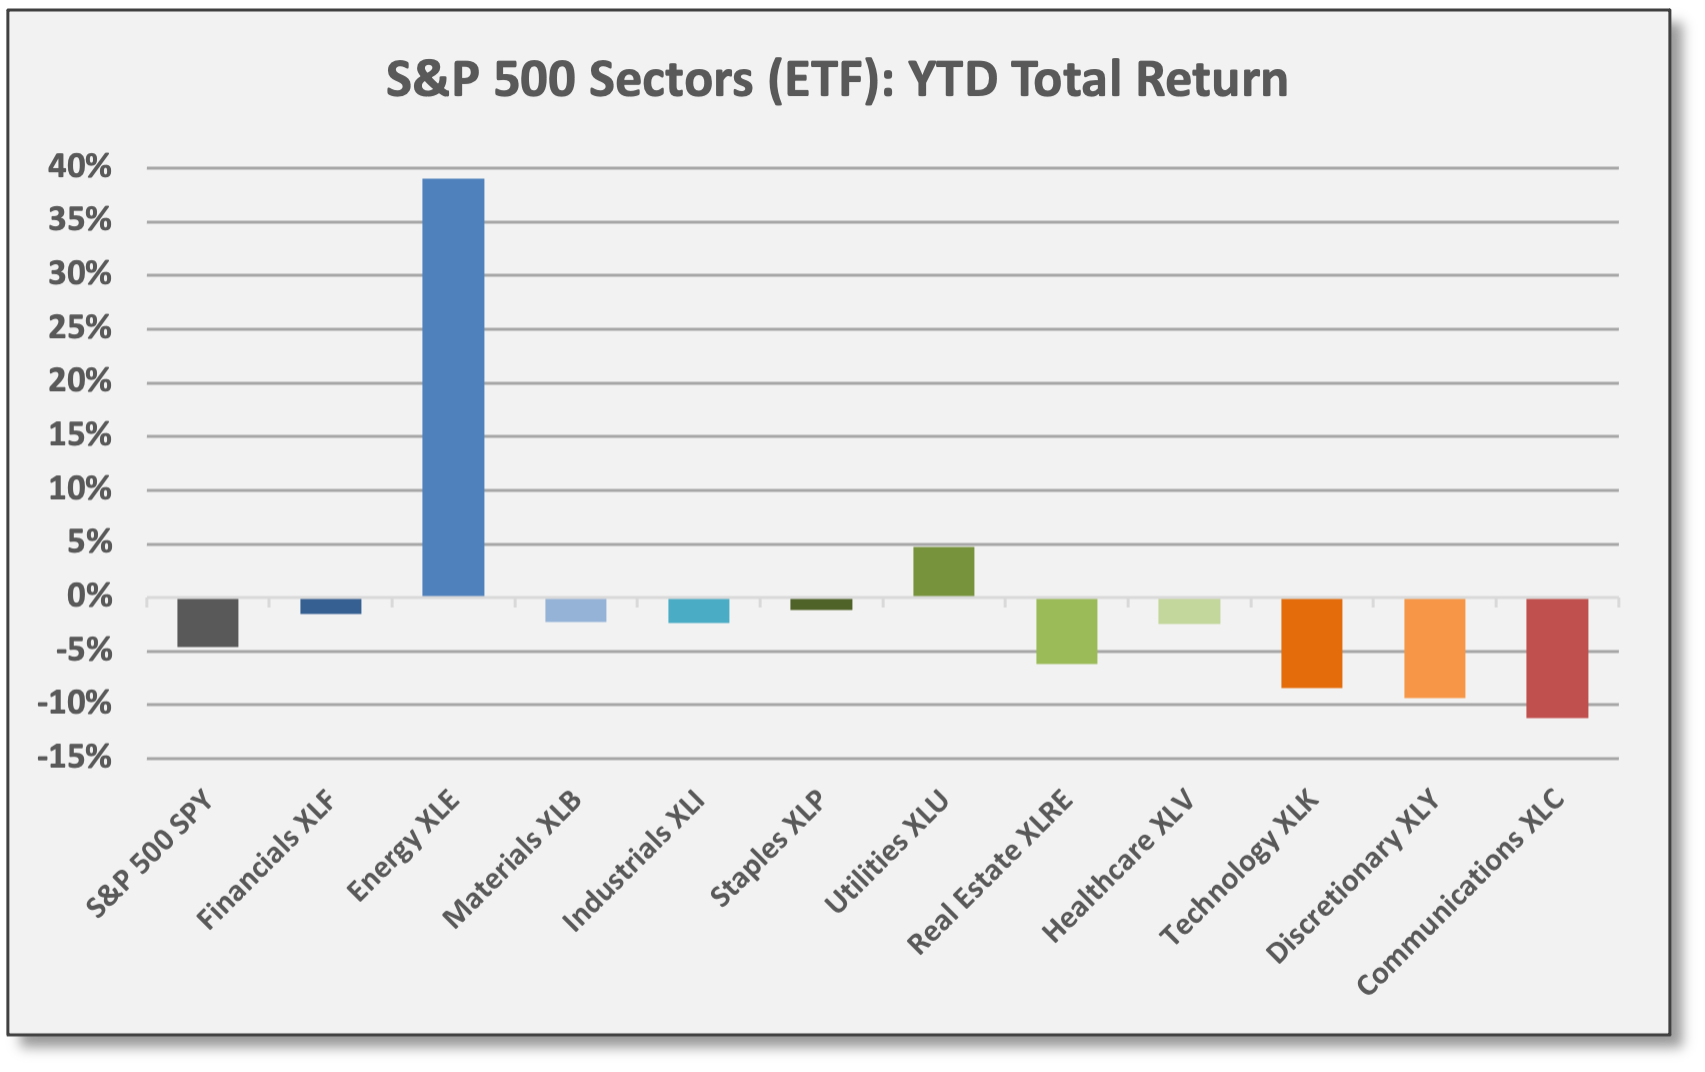
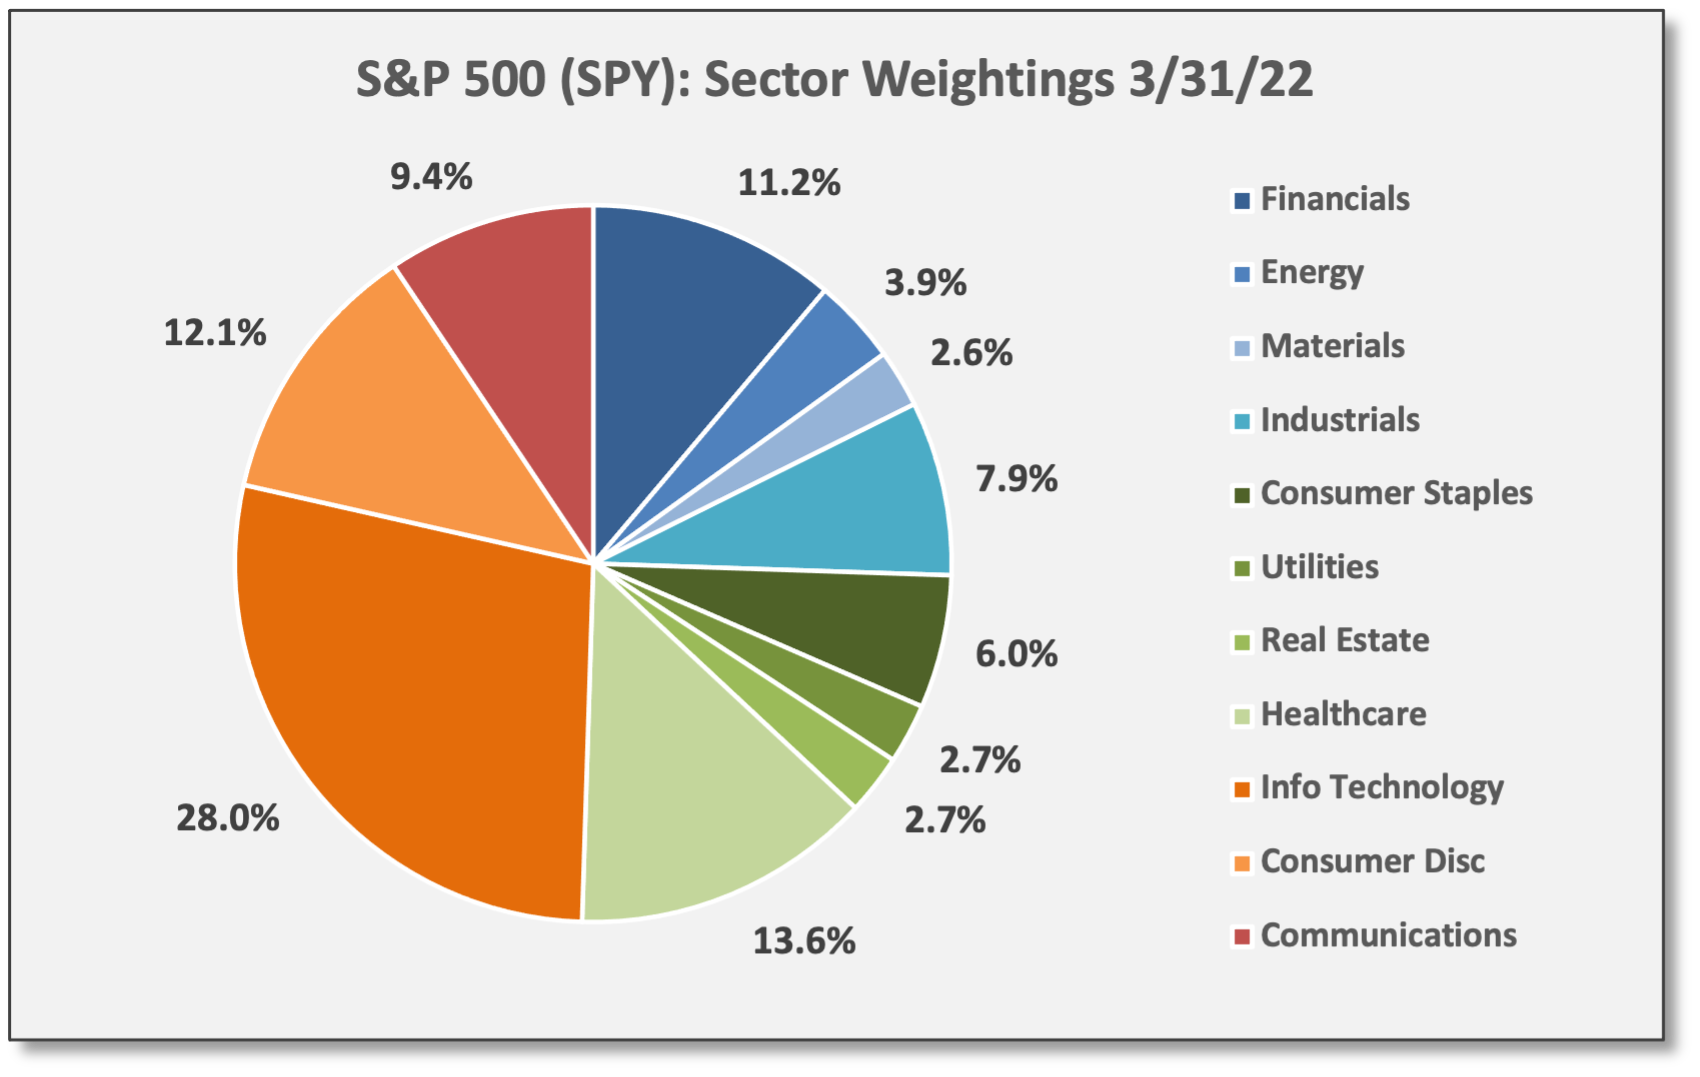
For March, 10 of the 11 sectors in the S&P 500 showed gains. Utilities (XLU) were the top performer with a massive gain of 10.3%; the defensive/yield-oriented sector seemed to benefit as interest rates moved higher — perhaps as an inflation-protected alternative to bonds, assuming Utilities can lift prices as needed. XLU finished Q1 with a dividend yield of 2.7%. Energy (XLE) continued to show leadership as the second-best performer in March. Financials (XLF) posted a modest loss, which seems rooted in the flattening of the yield curve.
For Q1, only two of the 11 sectors delivered positive returns. Energy (XLE) was the top performer with a gain of 39.1%. Utilities (XLU) gained 4.7%. Otherwise, the growth-oriented sectors — shaded in orange/red — were the bottom performers; these include Technology (XLK), Consumer Discretionary (XLY), and Communications Services (XLC) with declines of -8.4%, -9.4%, and -11.2%, respectively.
Sources: CCM, Koyfin 
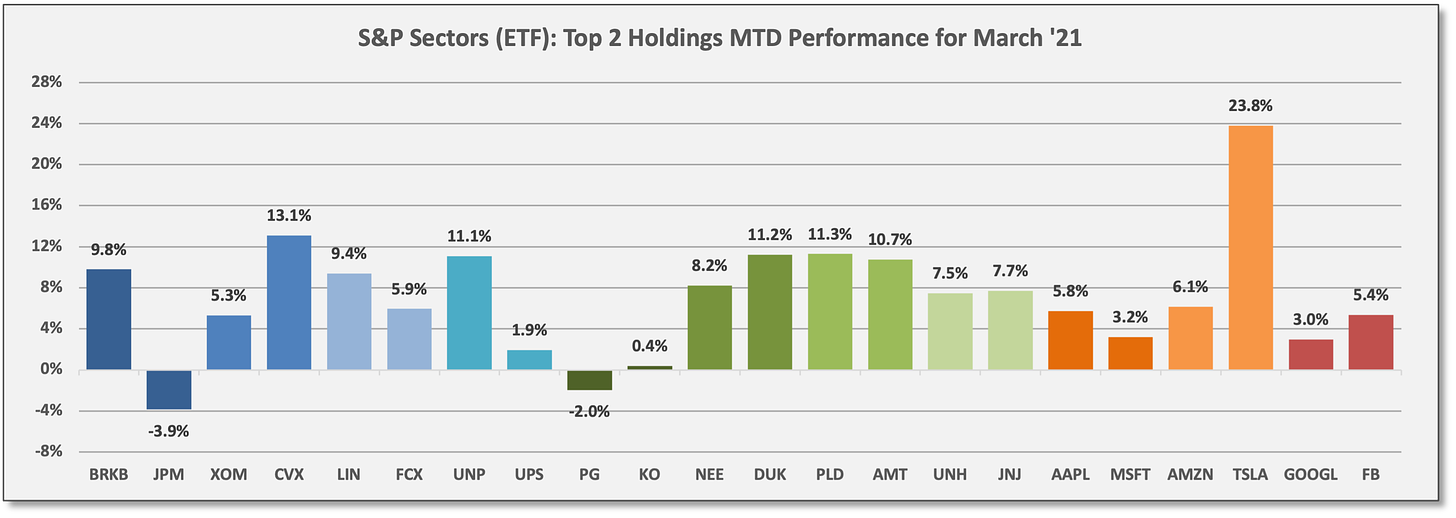
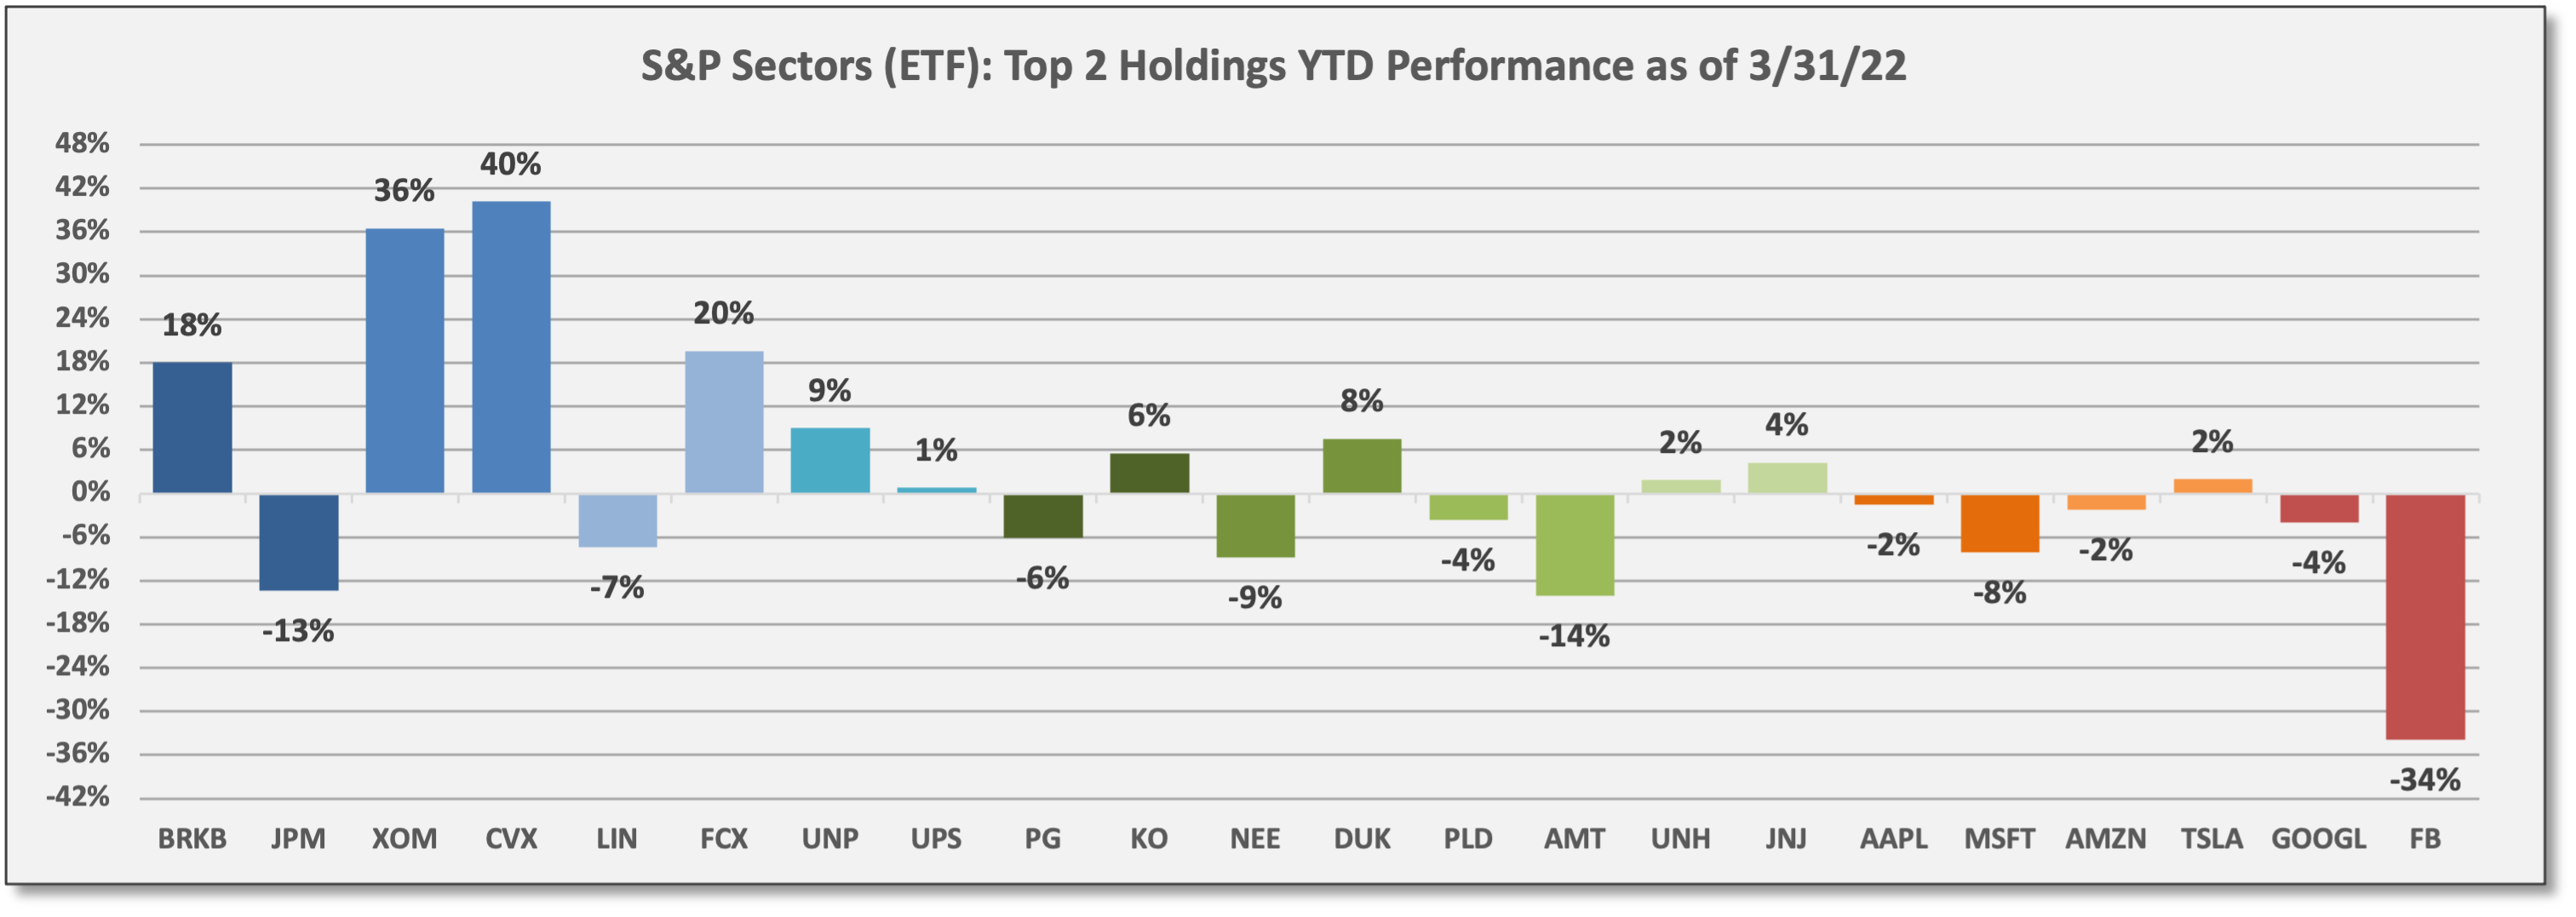
Sources: CCM, Koyfin For the S&P 500 (SPY), performance for the top two holdings across all 11 sectors is highlighted below. As a reminder, blue-shading relates to cyclical/value sectors, green-shading is for defensive/yield-oriented/balanced sectors, and orange/red-shading is for growth-oriented sectors.
In fact, all the sectors include individual names classified as “growth" and “value” but we identify the sectors based on their largest/dominant holdings and how they tend to behave from a trading standpoint.
Sources: CCM, Koyfin (Click to enlarge chart) 
Sources: CCM, Koyfin (Click to enlarge chart) 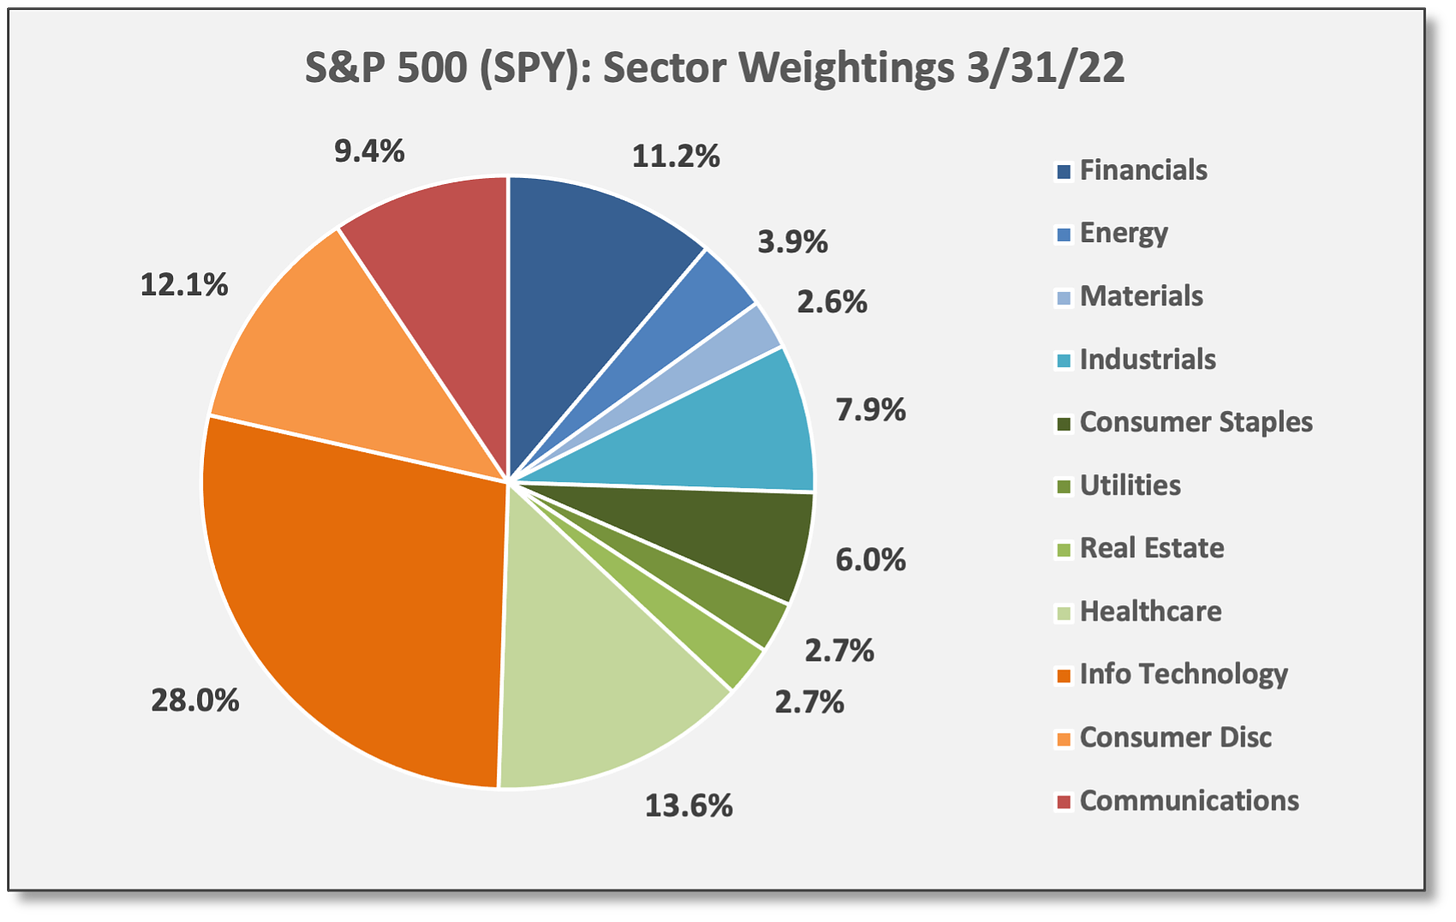
Sources: CCM, Koyfin 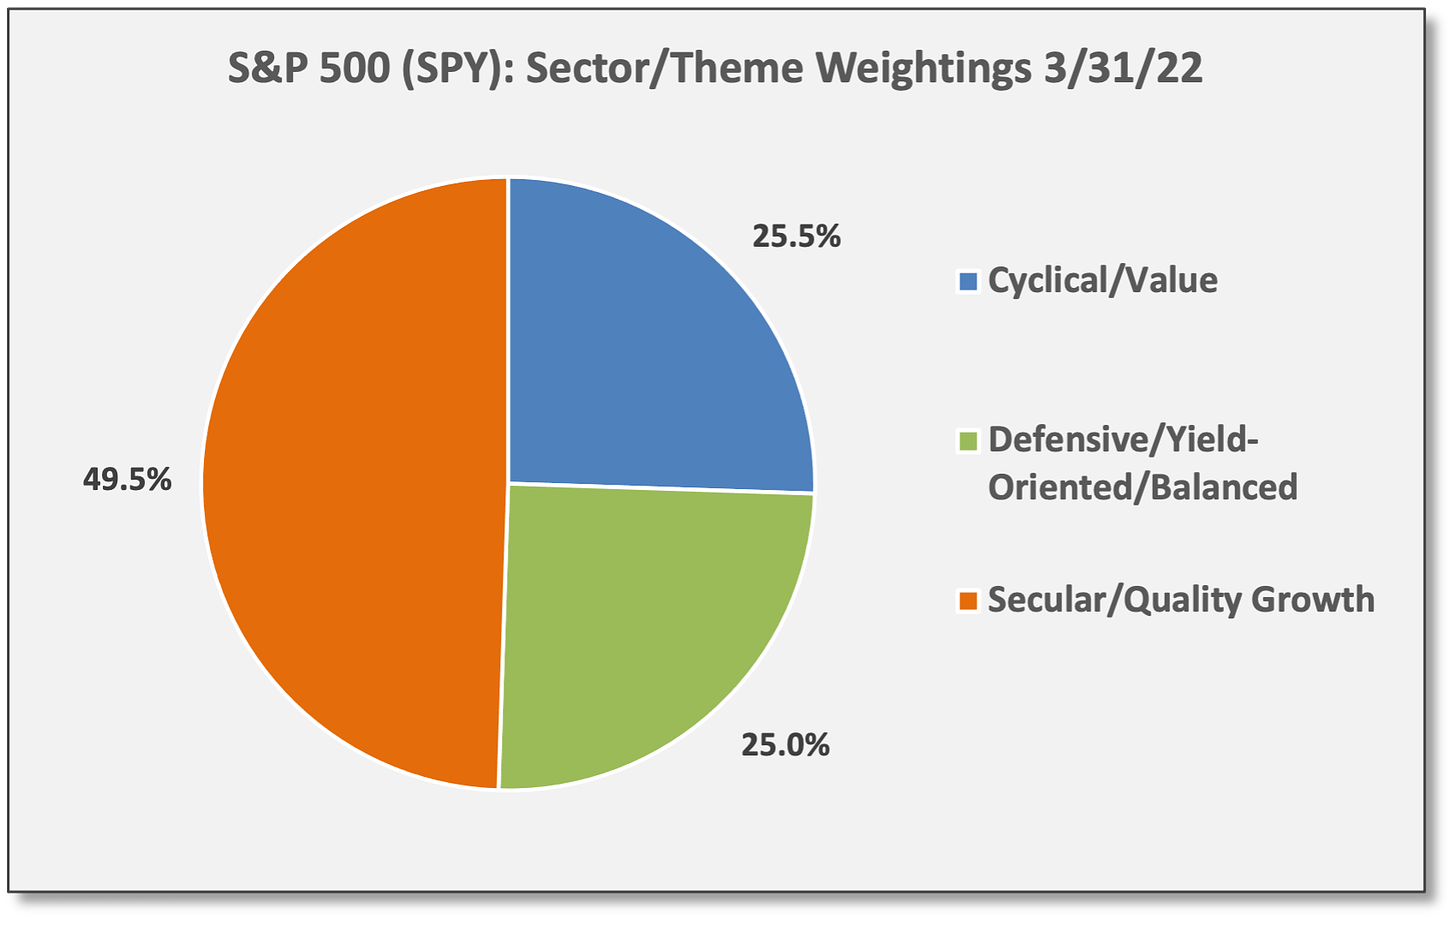
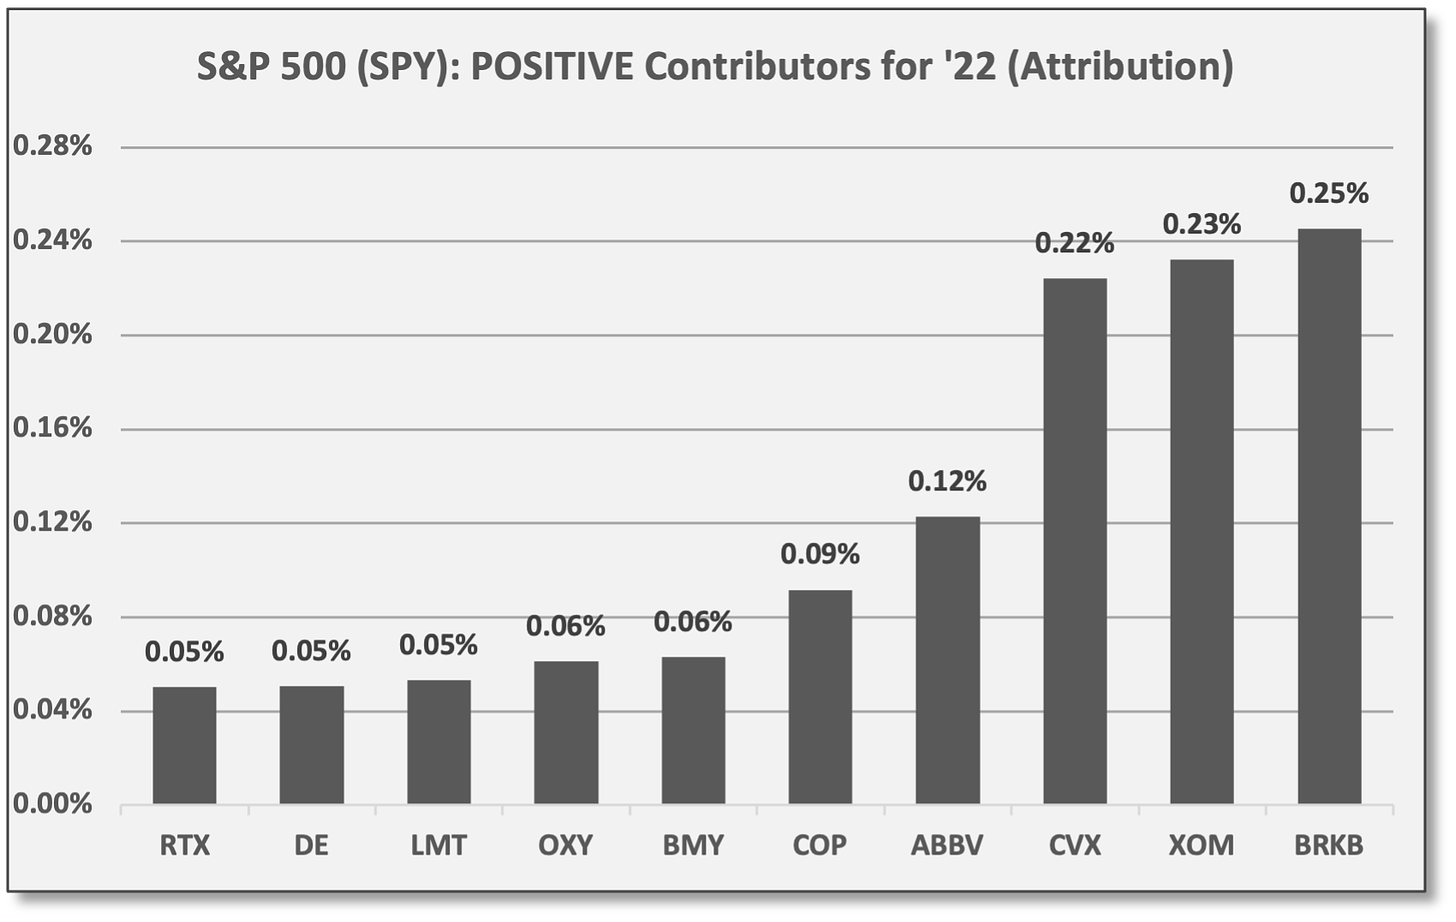
Sources: CCM, Koyfin Positive Contributors: For Q1, top positive attribution contributors to the S&P 500 (SPY) were Berkshire Hathaway (BRKB), Exxon Mobil (XOM), and Chevron (CVX). Four of the top 10 contributors were from the Energy sector. Occidental Petroleum (OXY) gained 96.2% in Q1. Two defense contractors made the top 10: Lockheed Martin (LMT) and Raytheon Technologies (RTX).
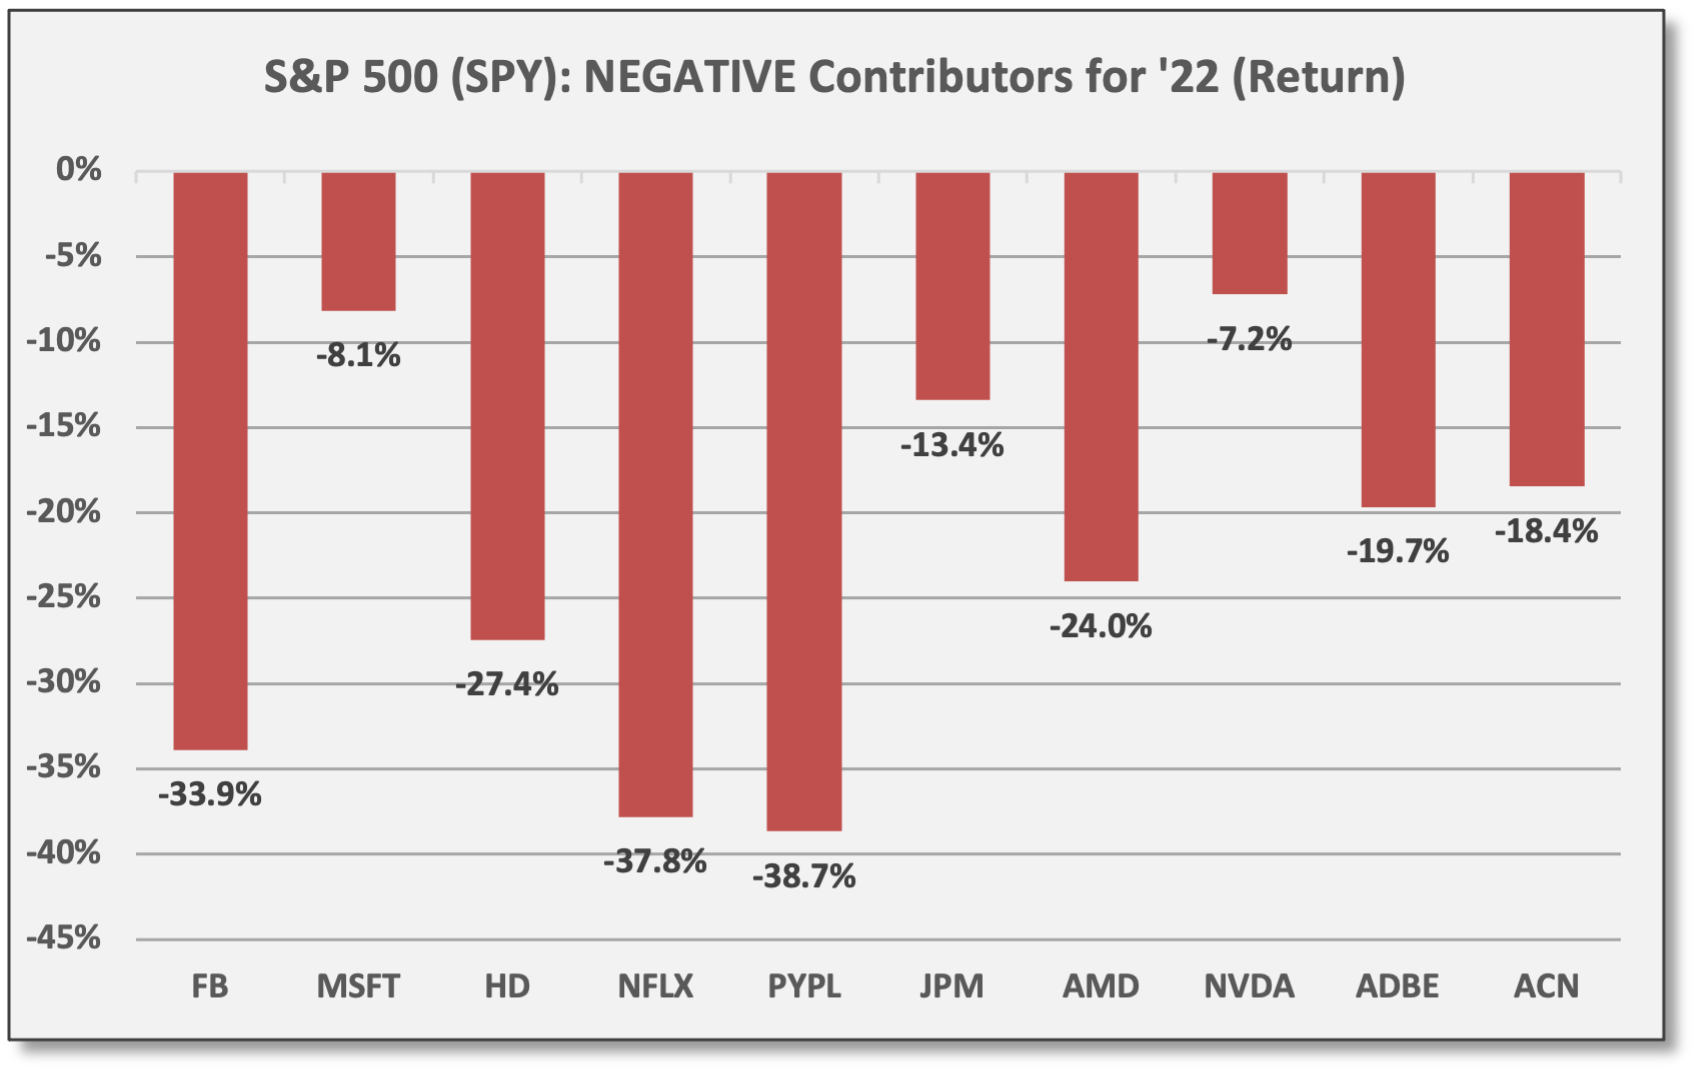
Negative Contributors: For Q1, top negative attribution contributors to the S&P 500 (SPY) were Meta Platforms (FB) and Microsoft (MSFT). FB truly underperformed with a decline of -33.9%. MSFT was a large negative attribution source due to its size — as a 6.1% holding as of 3/31 — but the software giant actually “outperformed” in Q1 with a decline of -8.1%. By contrast, Netflix (NFLX) and PayPal (PYPL) showed smaller negative contributions, but declined -37.8% and -38.7%, respectively.
Sources: CCM, Koyfin 
Sources: CCM, Koyfin 
Sources: CCM, Koyfin 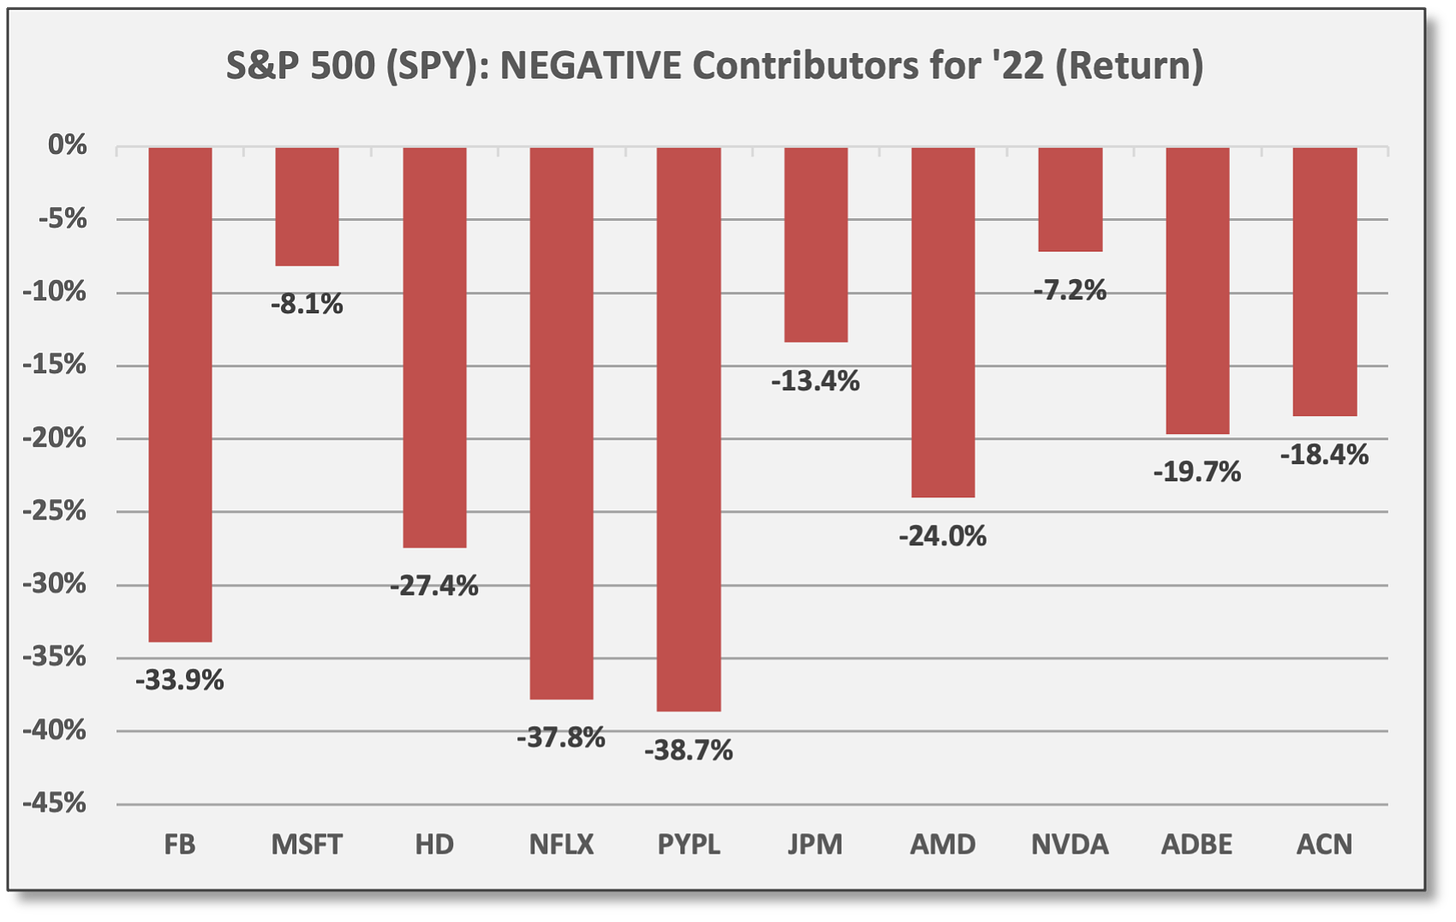
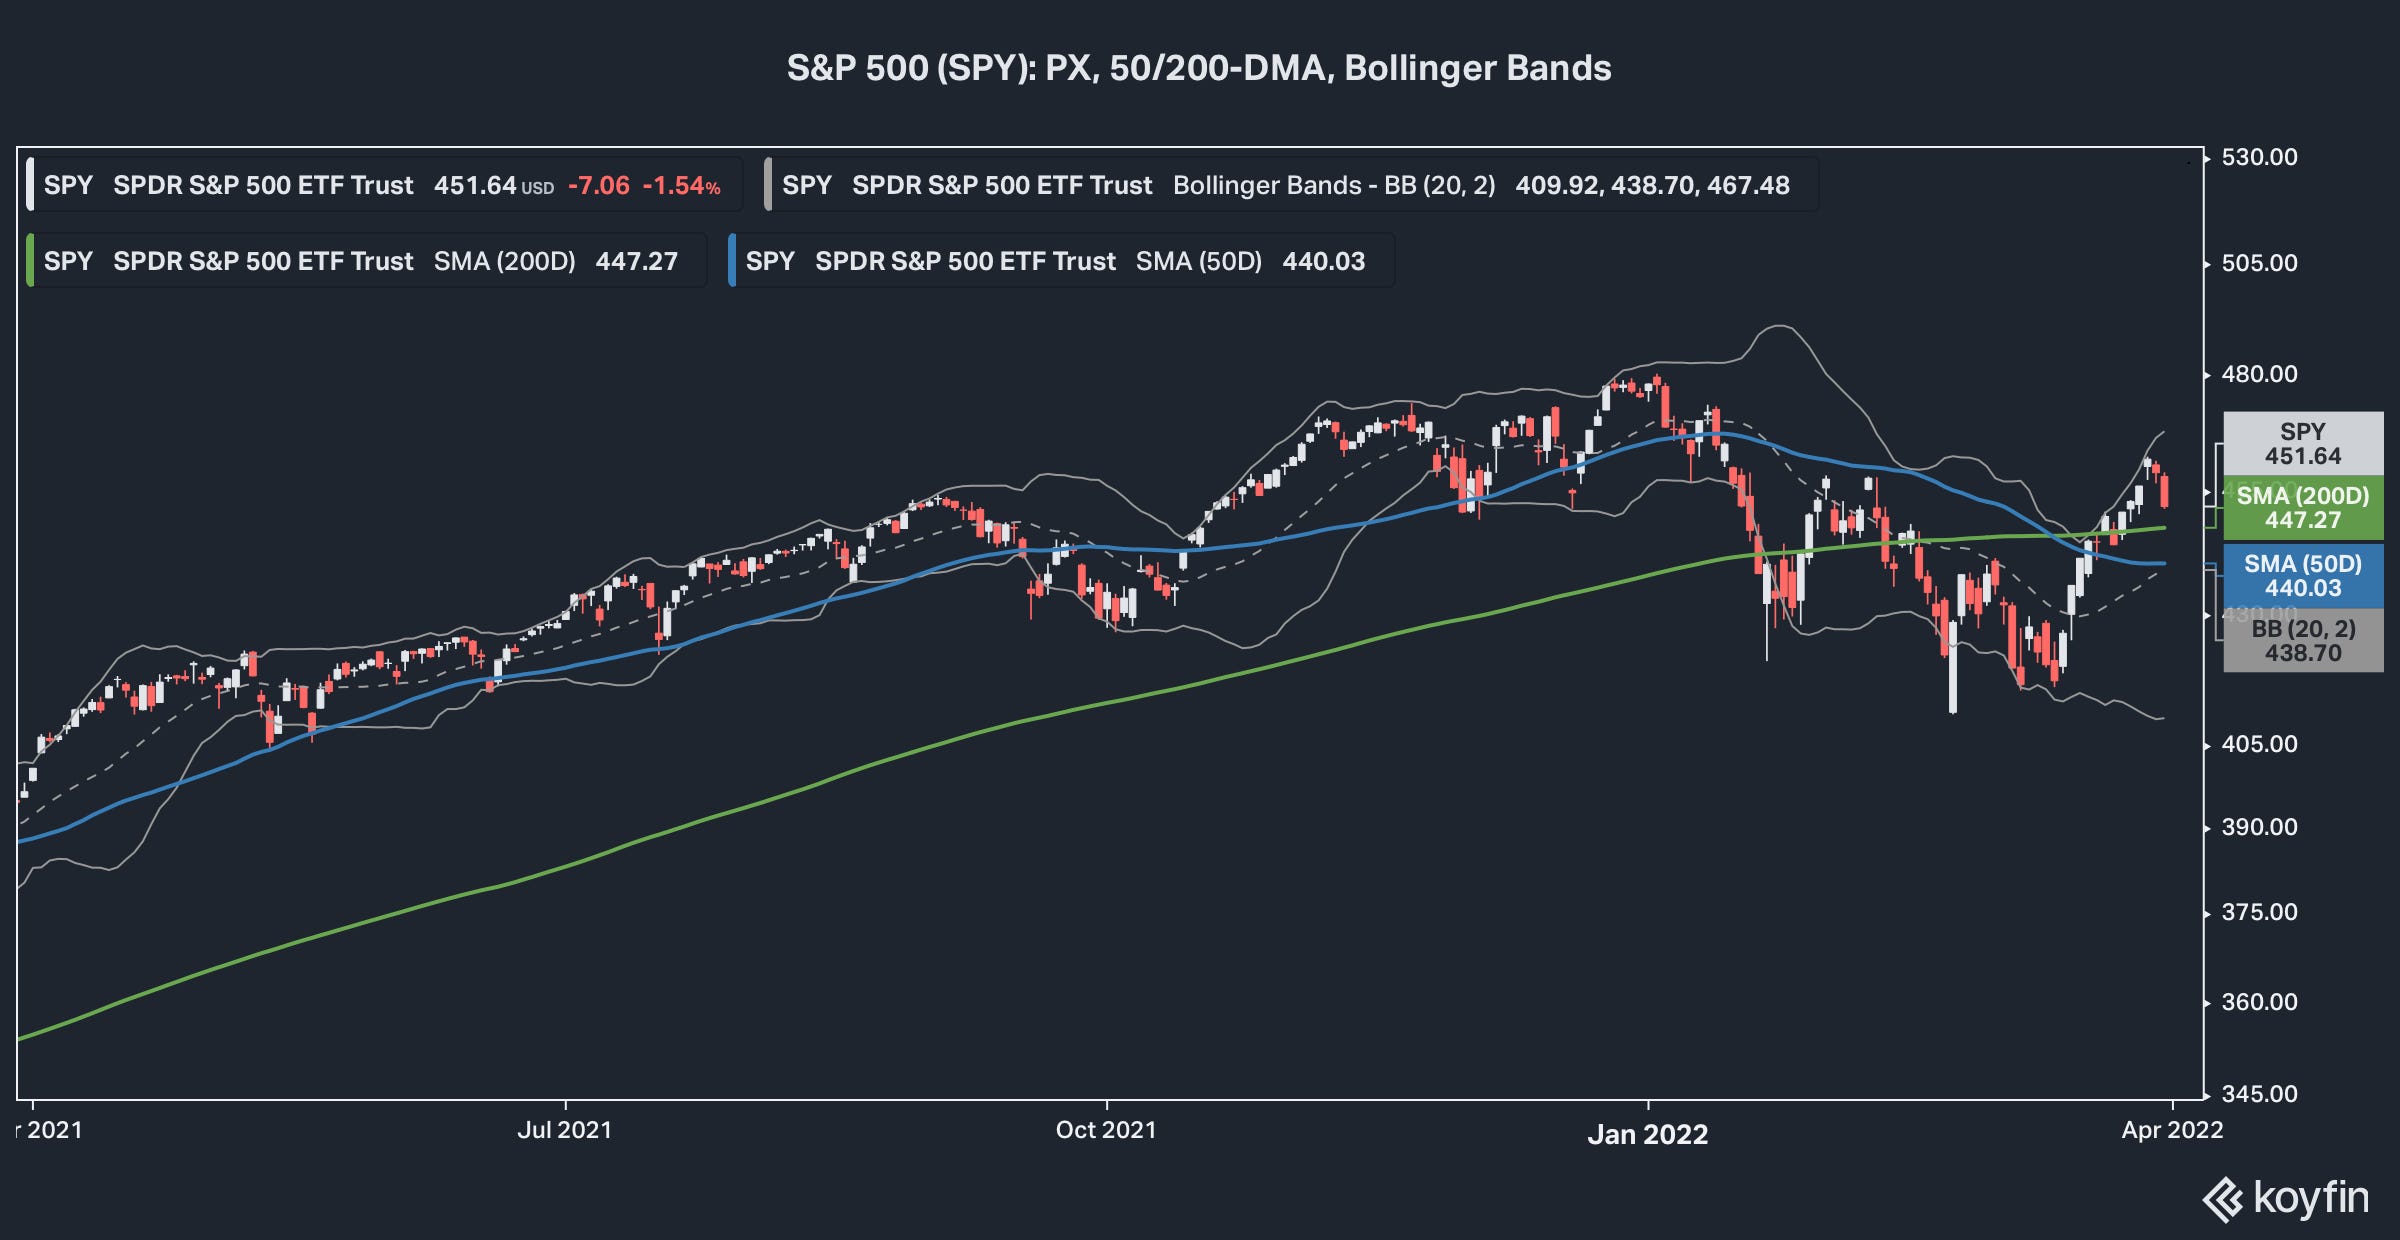
Sources: CCM, Koyfin On a technical basis, SPY closed Q1 having reclaimed its 50-day moving average. SPY also trades above its 200-DMA, but remains in a bit of a sideways trend.
Over the near-term, SPY looks a bit overextended and that might explain the sell-off over the last two sessions. SPY trades above the 20-DMA and near the upper range of its Bollinger Bands.

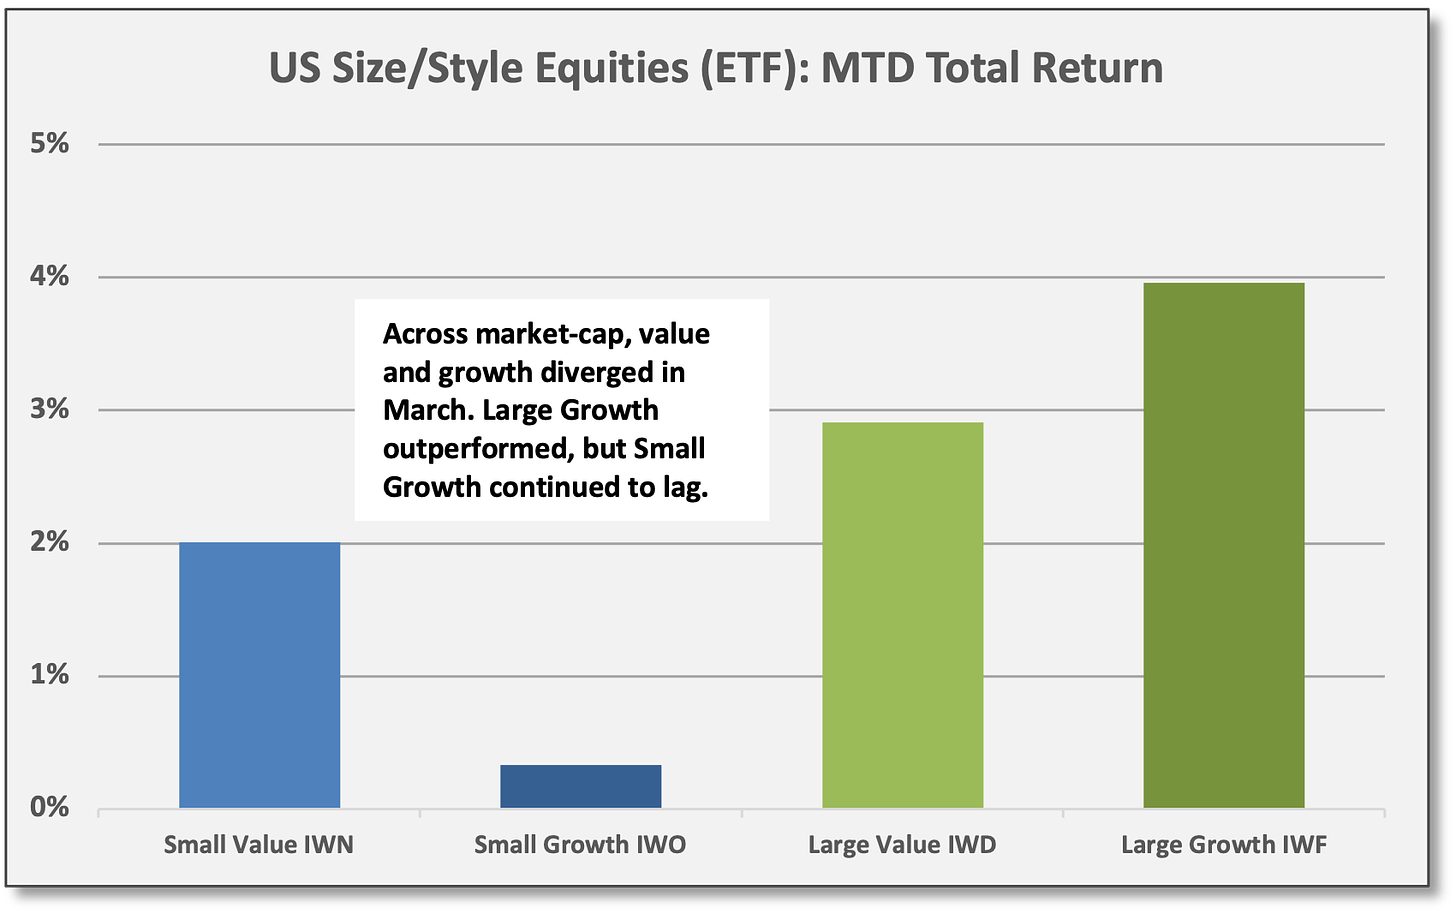
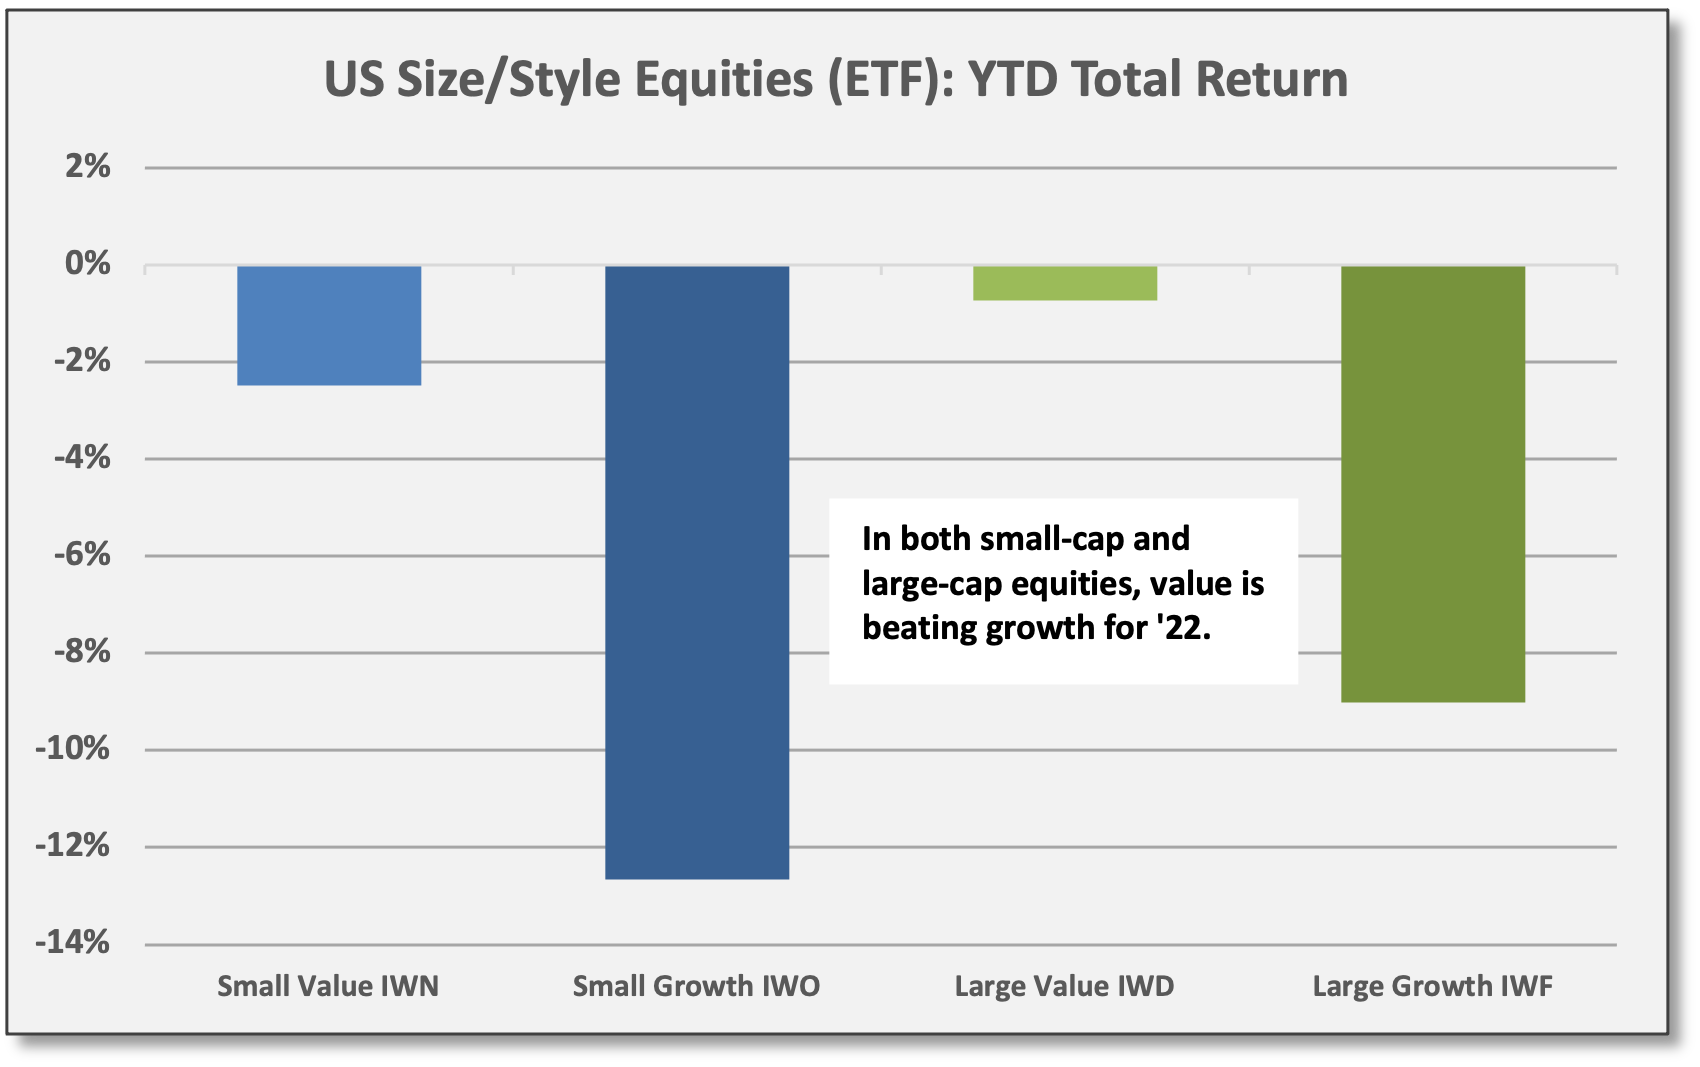
Sources: CCM, Koyfin Across the size spectrum, value has outperformed growth in 2022. However, the gap has narrowed in US large-cap equities with the recent rebound for the Nasdaq 100 (QQQ) and related secular quality growth shares.
In March, Large Growth (IWF) was the top performer across four basic size/style groups with a gain of 4.0%. All four size/style groups were positive for the month. Small Growth (IWO), however, continues to struggle due to out-of-favor “unprofitable” growth shares.
At one point during in early March amid bearish investor sentiment, the gap showed value shares outpacing growth by 13-14%, but the gap has since narrowed. At the close of Q1, Small Growth was lagging Small Value by ~1010 basis points, while Large Growth was lagging Large Value by ~825 bps.
For Q1, Large Value (IWD) and Small Value (IWN) outperformed by declining less — showing losses of -0.7% and -2.5%, respectively
Sources: CCM, Koyfin 
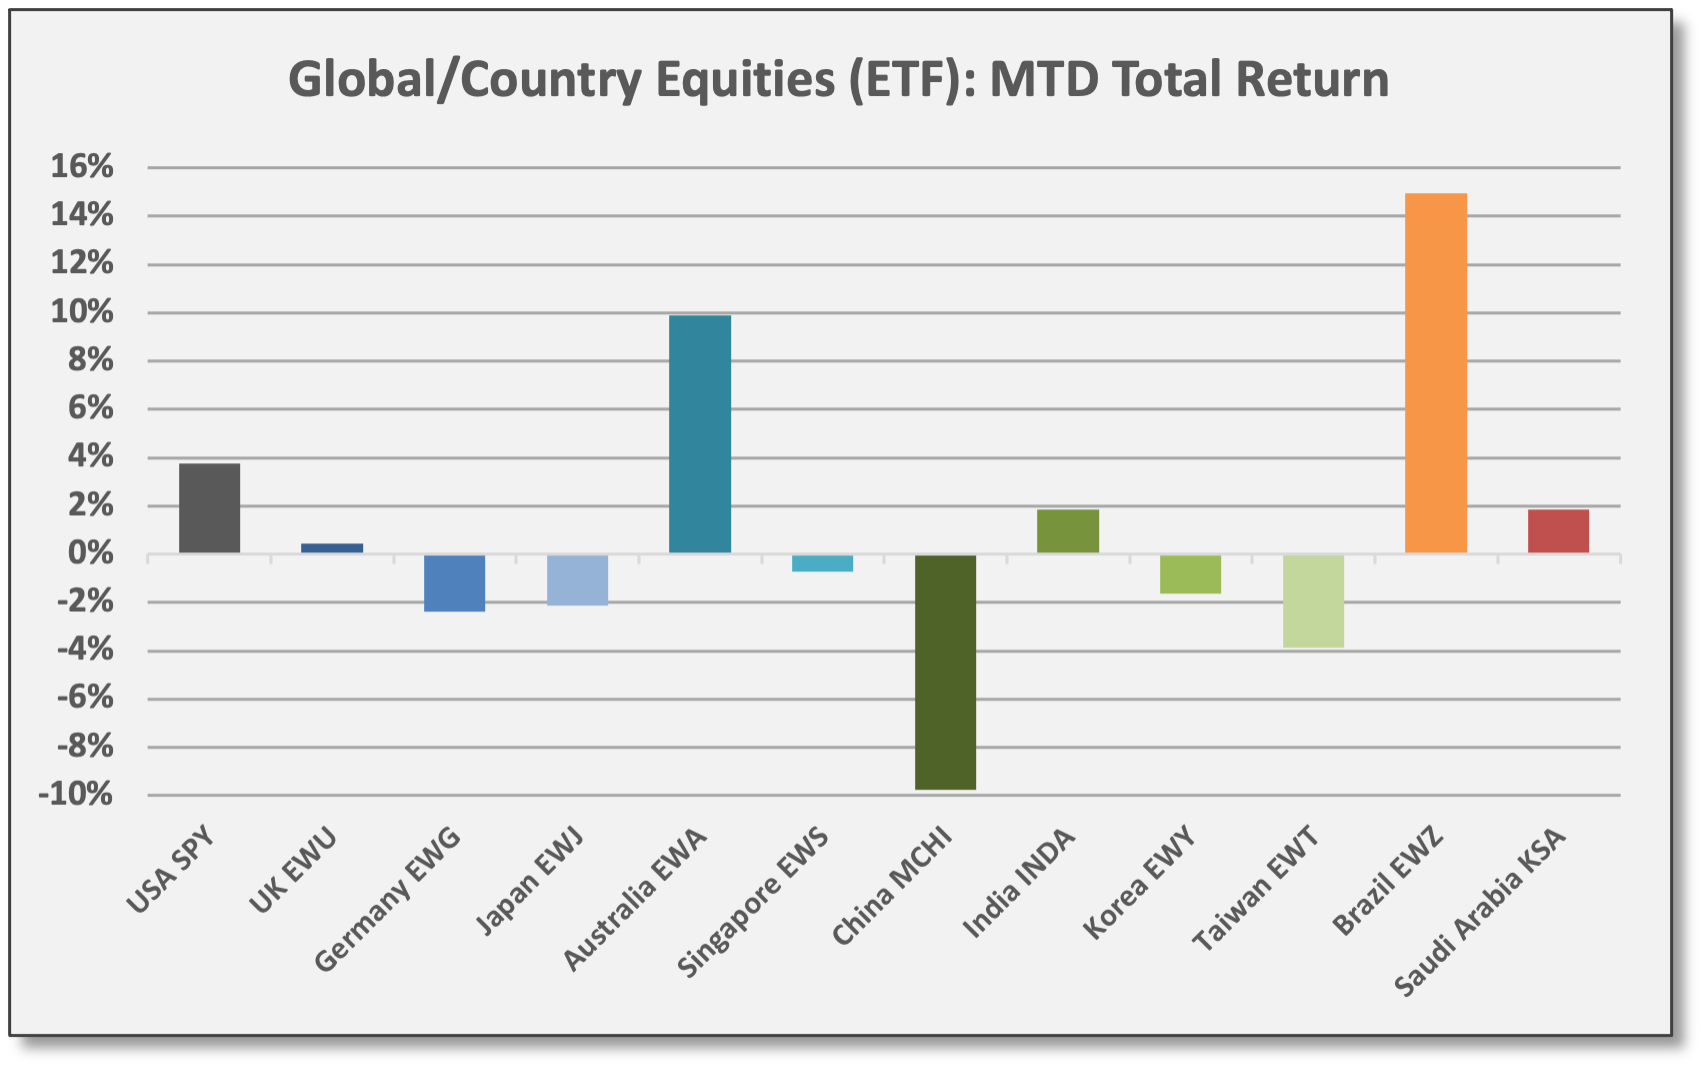
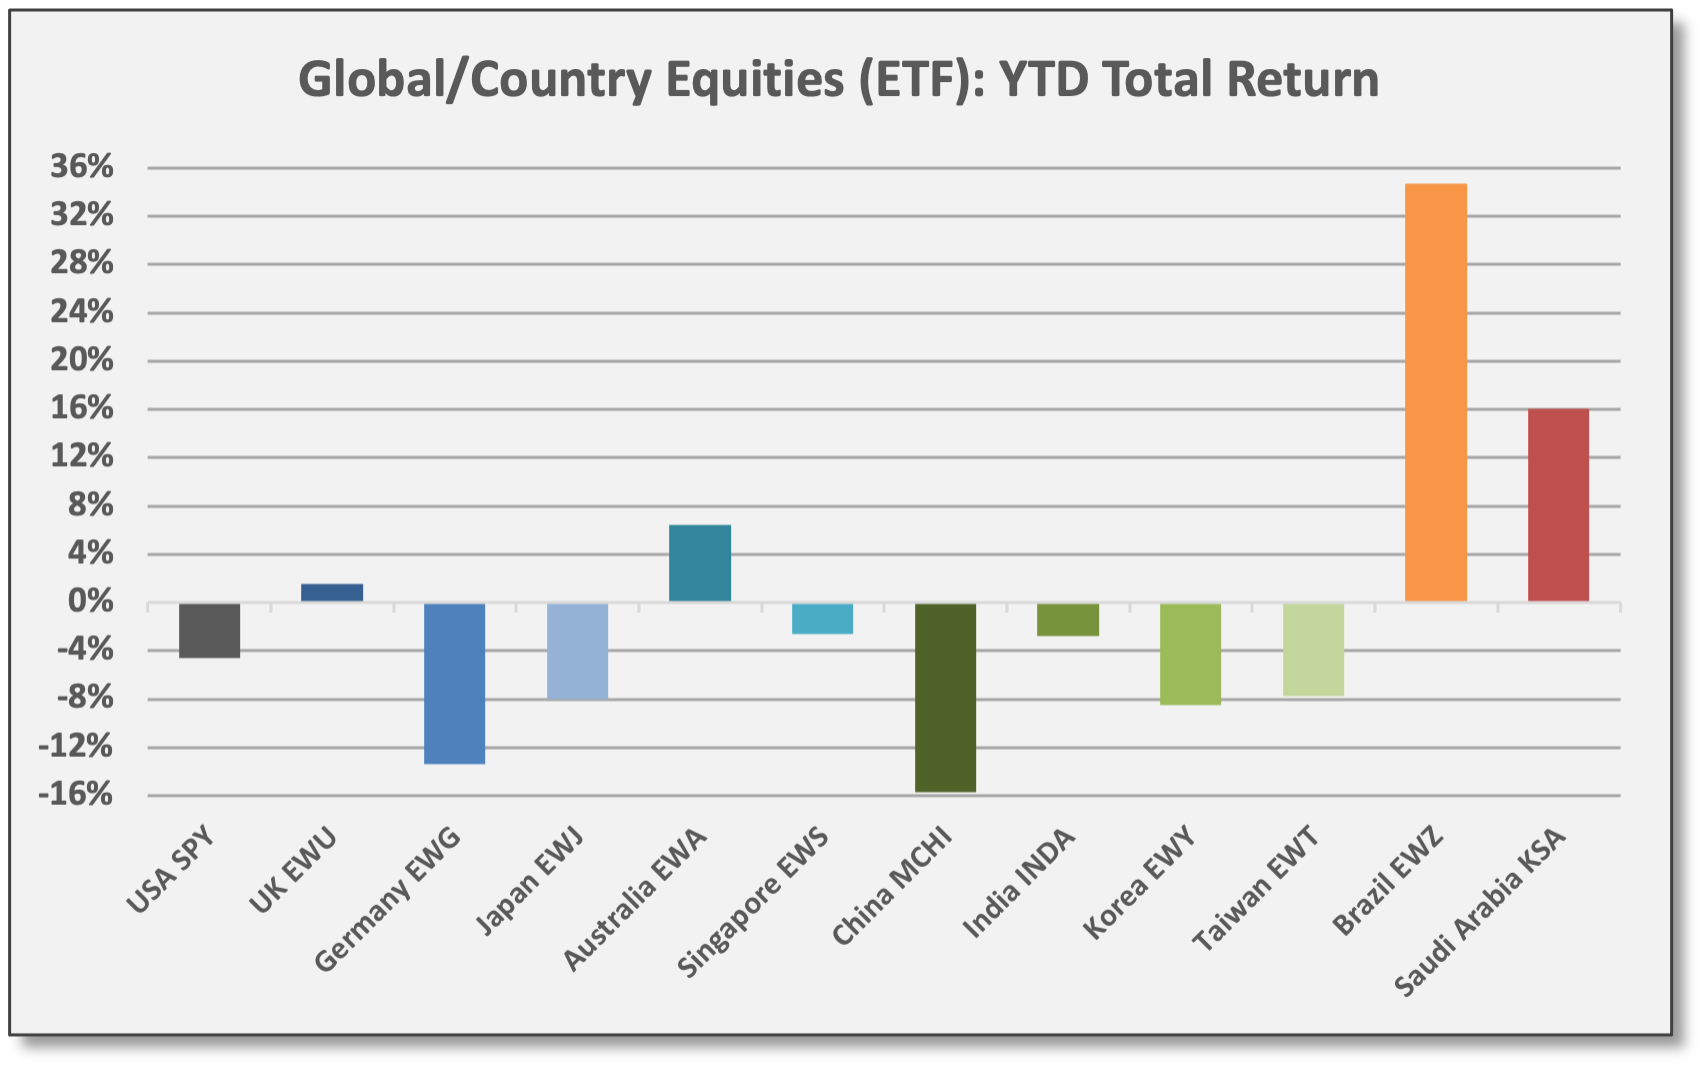
Sources: CCM, Koyfin Non-US equities were outperforming before Russia/Ukraine, but sharp declines ensued after the invasion. Any performance advantage versus the US has mostly evaporated. Developed Markets (EFA) added 0.5% in March, but were down -6.5% in Q1. Emerging Markets (EEM) declined -3.4% in March and are down -7.6% for ‘22.
Europe — and especially Germany (EWG) — underperformed given its proximity and reliance on Russian energy resources. EWG declined -2.4% in March and is down -13.4% for ‘22.
China (MCHI) has underperformed for numerous reasons this year: A global sell-off in high-priced growth shares across Tech/Media and eCommerce, persistent COVID issues, an economic growth slowdown, and continued policy pressure, although late in Q1 policymakers suggested a more supportive approach going forward. Details have yet to emerge.
Resources-based economies performed the best in March and Q1. Materials-oriented Brazil (EWZ) gained 15.0% for the month and is up 34.7% YTD. Energy-oriented Saudi Arabia (KSA) gained 1.9% in March and is up 16.1% YTD.
Russia (ERUS) dropped approximately -80% after the invasion before trading was halted; MSCI classified Russia’s equity market as “uninvestable” in early March.

Sources: CCM, Koyfin 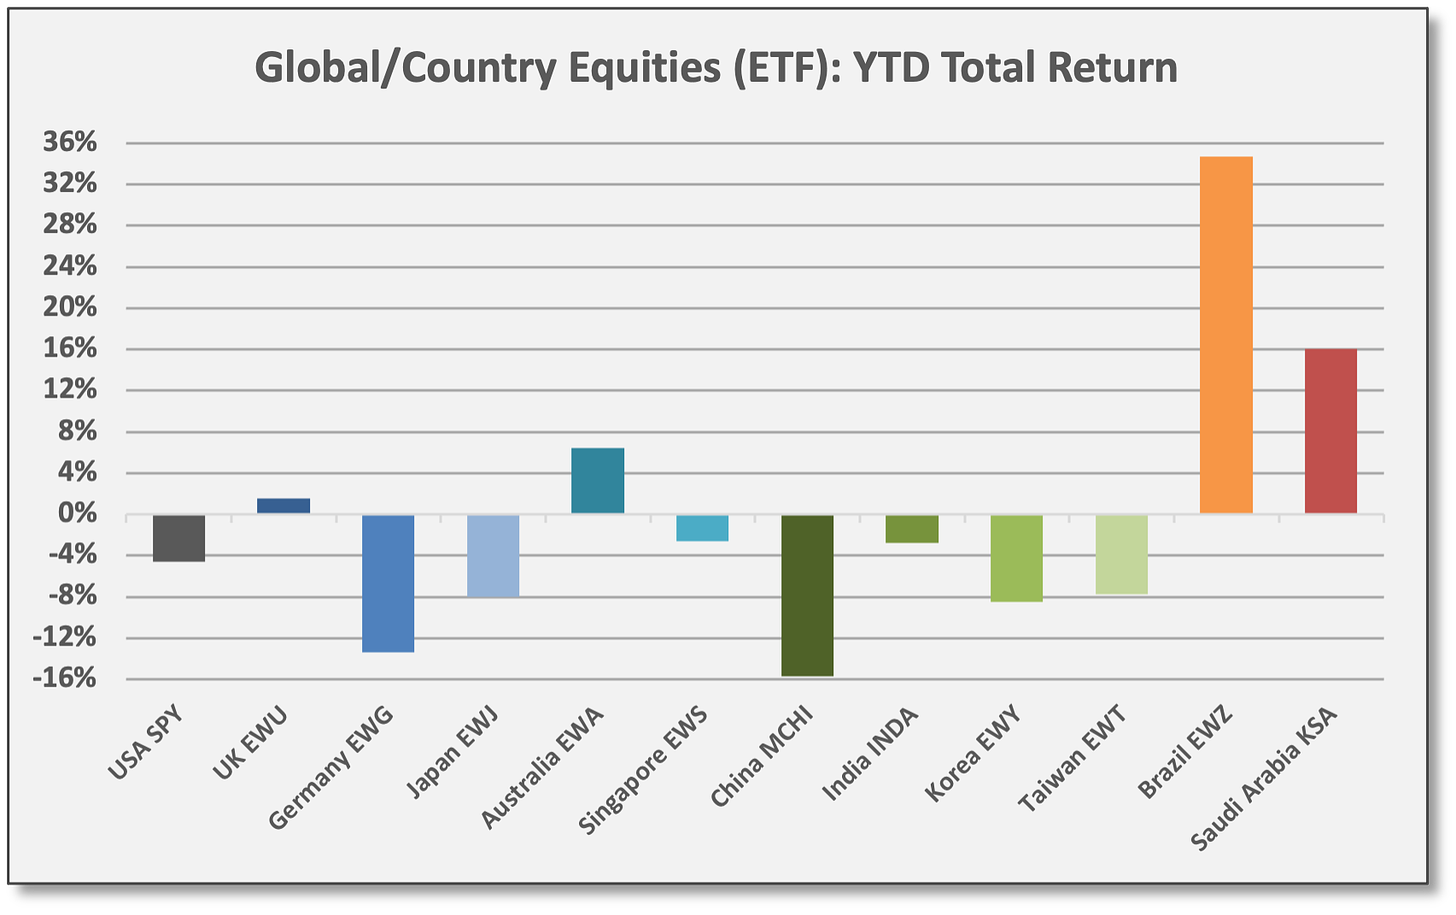
Sources: CCM, Koyfin


Fixed Income & Credit
With interest rates moving higher, most bond sectors posted losses in March and Q1.
After declines in January and February, US Aggregate Bond (AGG) declined again in March with a loss -2.8% for the month to finish down -5.9% for Q1. Long-duration bonds struggled the most: UST 20+ Year (TLT) declined -5.4% and -10.6% in March and Q1, respectively. Even inflation-protected bonds (TIPS) posted losses in Q1 due to rate sensitivity (duration). Only the US dollar was positive for Q1.
Corporate bonds and floating-rate loans also delivered losses for Q1 as credit spreads widened, although losses for loans were modest due to virtually zero interest rate duration. HY bonds (JNK) declined -1.4% in March and -4.9% in Q1 as spreads widened from +310 at the close of 2021 to +343. HY spreads actually rallied along with equities in recent weeks after peaking at 421 in mid March. Investment-grade corporates (LQD) underperformed due to more duration and less coupon; LQD declined -2.9% in March and -8.4% for Q1. IG spreads widened from +98 at the close of 2021 to +122, although spreads tightened from +152 in mid March.
JPMorgan, Global Markets Strategy, 3/30/22: “Credit spreads are narrowing from alarmingly wide levels a few weeks ago, reducing fears of credit market stress. We believe that most of the credit spread widening that had happened during February and March was more of a reflection of the increase in equity volatility, rather than a deterioration in credit fundamentals. With the VIX normalizing, the gap between credit spreads versus equity vol looks too wide at the moment, pointing to further credit spread narrowing from here.”

Sources: CCM, Koyfin, Morningstar 
Sources: CCM, Koyfin, Morningstar UST 2-year yield jumped 155 basis points in Q1 to 2.28%. UST 10-year yield increased 80 bps to 2.32%. The yield curve has flattened dramatically, but the 2-10 spread has yet to invert.
The FOMC made its first rate hike of the new cycle in March, lifting the Fed Funds target 25 bps to 0.50%. FF futures markets are pricing another 250 bps of hikes by March ‘23. Assuming increments of 25 bps, that amounts to 10 hikes, but already the Fed is sending signals that it will move at a faster pace. Quite possibly, the FOMC will hike rates by 50 bps at the upcoming May and June meetings, placing the FF target at 1.50%. Markets seem to be giving tacit approval, having already lifted rates aggressively.
Meanwhile, UST notes/bonds continued to offer a yield advantage versus non-US sovereign debt. UK and German yields have been moving higher along with the US, but Japanese rates remain near zero as the Bank of Japan has voted against rate hikes for the time being.

Sources: CCM, US Treasury 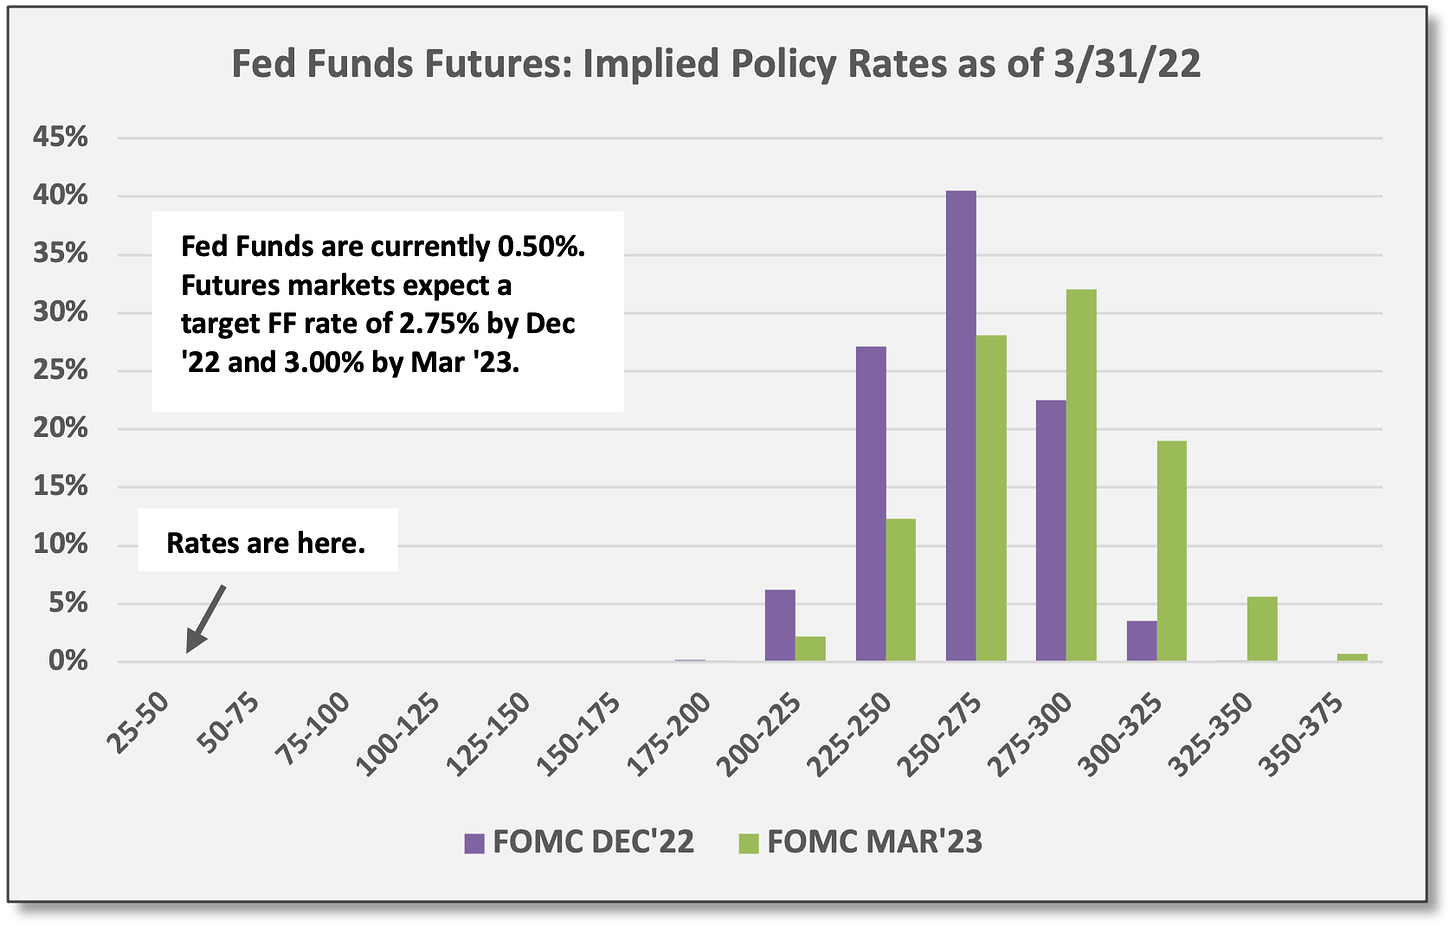
Sources: CCM, CME FedWatch Tool 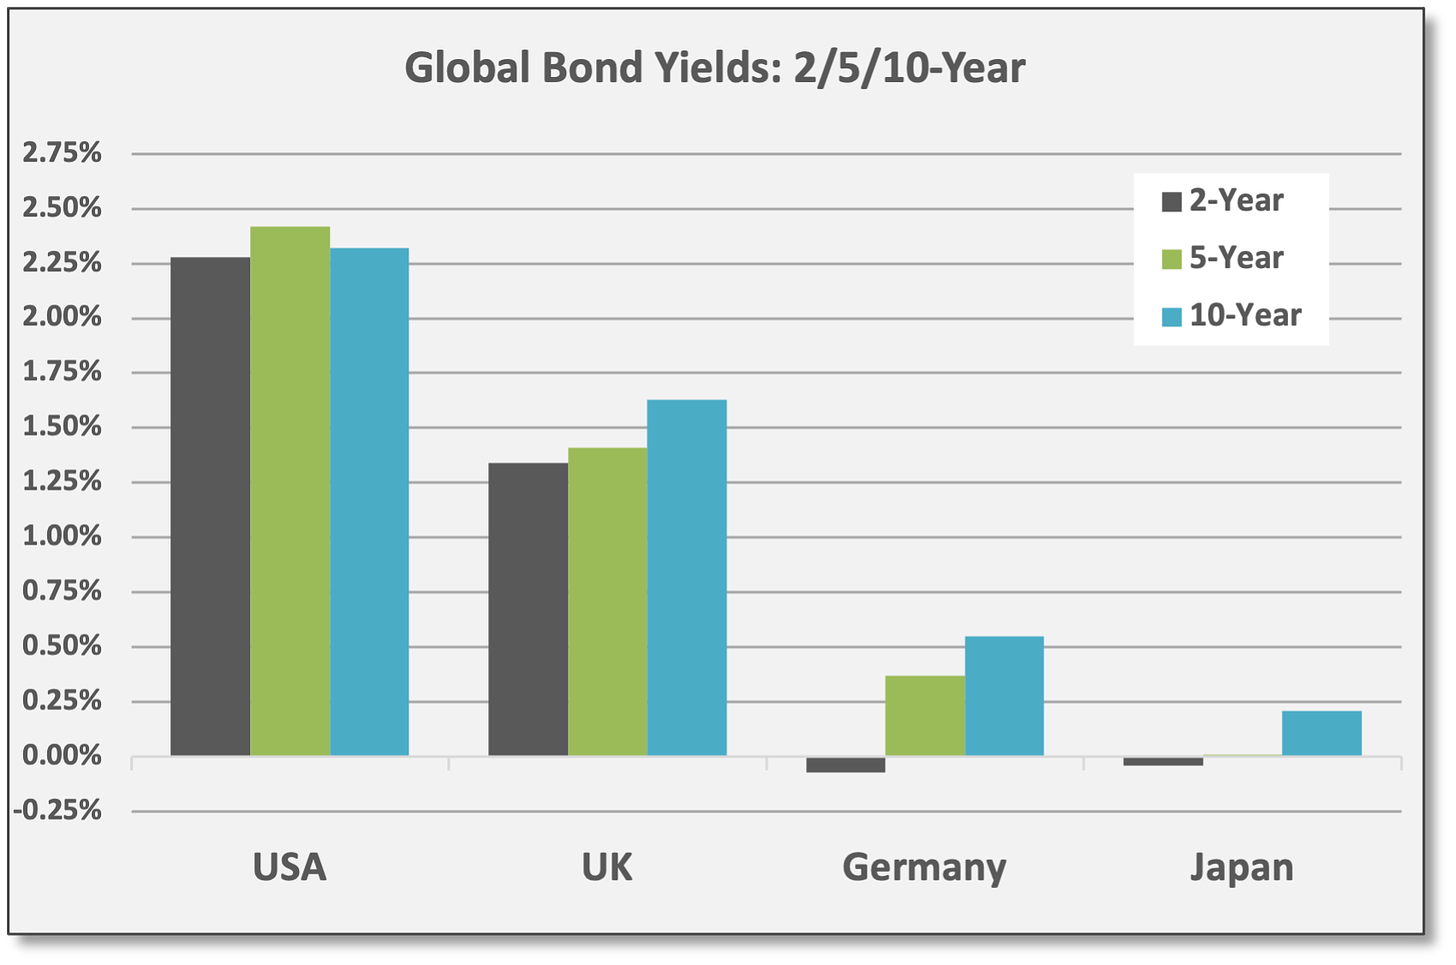
Sources: CCM, Koyfin, Bloomberg


Commodities & Real Assets
Commodities were the top-performing asset class in March, a trend that persisted throughout Q1.
All commodity sub-sectors were positive in Q1 and all delivered gains in March. Diversified Commodities (DBC) gained 9.2% for the month to finish Q1 with a gain of 25.4%. DBC has a 55% allocation to Energy commodities.
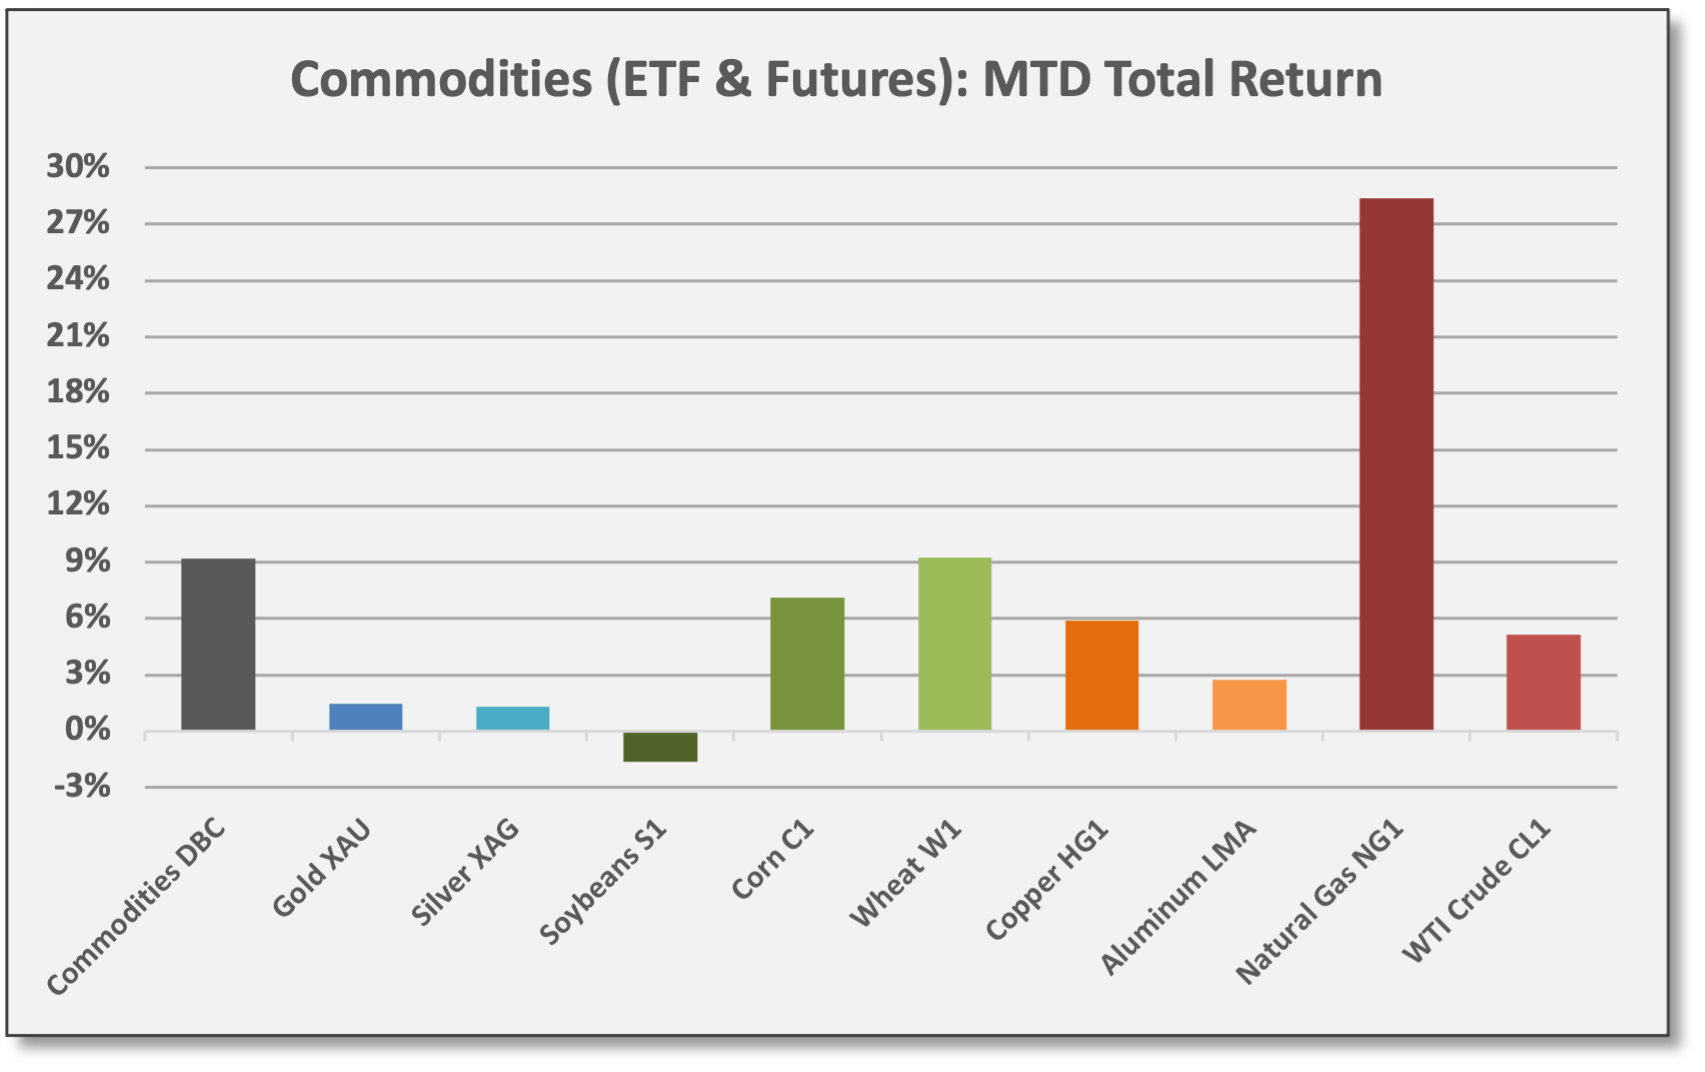
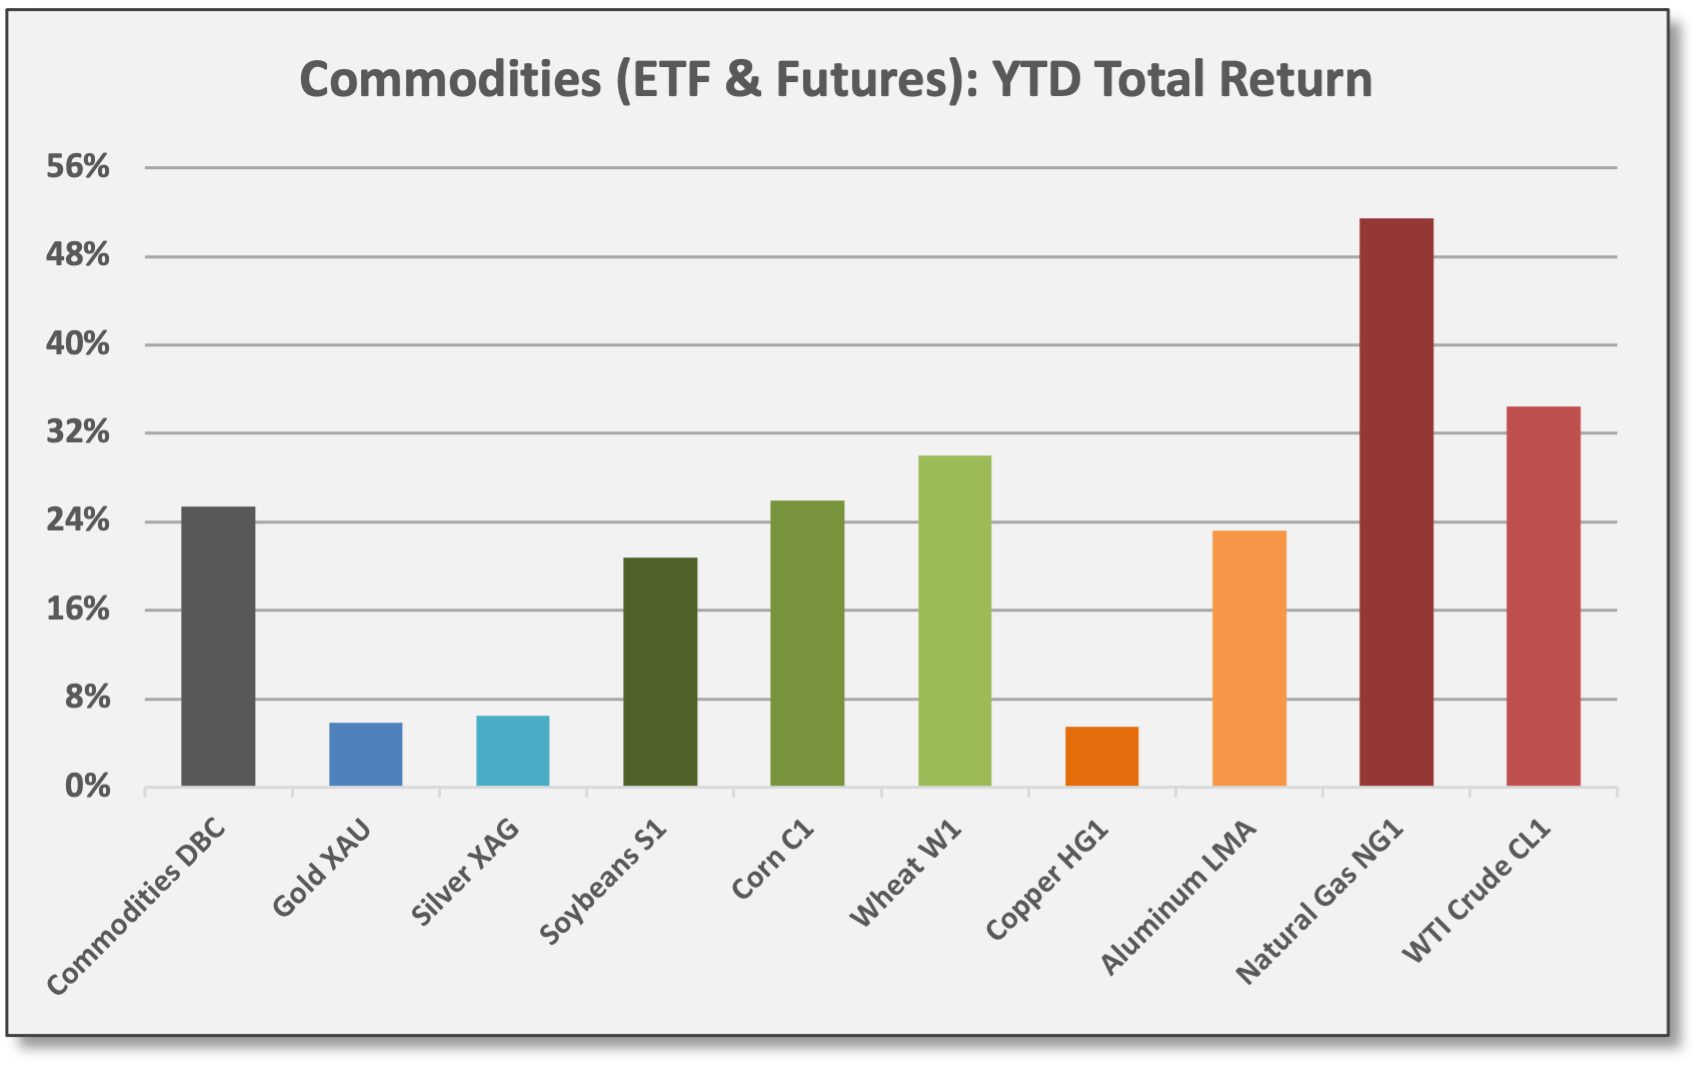
Diversified Energy (DBE) gained 12.2% in March and is up 35.1% for ‘22. Natural Gas (NG1) surged 28.4% in March and is the top-performing sub-sector with a YTD gain of 51.5%. WTI Crude (CL1) closed March at 100.28, up 5.2% for the month and 34.4% for ‘22.
Base Metals (DBB) gained 5.8% in March and are up 16.1% for ‘22. Aluminum (LMA) gained 2.7% for March and is up 23.2% YTD.
Sources: CCM, Koyfin 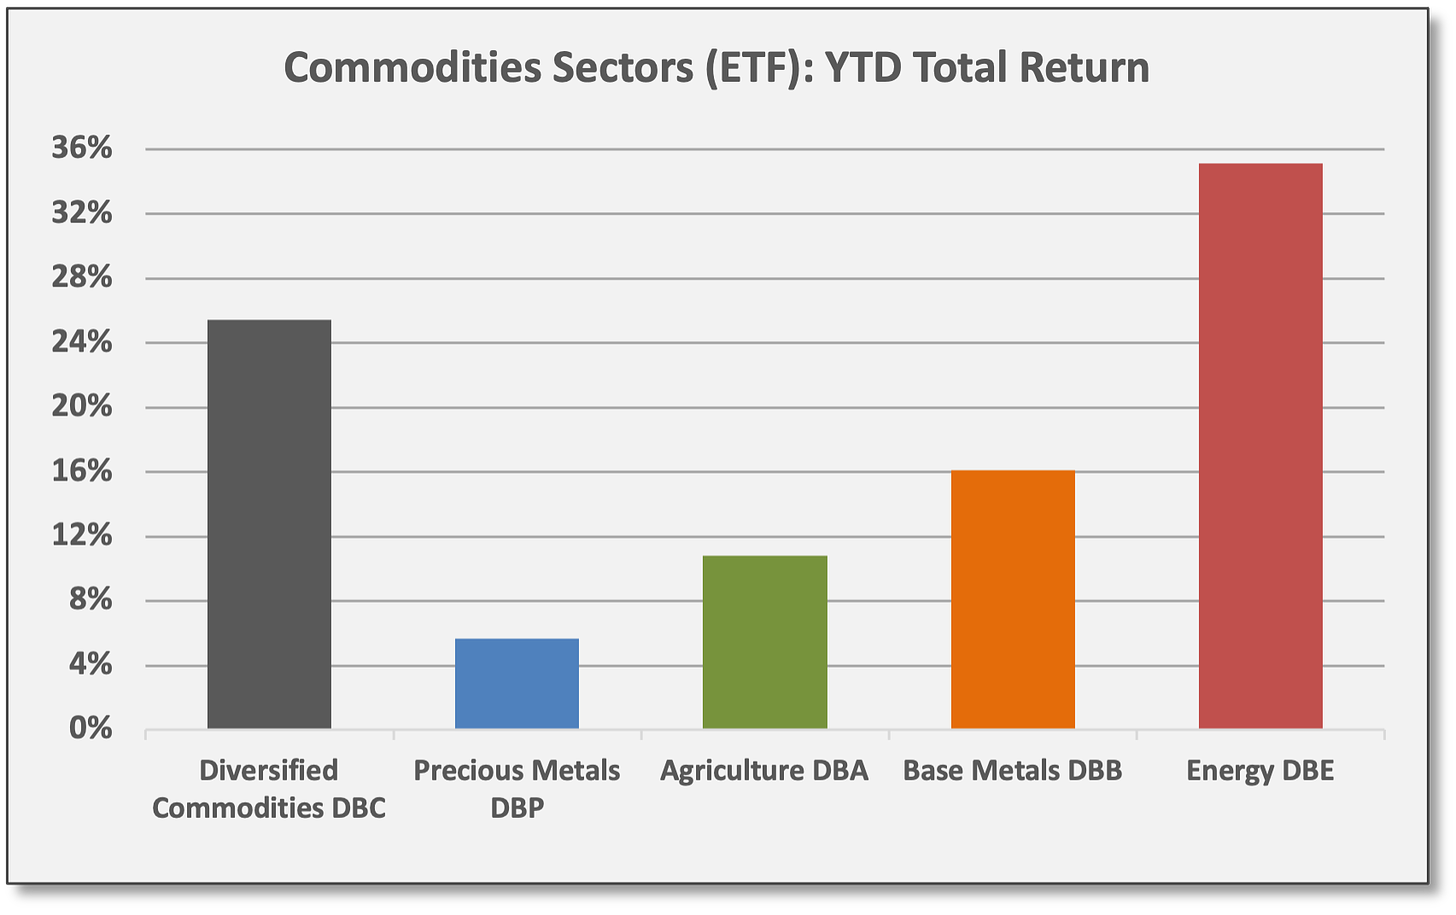
Sources: CCM, Koyfin 
Sources: CCM, Koyfin 
Sources: CCM, Koyfin 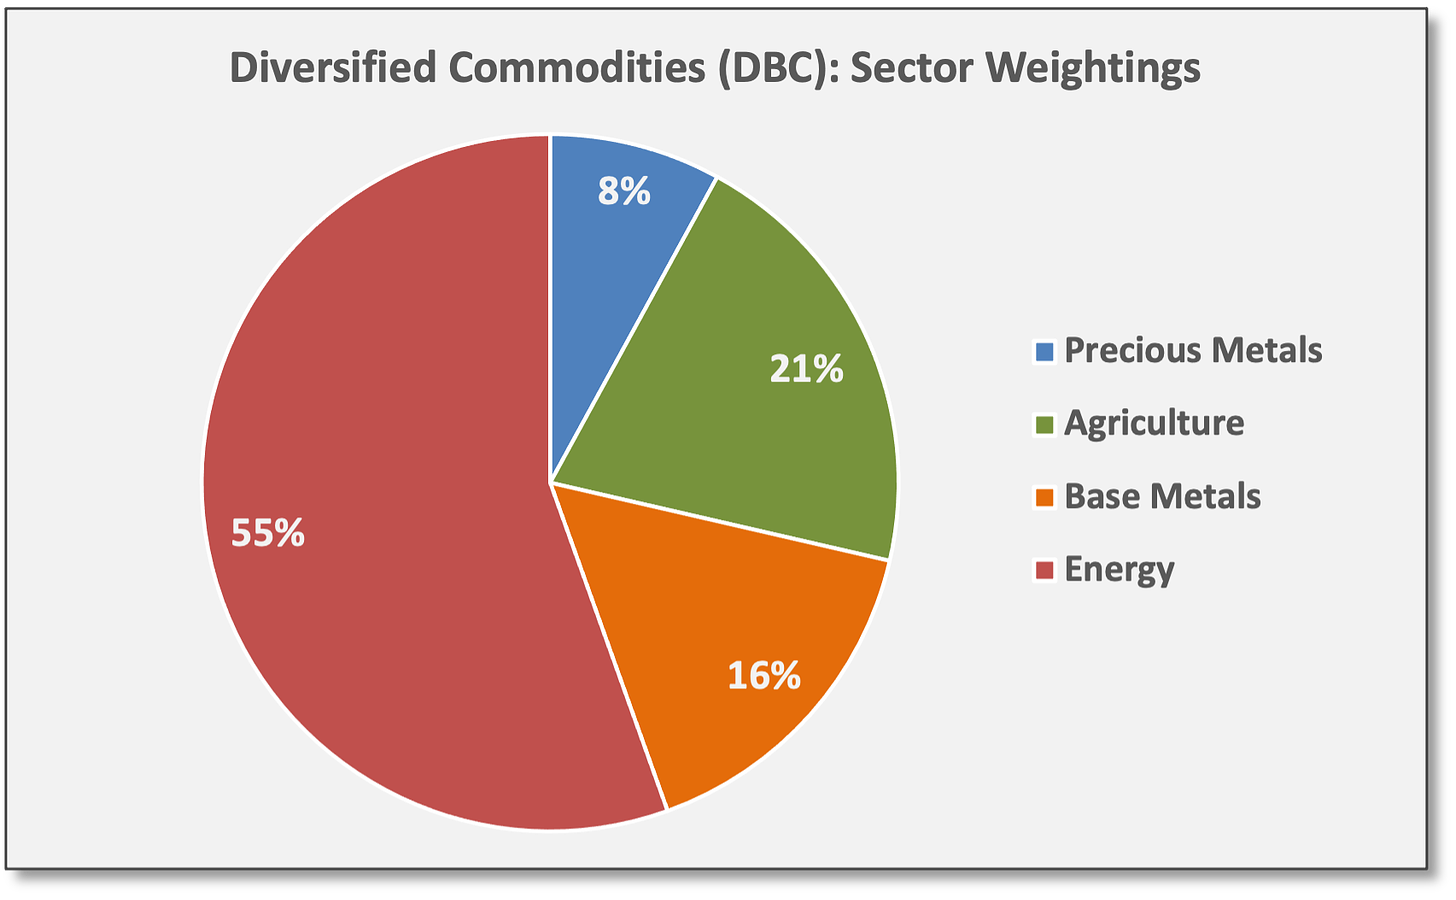
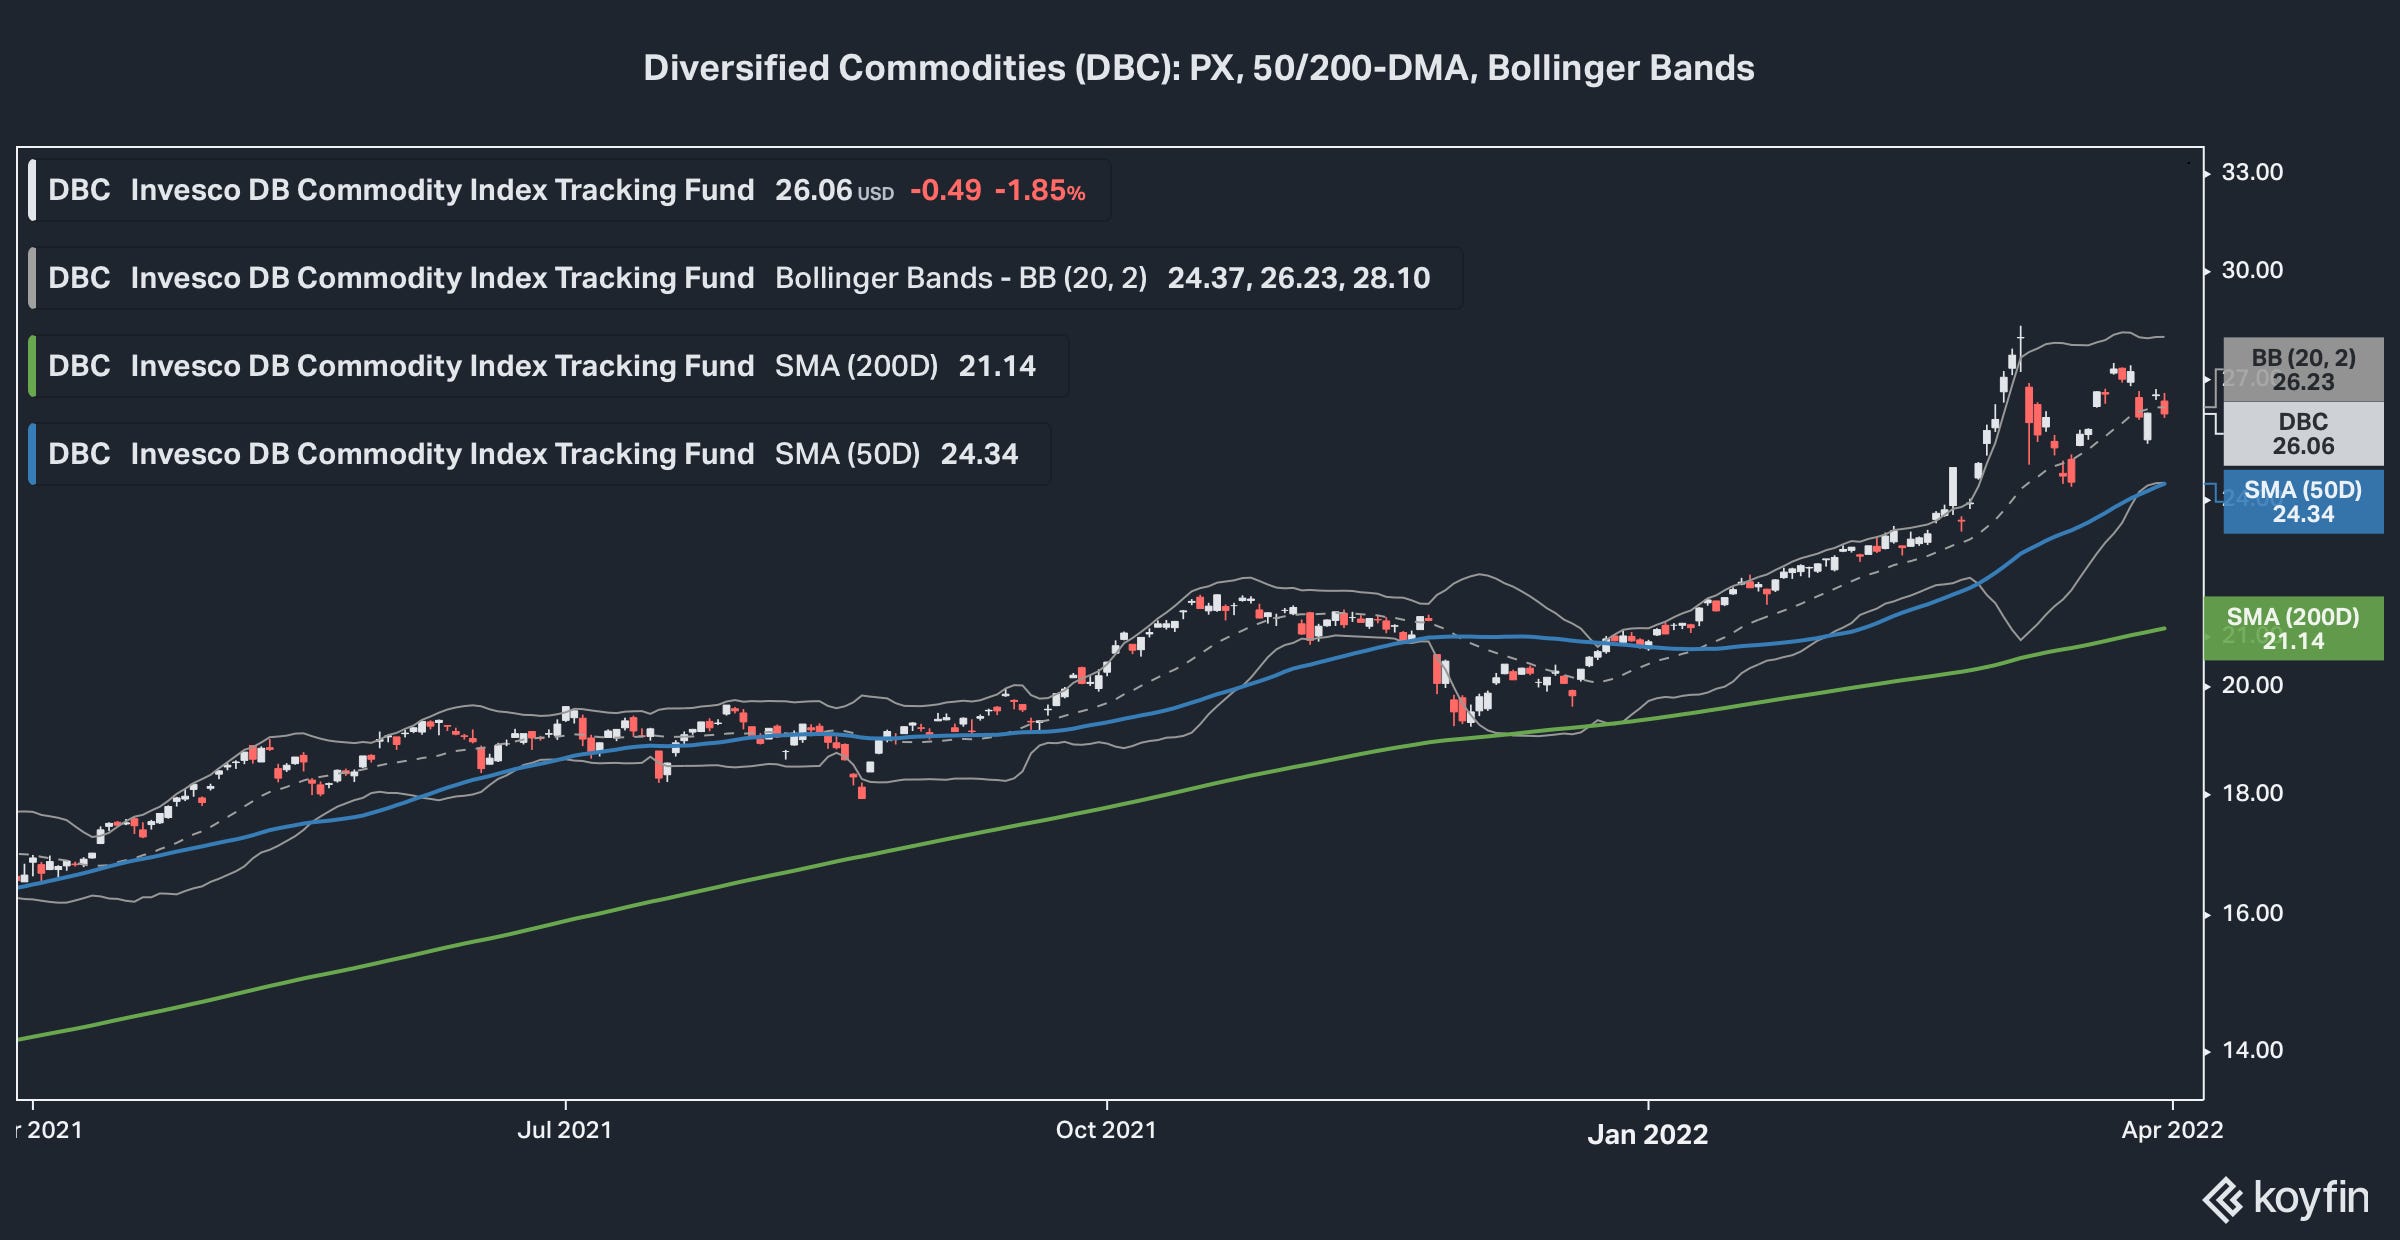
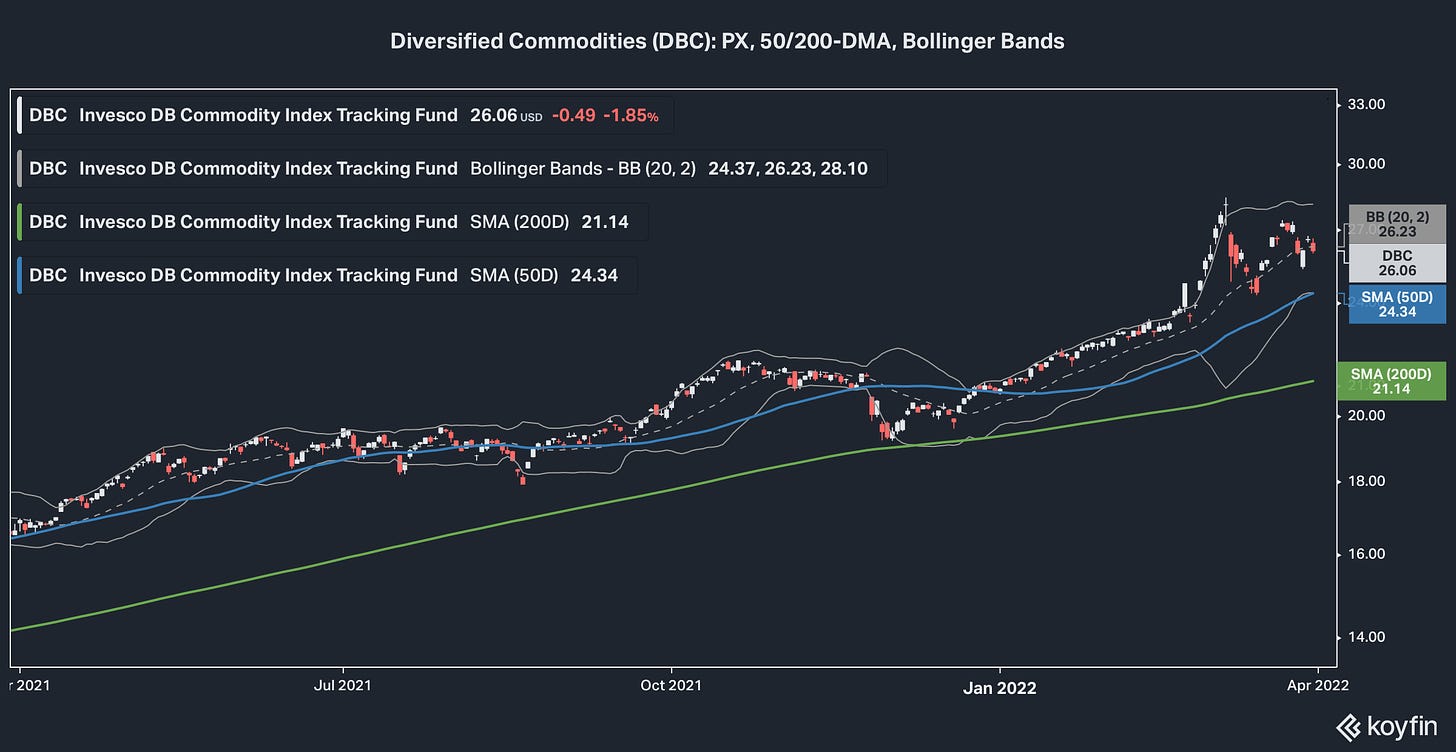
Sources: CCM, Invesco ETFs In March, Diversified Commodities (DBC) experienced elevated volatility with underlying contracts whipping up and down from extreme overbought to extreme oversold levels.
At the close of Q1, DBC remains up-trending, trading above its 200-day moving average and its 50-DMA. DBC trades in the middle of its Bollinger Bands, close to the 20-DMA.
Sources: CCM, Koyfin